5720 W Sargent Rd · Edwards, MI
Flood risk 1/10 · Minimal
- FEMA flood zone
- —
- Chance of flooding over 30 yrs
- 0.0%
- Est. flood insurance / yr
- —
Fire risk 4/10 · Minor
- Est. fire insurance / yr
- $784 – $1,456
Heat risk 1/10 · Minimal
- Hot days now (above 95°F)
- 7 days/yr
- Hot days in 30 yrs
- 13 days/yr
Wind risk 1/10 · Minimal
- Chance of severe wind over 30 yrs
- —
Air-quality risk 2/10 · Minimal
- Unhealthy air days now
- 0 days/yr
- Unhealthy air days in 30 yrs
- 1 days/yr
Risk factors via First Street. Map © Google.
Why this score? — see what drove the B+ grade
The composite is a weighted blend of 9 inputs, each scored 0–100. Each bar is that input's sub-score; the figure is the points it added to the 100-point composite (weight × sub-score).
- Cash flow +30.0/30.0
- ARV discount +15.0/15.0
- 1% rule +10.0/10.0
- DSCR +10.0/10.0
- Schools +2.9/10.0
- Rent growth +2.5/5.0
- Livability +2.5/5.0
- Condition / age +2.5/5.0
- Appreciation +0.0/10.0
$103,000
🖨 Deal sheet 📄 Offer letter ✓ Due diligence
Listing remarks MLS
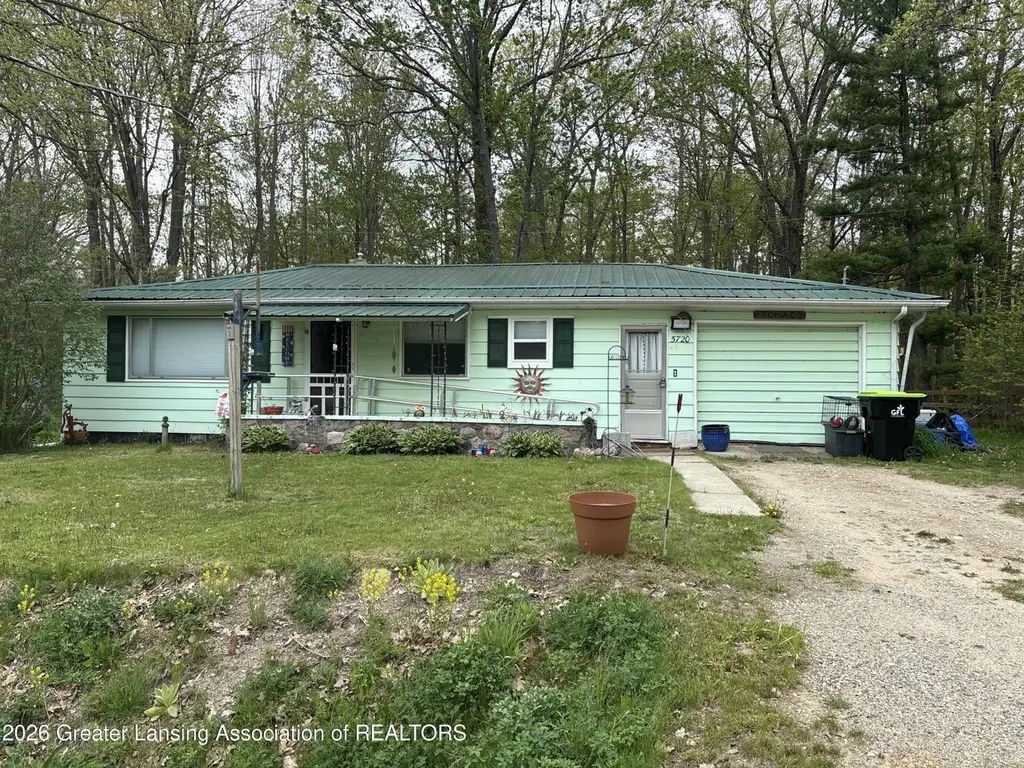
Nestled near beautiful Elk Lake, this 2-bedroom home offers the perfect opportunity for year-round living, weekend getaways, or Up North recreation. Situated on approximately . 84 acre, the property provides room to enjoy the outdoors with a peaceful setting near the lake. Home features an open floor plan, full unfinished basement offering abundant storage or future finishing possibilities. Ramp access to front door available. Enjoy nearby boating, fishing, kayaking, swimming, and the natural beauty Elk Lake is known for. Whether you are looking for a full-time residence, seasonal retreat, or investment opportunity, this property offers potential and location. Convenient access to Gladwin area amenities while still enjoying a relaxing northern Michigan atmosphere.
Key facts
- Open floor plan
- Ramp access
- 0.84 acre lot
Tags
Property features AI
Exterior
- Parking: Attached garage; Driveway
- Utilities: Septic tank; Electricity connected; Asphalt road surface
- Home design: One-level home; Built in 1978; County road frontage
- Construction: Wood siding; Metal roof; Block foundation
- Exterior features: Back yard and front yard; Rectangular lot; Awning(s); Front porch; Double pane windows
Interior
- Kitchen: Refrigerator; Pantry
- Bedrooms: 2 bedrooms (Primary bedroom and second bedroom)
- Flooring: Laminate
- Bathrooms: 1 full bathroom
- Heating & cooling: Forced air heating; Wall/window air conditioning units
- Interior features: Open floorplan; Pantry
- Laundry & utility: Electric dryer hookup on main level; Dryer
Neighborhood map
What this means for you Summary
Snapshot
- This is a 2-bed/1.0-bath single-family listed at $103k.
Deal economics
- At list price, monthly cash flow is $751 ($9k/yr) — positive.
- The deal already cash-flows at list — no discount required.
- Meets the 1% rule at list price ($2k rent vs $103k).
- Recommended offer: $101k (1.5% below list) — sets the bar for market timing.
Location & tenants
- Location reads: area grade B — affects rentability + tenant quality, not the cash-flow math above.
- West Branch-Rose City Area Schools (rural): math 27% / reading 43% proficiency, ranked #306 of 540 in MI (top 57%) — families likely to look elsewhere, expect single-tenant / working-renter base with shorter leases.
- Market conditions: 287 active listings in the ZIP; 57 units permitted in Ogemaw County in 2024 (0 in 5+ unit buildings).
Forward outlook
- Local home prices are declining (-3.0%/yr); year-one equity from $712 of loan paydown is wiped out by about $3k of value loss. Plan a longer hold.
- Ogemaw County population projected at -26% by 2050 — secular population decline; favor cash flow + early exit over multi-decade hold.
- At projected returns (-3.0% appreciation + 3.0% rent growth), your $29k cash investment doubles in ~4 years — after that, you're playing with house money.
Negotiation context
- It's been on market 29 days — a 2% lower offer ($101k) is reasonable based on typical stale-listing flexibility.
- 3 sale attempts since 5y ago; this cycle's ask has dropped $7k (6%) from the opening price — seller is motivated, your offer sets the floor, not the list.
- Current owner paid $70k; 48% above their basis — modest negotiation headroom, anchor on the comps not their cost.
Questions for the listing agent
- Built in 1978 — when were the roof, HVAC, electrical panel, plumbing, and water heater last replaced?
- Is there a deadline driving the sale (1031 exchange, divorce, estate, relocation)? That informs how much negotiation room exists.
- What's the average days-on-market for RENTAL listings here right now (not sales)? A rising rental-DOM trend means longer vacancies and softer asking-rent achievability than the comps imply.
- What's the recent tenant-quality profile in this submarket — average credit score on applications, eviction rate, late-payment / NSF rate, and stable-employment percentage? A property-management company in the area should have these aggregated.
- How much new for-sale + rental construction is in the pipeline within 1–3 miles? Heavy new supply typically softens prices + rents 12–24 months out; constrained supply supports both.
Investment metrics
- 1% rule
- 1.78% ✓
- Cap rate
- 15.04%
- Cash-on-cash
- 31.24%
- DSCR
- 2.39
- GRM
- 4.7
CMA / ARV
- ARV (on-the-fly)
- $148,944
- Comps found
- 4
Show comp detail 4 sales within ~0.75 mi
| Address | Dist | Beds/Ba | Sqft | Sold | Price | $/sf | Match |
|---|---|---|---|---|---|---|---|
| 6478 Tamrack St | 0.42mi | 2/1.0 | 950 (+11%) | 8mo | $125,000 | $132 | 55 |
| 6439 Oak St | 0.53mi | 2/1.0 | 849 (-1%) | 23mo | $152,500 | $180 | 55 |
| 6414 Oak St | 0.54mi | 2/1.0 | 800 (-6%) | 15mo | $139,000 | $174 | 51 |
| 6494 Birch St | 0.40mi | 2/1.0 | 750 (-12%) | 12mo | $59,000 | $79 | 51 |
Match score weights: distance 35% · size 25% · config 20% · recency 20%. Top-matched comps best support the ARV.
Projected returns pro-forma
-3.0% appreciation · 3.0% rent growth · sell at horizon
- IRR
- 26.1%
- Equity multiple
- 2.08×
- Total profit
- $31,146
- Equity at exit
- $15,358
- IRR
- 33.7%
- Equity multiple
- 4.08×
- Total profit
- $88,772
- Equity at exit
- $8,906
Cash invested: $28,840 (down + closing). Projections, not guarantees.
Landlord ↔ Tenant lean methodology
- Overall (STATE)
- 62 Landlord-Friendly
- State Michigan
- 62 Landlord-Friendly · EVEN
- County
- — inherits STATE
- City
- — inherits STATE
ZIP-level market 48624
- Home prices YoY
- -23.4%
- Active inventory
- 287
- Price-to-rent
- 4.7×
Monthly cashflow live
- Estimated rent
- $1,834 medium interval (Pro) →
- Mortgage (P&I)
- −$540
- Tax from tax record
- −$115 /mo · $1,384/yr
- Insurance
- −$43
- HOA
- −$0
- Vacancy / Maint / Mgmt
- −$385
- Net cashflow
- $751
Break-even live
UW: 25.0% down · 7.5% · 30yr · 1.5% tax · 5.0% vac · 8.0% maint · 8.0% mgmt
Financing live
Cash to close
- Down payment
- $25,750
- Closing costs
- $3,090
- Reserves months
- —
- Total cash needed
- —
Loan-product check · same deal, 3 products live
Conventional
25% down · 7.5% · 30yr
- Down + closing
- —
- Monthly P&I
- —
- Monthly cashflow
- —
- DSCR
- —
- Eligible?
- —
Personal DTI + credit; lowest rate.
DSCR
20% down · 8.5% · 30yr
- Down + closing
- —
- Monthly P&I
- —
- Monthly cashflow
- —
- DSCR
- —
- Eligible?
- —
No personal income docs; deal must DSCR.
Hard money
10% down · 12.0% · 12mo
- Down + closing
- —
- Monthly P&I
- —
- Monthly cashflow
- —
- DSCR
- —
- Eligible?
- —
Short-term bridge; refi at stabilization.
Listing history 19 events
-
2026-06-18days on market $103,000 Active 29 DOM
-
2026-06-17days on market $103,000 Active 28 DOM
-
2026-06-16days on market $103,000 Active 27 DOM
-
2026-06-15days on market $103,000 Active 26 DOM
-
2026-06-13days on market $103,000 Active 24 DOM
-
2026-06-12pricedays on market $103,000 Active 23 DOM
-
2026-06-09days on market $110,000 Active 20 DOM
-
2026-06-08days on market $110,000 Active 19 DOM
-
2026-06-07days on market $110,000 Active 18 DOM
-
2026-06-07days on market $110,000 Active 17 DOM
-
2026-06-04days on market $110,000 Active 14 DOM
-
2026-06-02days on market $110,000 Active 13 DOM
-
2026-06-01days on market $110,000 Active 12 DOM
-
2026-05-31days on market $110,000 Active 11 DOM
-
2026-05-31days on market $110,000 Active 10 DOM
-
2026-05-20$110,000 Active
Show marketing remark (774 chars)
Nestled near beautiful Elk Lake, this 2-bedroom home offers the perfect opportunity for year-round living, weekend getaways, or Up North recreation. Situated on approximately . 84 acre, the property provides room to enjoy the outdoors with a peaceful setting near the lake. Home features an open floor plan, full unfinished basement offering abundant storage or future finishing possibilities. Ramp access to front door available. Enjoy nearby boating, fishing, kayaking, swimming, and the natural beauty Elk Lake is known for. Whether you are looking for a full-time residence, seasonal retreat, or investment opportunity, this property offers potential and location. Convenient access to Gladwin area amenities while still enjoying a relaxing northern Michigan atmosphere.
-
2026-05-20$110,000 Active 774-char remark
Show marketing remark (774 chars)
Nestled near beautiful Elk Lake, this 2-bedroom home offers the perfect opportunity for year-round living, weekend getaways, or Up North recreation. Situated on approximately . 84 acre, the property provides room to enjoy the outdoors with a peaceful setting near the lake. Home features an open floor plan, full unfinished basement offering abundant storage or future finishing possibilities. Ramp access to front door available. Enjoy nearby boating, fishing, kayaking, swimming, and the natural beauty Elk Lake is known for. Whether you are looking for a full-time residence, seasonal retreat, or investment opportunity, this property offers potential and location. Convenient access to Gladwin area amenities while still enjoying a relaxing northern Michigan atmosphere.
-
2021-04-02soldstatus $69,500
-
2021-02-15$69,900
ⓘ Source: listings_history table (triggers on properties + properties_extension) + one-shot
backfill from property_details.listing_events for pre-trigger history.
Tax reassessment forecast MI · Partial reset (capped growth)
- Current annual tax
- $1,384 · $115/mo
- Projected year-2 tax
- $1,485 · $124/mo
- Expected delta
- +$101/yr (+$8/mo · 7.3%)
ⓘ Screening estimate from a state-policy table — verify with the county assessor before closing.
Climate risk First Street
- Flood 1/10 Low 0% chance over 30 yrs
- Wildfire 4/10 Moderate
- Heat 1/10 Low 7 d/yr ≥95°F today · 13 d/yr by 30 yrs out
- Wind 1/10 Low
- Air quality 2/10 Low 0 unhealthy d/yr today · 1 by 30 yrs out
Nearby sold comps map
Loading sold comps map…
Walkable amenities ~0.75 mi
Loading nearby amenities…
Taxation est. · year 1
- Rental income
- $22,013
- − Mortgage interest
- −$5,770
- − Property taxes
- −$1,384
- − Insurance
- −$515
- − Repairs & maintenance
- −$1,761
- − Management
- −$1,761
- − Depreciation
- −$2,996
- Taxable income
- $7,826
- Est. tax owed @ 24.0%
- −$1,878
- After-tax cash flow
- $7,131/yr
For passive investors: Depreciation is non-cash, so a rental often shows a tax loss while cash-flowing — sheltering income. Rental losses are passive: they offset passive income freely, and up to $25,000/yr can offset ordinary (W-2) income if you actively participate and your MAGI is under $100k (phasing out to $0 by $150k); unused losses carry forward. On sale, claimed depreciation is recaptured at up to 25%, and gains may owe capital-gains tax (a 1031 exchange can defer both). Figures are a year-1 estimate at your 24.0% rate — not tax advice; consult a CPA.
Schools (NCES district)
- District
- West Branch-Rose City Area Schools
- NCES district ID
- 2635850
- Math proficiency
- 27% ▼ -14.00%
- Reading proficiency
- 43% ▼ -10.00%
- Median HH income
- $38,145
- Composite
- 29.15/100
- National rank
- #6580
- State rank
- #306 of 540 in MI
Livability — Edwards
No livability data for this city. (Only ~50 U.S. cities are tracked.)
Census & demographics
- Population (ZIP)
- 16,269
Population outlook (Ogemaw County) Hauer SSP2
- Today (2025)
- 19,373 people
- By 2030
- 18,348 · -5.3%
- By 2040
- 16,176 · -16.5%
- By 2050
- 14,294 · -26.2%
- By 2075
- 11,280 · -41.8%
- By 2100
- 8,942 · -53.8%
Race, ethnicity, and origin ACS 2023
- Neighborhood character
- Predominantly White (94%)
- Race & ethnicity
- White 94% Two or more races 4% Hispanic / Latino 2%
- Common ancestry
- Romanian 8% Lithuanian 3% Iranian 3%
- Foreign-born
- 1%
- Languages at home
- 95% English-only · German/W. Germanic 4% Spanish 1%
Political lean MEDSL · Ogemaw
- 2024 margin
- Solid R (+42.0) · D 28.4% · R 70.4% · Other 1.3%
- 2008→2024 swing
- -44.4pp toward R · 2008: 2.4pp · 2024: -42.0pp
- All cycles
- 2024: R+42.0 2020: R+40.1 2016: R+36.6 2012: R+6.2 2008: D+2.4
Not yet ingested
- Civics
- —
Market trends
- HPI YoY
- ▼ -72.67%
- Current HPI
- 238.0744
- Rent YoY
- —
- Metro
- —
- State GDP YoY
- ▲ 1.37%
- F500 in state
- 28
Industry mix (Fortune 500 HQ in MI)
| Industry | F500 HQs | Revenue |
|---|---|---|
| Automotive Parts | 3 | $48B |
|
||
| Automotive | 2 | $372B |
|
||
| Chemicals | 1 | $45B |
|
||
| Automotive Retail | 1 | $29B |
|
||
| Healthcare / Medical Devices | 1 | $23B |
|
||
| Automotive Technology | 1 | $20B |
|
||
Price history
+57.4% since first listed4 events — show timeline
- 2026-05-20 Listed $110,000 REALCOMP
- 2026-05-20 Listed $110,000 Greater Lansing AoR
- 2021-04-02 Sold (Public Records) $69,500 Public Records
- 2021-02-15 Listed $69,900 MiRealSource-MiMLS
Property tax history
+4.1%/yrLatest (2024): $1,384 · +5.5% YoY. Source: county tax records.
Cash-flow waterfall
monthlySold comps — $/sqft
last 12 mo · ≤1 miLoading sold comps…