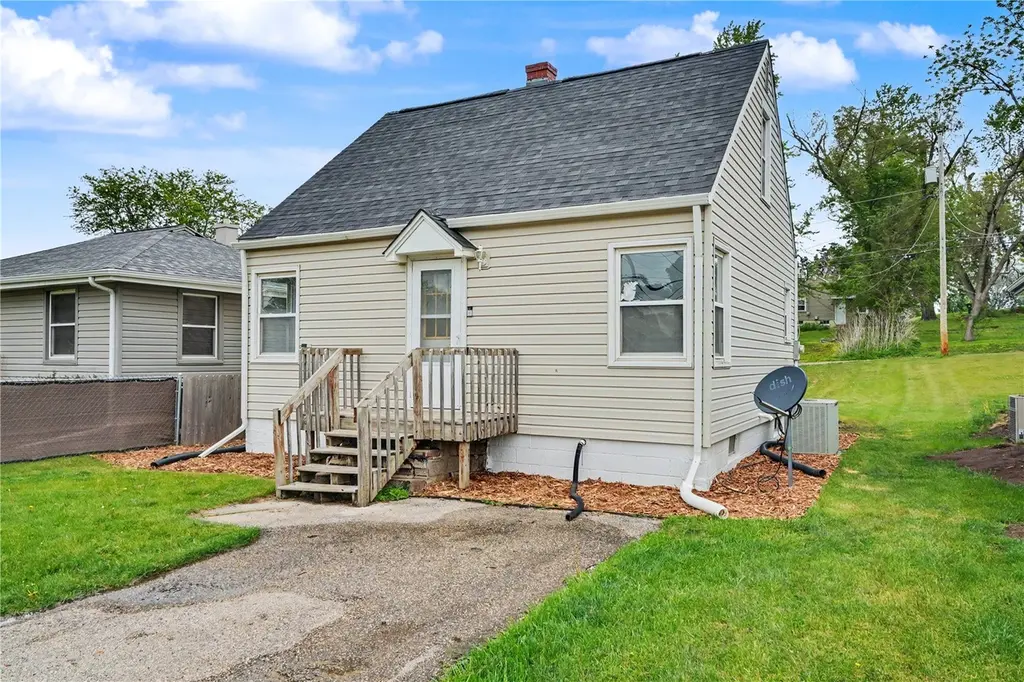
1216 22nd Ave SW · Cedar Rapids, IA
Flood risk 4/10 · Minor
- FEMA flood zone
- X (unshaded)
- Chance of flooding over 30 yrs
- 0.2%
- Est. flood insurance / yr
- $473 – $860
Fire risk 1/10 · Minimal
- Est. fire insurance / yr
- $902 – $1,676
Heat risk 3/10 · Minor
- Hot days now (above 103°F)
- 7 days/yr
- Hot days in 30 yrs
- 15 days/yr
Wind risk 2/10 · Minimal
- Chance of severe wind over 30 yrs
- —
Air-quality risk 2/10 · Minimal
- Unhealthy air days now
- 0 days/yr
- Unhealthy air days in 30 yrs
- 1 days/yr
Risk factors via First Street. Map © Google.
Why this score? — see what drove the F grade
The composite is a weighted blend of 9 inputs, each scored 0–100. Each bar is that input's sub-score; the figure is the points it added to the 100-point composite (weight × sub-score).
- Cash flow +11.0/30.0
- Rent growth +4.7/5.0
- Schools +4.7/10.0
- Livability +3.9/5.0
- DSCR +3.2/10.0
- 1% rule +2.8/10.0
- Condition / age +2.5/5.0
- ARV discount +0.0/15.0
- Appreciation +0.0/10.0
$148,500
🖨 Deal sheet (PDF) 📄 Offer letter ✓ Due diligence
Listing remarks
ACCEPTED OFFER!! Backups are welcome! This property is tucked away on the Southwest side that is located 2 minutes from the interstate. It has been fully renovated from top to bottom. All new floors, all new kitchen, appliances, cabinets, butcher block countertops. All new bathroom, vanity, tub surround, toilet. Brand Patio over looking your very big back yard that has an alley access! The main bedroom is located right off main floor bathroom. Upstairs bedroom is huge and set up to be two different beds rooms if necessary. Plumbing to and thru the house is brand new, new water heater, basement floor been leveled and sealed along with the walls. This is a great space and could be used
Key facts
- 5,619 sq ft lot
- Built 1949
- Listed 20 days
Property features AI
Exterior
- Parking: Off-street parking
- Utilities: Public water; Public sewer
- Home design: Single-family residence; One and one-half story; Frame construction with vinyl siding
- Construction: Frame and vinyl siding construction
- Exterior features: Patio; 0.129-acre lot
Interior
- Kitchen: Dishwasher; Range; Refrigerator; Gas water heater
- Bathrooms: 1 full bathroom
- Heating & cooling: Central air conditioning
- Interior features: Eat-in kitchen; Full basement
Neighborhood map
What this means for you Summary
Snapshot
- This is a 1-bed/1.0-bath single-family listed at $148k.
Deal economics
- At list price, monthly cash flow is $-64 ($-765/yr) — negative.
- To cash-flow at today's rent, offer at most $137k (7.6% below list).
- To meet the 1% rule (rent ≥ 1% of price), the offer needs to be $115k (22.2% below list).
- Recommended offer: $115k (22.2% below list) — sets the bar for 1% rule.
- Cap rate 5.8% vs local median 3.5% in Cedar Rapids — top-decile yield for the area; either an underpriced asset or a hidden risk that comps aren't pricing in. Stress-test before assuming the spread holds.
Location & tenants
- Location reads 78/100 on livability (#134 in IA, #2,474 nationally) — a middle-class / working-renter tenant base. Strengths: cost of living A+, housing A+, health & safety A+; Watch: crime C-, commute F.
- Cedar Rapids Community School District (urban): math 50% / reading 59% proficiency, ranked #265 of 289 in IA (top 92%) — acceptable for families but not a draw, mixed tenant base, ~2y average lease.
- Zoned schools: Grant Elementary School (math 37% / reading 32%, grade F, #595 of 616 statewide, top 97%, 320 students, 72% FRL); Wilson Middle School (math 42% / reading 49%, grade D+, #231 of 246 statewide, top 94%, 395 students, 72% FRL); Thomas Jefferson High School (math 41% / reading 62%, grade D+, #307 of 336 statewide, top 91%, 1,543 students, 56% FRL) — zoned schools average 67% FRL vs 43% district-wide (24 pts higher); higher-poverty schools than district average — tighter screening recommended.
- Market conditions: Rents rising fast (+8.8%/yr); 419 active listings in the ZIP; 3 comparable units currently listed for rent nearby; rentals at typical pace (median 23d on market — plan ~3-4 weeks tenant-placement turnaround); 1,023 units permitted in Linn County in 2024 (456 in 5+ unit buildings).
Forward outlook
- Local home prices are declining (-3.0%/yr); year-one equity from $1k of loan paydown is wiped out by about $4k of value loss. Plan a longer hold.
- Linn County population projected at +16% by 2050 — long-run rental-demand tailwind backs the buy-and-hold thesis.
Negotiation context
- It's been on market 20 days — a 2% lower offer ($146k) is reasonable based on typical stale-listing flexibility.
Risks & watch-outs
- Watch-outs: built in 1949 — expect roof / HVAC / electrical / plumbing capex.
Questions for the listing agent
- What do current leases actually rent for vs. the listed asking? Can we see a recent rent roll and the last 12 months of T-12 income?
- Built in 1949 — when were the roof, HVAC, electrical panel, plumbing, and water heater last replaced?
- Is there a deadline driving the sale (1031 exchange, divorce, estate, relocation)? That informs how much negotiation room exists.
- Schools are B-rated — typically a magnet for longer-tenancy family renters. What's the average tenant stay here, and is there a school-zone premium baked into asking?
- The area grade is low — what's the realistic commute time and amenity access for the typical tenant pool here? Any planned neighborhood developments (good or bad) we should know about?
- What's the average days-on-market for RENTAL listings here right now (not sales)? A rising rental-DOM trend means longer vacancies and softer asking-rent achievability than the comps imply.
- What's the recent tenant-quality profile in this submarket — average credit score on applications, eviction rate, late-payment / NSF rate, and stable-employment percentage? A property-management company in the area should have these aggregated.
- How much new for-sale + rental construction is in the pipeline within 1–3 miles? Heavy new supply typically softens prices + rents 12–24 months out; constrained supply supports both.
Investment metrics
- 1% rule
- 0.78% ✗
- Cap rate
- 5.78%
- Cash-on-cash
- -1.84%
- DSCR
- 0.92
- GRM
- 10.7
CMA / ARV
- ARV (on-the-fly)
- $101,346
- Comps found
- 12
Show comp detail 12 sales within ~0.75 mi
| Address | Dist | Beds/Ba | Sqft | Sold | Price | $/sf | Match |
|---|---|---|---|---|---|---|---|
| 945 19th Ave SW | 0.26mi | 2/1.0 (+1) | 792 (-1%) | 13mo | $136,900 | $173 | 71 |
| 1131 20th Ave Ave SW | 0.14mi | 1/1.0 | 732 (-8%) | 14mo | $110,000 | $150 | 68 |
| 941 21st Ave SW | 0.19mi | 2/1.0 (+1) | 766 (-4%) | 15mo | $83,000 | $108 | 67 |
| 2333 18th St SW | 0.45mi | 2/1.0 (+1) | 796 (-0%) | 14mo | $20,000 | $25 | 62 |
| 642 19th Ave Ave SW | 0.45mi | 2/1.0 (+1) | 812 (+2%) | 11mo | $92,500 | $114 | 62 |
| 2139 Rockford Rd SW | 0.41mi | 2/1.0 (+1) | 812 (+2%) | 14mo | $168,750 | $208 | 61 |
| 938 18th Avenue Ave SW | 0.35mi | 2/1.0 (+1) | 760 (-5%) | 13mo | $92,500 | $122 | 60 |
| 1137 15th Ave | 0.41mi | 2/1.0 (+1) | 763 (-4%) | 10mo | $97,000 | $127 | 60 |
| 657 16th Ave Ave SW | 0.50mi | 1/1.0 | 864 (+8%) | 4mo | $64,000 | $74 | 60 |
| 1209 16th St St SW | 0.63mi | 2/1.0 (+1) | 768 (-4%) | 1mo | $142,000 | $185 | 58 |
| 1244 19 Ave Ave SW | 0.22mi | 2/2.0 (+1) | 905 (+13%) | 4mo | $158,500 | $175 | 54 |
| 2417 Wisconsin St SW | 0.70mi | 2/1.0 (+1) | 796 (-0%) | 14mo | $57,500 | $72 | 50 |
Match score weights: distance 35% · size 25% · config 20% · recency 20%. Top-matched comps best support the ARV.
Projected returns pro-forma
-3.0% appreciation · 8.0% rent growth · sell at horizon
- IRR
- -14.2%
- Equity multiple
- 0.47×
- Total profit
- $-22,033
- Equity at exit
- $22,142
- IRR
- 0.9%
- Equity multiple
- 1.08×
- Total profit
- $3,311
- Equity at exit
- $12,840
Cash invested: $41,580 (down + closing). Projections, not guarantees.
Landlord ↔ Tenant lean methodology
- Overall (STATE)
- 83 Strongly Landlord-Friendly
- State Iowa
- 83 Strongly Landlord-Friendly · R+6
- County
- — inherits STATE
- City
- — inherits STATE
ZIP-level market 52404
- Rents YoY
- 8.8%
- Active inventory
- 419
- Price-to-rent
- 10.7×
Monthly cashflow live
- Estimated rent
- $1,155 medium interval (Pro) →
- Mortgage (P&I)
- −$779
- Tax from tax record
- −$136 /mo · $1,626/yr
- Insurance
- −$62
- HOA
- −$0
- Vacancy / Maint / Mgmt
- −$243
- Net cashflow
- $-64
Break-even live
Sensitivity live
| Price | -10% $20 | -5% $-22 | +0% $-64 | +5% $-106 | +10% $-148 |
|---|---|---|---|---|---|
| Rent | -10% $-155 | -5% $-109 | +0% $-64 | +5% $-18 | +10% $27 |
| Rate | -1.0pp $11 | -0.5pp $-26 | base $-64 | +0.5pp $-102 | +1.0pp $-141 |
UW: 25.0% down · 7.5% · 30yr · 1.5% tax · 5.0% vac · 8.0% maint · 8.0% mgmt
Financing live
Cash to close
- Down payment
- $37,125
- Closing costs
- $4,455
- Reserves months
- —
- Total cash needed
- —
Loan-product check · same deal, 3 products live
Conventional
25% down · 7.5% · 30yr
- Down + closing
- —
- Monthly P&I
- —
- Monthly cashflow
- —
- DSCR
- —
- Eligible?
- —
Personal DTI + credit; lowest rate.
DSCR
20% down · 8.5% · 30yr
- Down + closing
- —
- Monthly P&I
- —
- Monthly cashflow
- —
- DSCR
- —
- Eligible?
- —
No personal income docs; deal must DSCR.
Hard money
10% down · 12.0% · 12mo
- Down + closing
- —
- Monthly P&I
- —
- Monthly cashflow
- —
- DSCR
- —
- Eligible?
- —
Short-term bridge; refi at stabilization.
Rent comps 3 comps
| Address | Beds | Baths | Sqft | Rent | $/sqft | DOM | Units | Dist |
|---|---|---|---|---|---|---|---|---|
| 640 16th Ave SW Cedar Rapids, IA | 1.0 | 1.0 | 595 | $850 | $1.43 | 45d | 2 | 0.55mi |
| 612 4th Ave SW Unit 612 Upper Cedar Rapids, IA | 2.0 | 1.0 | 616 | $2,000 | $3.25 | 23d | 1 | 1.09mi |
| 400 2nd St SW Cedar Rapids, IA | 1.0 | 1.0 | 615 | $1,195 | $1.94 | 23d | 1 | 1.33mi |
Listing history 10 events
-
2026-06-09status $148,500 Pending 20 DOM
-
2026-06-08days on market $148,500 Active 20 DOM
-
2026-06-07days on market $148,500 Active 19 DOM
-
2026-06-05days on market $148,500 Active 16 DOM
-
2026-06-03days on market $148,500 Active 15 DOM
-
2026-06-02days on market $148,500 Active 14 DOM
-
2026-06-01days on market $148,500 Active 13 DOM
-
2026-05-31days on market $148,500 Active 12 DOM
-
2026-05-30days on market $148,500 Active 11 DOM
-
2026-05-19$148,500 Active
ⓘ Source: listings_history table (triggers on properties + properties_extension) + one-shot
backfill from property_details.listing_events for pre-trigger history.
Tax reassessment forecast IA · Partial reset (capped growth)
- Current annual tax
- $1,626 · $136/mo
- Projected year-2 tax
- $1,979 · $165/mo
- Expected delta
- +$353/yr (+$29/mo · 21.7%)
ⓘ Screening estimate from a state-policy table — verify with the county assessor before closing.
Climate risk First Street
- Flood 4/10 Moderate FEMA zone X (unshaded) · 20% chance over 30 yrs
- Wildfire 1/10 Low
- Heat 3/10 Moderate 7 d/yr ≥103°F today · 15 d/yr by 30 yrs out
- Wind 2/10 Low
- Air quality 2/10 Low 0 unhealthy d/yr today · 1 by 30 yrs out
Nearby sold comps map
Loading sold comps map…
Walkable amenities ~0.75 mi
Loading nearby amenities…
Taxation est. · year 1
- Rental income
- $13,859
- − Mortgage interest
- −$8,318
- − Property taxes
- −$1,626
- − Insurance
- −$742
- − Repairs & maintenance
- −$1,109
- − Management
- −$1,109
- − Depreciation
- −$4,320
- Taxable loss
- −$3,365
- Est. tax savings @ 24.0%
- +$808
- After-tax cash flow
- $43/yr
For passive investors: Depreciation is non-cash, so a rental often shows a tax loss while cash-flowing — sheltering income. Rental losses are passive: they offset passive income freely, and up to $25,000/yr can offset ordinary (W-2) income if you actively participate and your MAGI is under $100k (phasing out to $0 by $150k); unused losses carry forward. On sale, claimed depreciation is recaptured at up to 25%, and gains may owe capital-gains tax (a 1031 exchange can defer both). Figures are a year-1 estimate at your 24.0% rate — not tax advice; consult a CPA.
Schools (NCES district)
- District
- Cedar Rapids Community School District
- NCES district ID
- 1906540
- Math proficiency
- 50% ▼ -12.00%
- Reading proficiency
- 59% ▼ -6.00%
- Median HH income
- $53,568
- Composite
- 46.82/100
- National rank
- #2378
- State rank
- #265 of 289 in IA
Livability — Cedar Rapids
- Score
- 78/100
- State rank
- #134
- US rank
- #2474
Category grades
Schools grade is shown separately in the Schools card above.
Census & demographics
- Census place
- Cedar Rapids, IA
- County
- Linn County · 179,860 people
- City population
- 137,154
- Metro
- Cedar Rapids, IA
- Population (ZIP)
- 42,958
- Household income
- $61,870
- Rent vs Own
- Severe rent burden
- 1041.0
Population outlook (Linn County) Hauer SSP2
- Today (2025)
- 239,589 people
- By 2030
- 248,587 · +3.8%
- By 2040
- 264,817 · +10.5%
- By 2050
- 278,685 · +16.3%
- By 2075
- 311,754 · +30.1%
- By 2100
- 336,773 · +40.6%
Race, ethnicity, and origin ACS 2023
- Neighborhood character
- Predominantly White (74%)
- Race & ethnicity
- White 74% Black 10% Two or more races 10% Hispanic / Latino 7%
- Hispanic origin (detail)
- Mexican 5%
- Common ancestry
- Portuguese 3% Lithuanian 2% Romanian 2%
- Foreign-born
- 8% · Canada
- Languages at home
- 90% English-only · Spanish 3% French/Haitian/Cajun 2% Other Asian/Pacific 1%
Political lean MEDSL · Linn
- 2024 margin
- Lean D (+9.9) · D 54.2% · R 44.3% · Other 1.4%
- 2008→2024 swing
- -11.6pp toward R · 2008: 21.5pp · 2024: 9.9pp
- All cycles
- 2024: D+9.9 2020: D+13.7 2016: D+9.0 2012: D+17.6 2008: D+21.5
Not yet ingested
- Civics
- —
Market trends
- HPI YoY
- ▼ -154.96%
- Current HPI
- 241.81
- Rent YoY
- ▲ 8.79%
- Metro
- Cedar Rapids, IA
- State GDP YoY
- ▲ 2.48%
- F500 in state
- 4
Industry mix (Fortune 500 HQ in IA)
| Industry | F500 HQs | Revenue |
|---|---|---|
| Financial Services | 1 | $16B |
|
||
| Retail / Convenience | 1 | $15B |
|
||
Price history
2 events — show timeline
- 2026-06-08 Pending — CRAAR, CDRMLS
- 2026-05-19 Listed $148,500 CRAAR, CDRMLS
Property tax history
+2.2%/yrLatest (2025): $1,626 · +2.7% YoY. Source: county tax records.
Cash-flow waterfall
monthlySold comps — $/sqft
last 12 mo · ≤1 miLoading sold comps…