 🏷️ Likely Rental
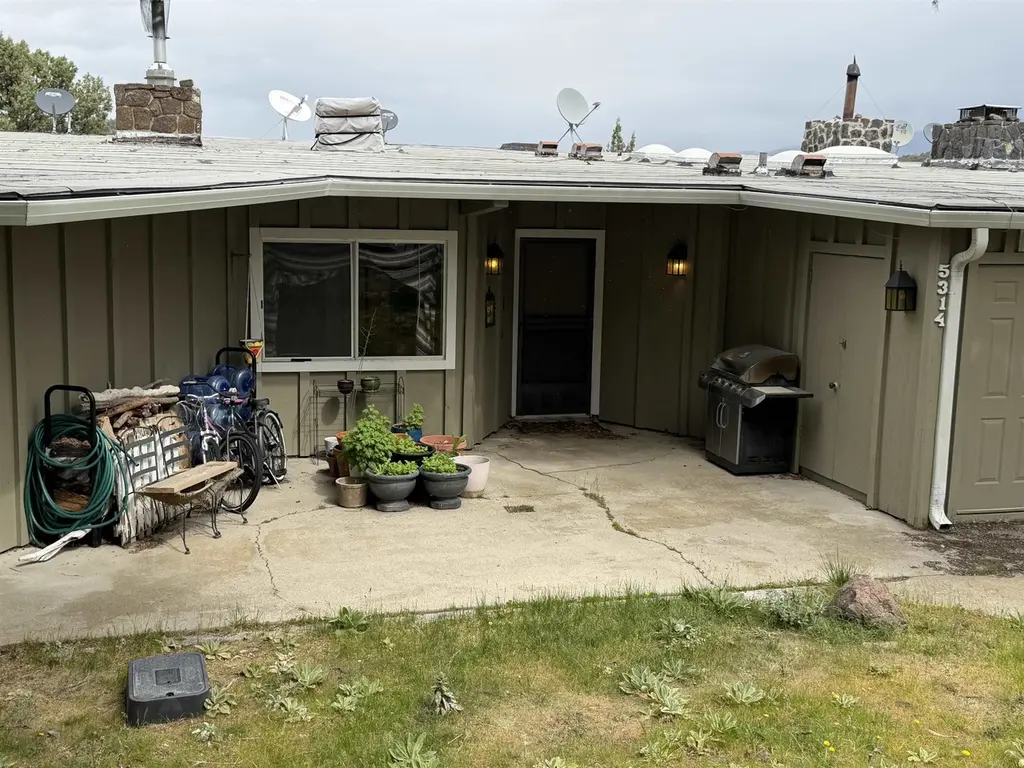
5314 Spearpoint Pt · Lake Shastina, CA
Flood risk 1/10 · Minimal
- FEMA flood zone
- X (unshaded)
- Chance of flooding over 30 yrs
- 0.0%
- Est. flood insurance / yr
- $507 – $1,088
Fire risk 5/10 · Moderate
- Est. fire insurance / yr
- $659 – $1,223
Heat risk 6/10 · Moderate
- Hot days now (above 94°F)
- 7 days/yr
- Hot days in 30 yrs
- 17 days/yr
Wind risk 1/10 · Minimal
- Chance of severe wind over 30 yrs
- —
Air-quality risk 10/10 · Severe
- Unhealthy air days now
- 31 days/yr
- Unhealthy air days in 30 yrs
- 34 days/yr
Risk factors via First Street. Map © Google.
Why this score? — see what drove the D grade
The composite is a weighted blend of 9 inputs, each scored 0–100. Each bar is that input's sub-score; the figure is the points it added to the 100-point composite (weight × sub-score).
- Cash flow +15.1/30.0
- ARV discount +7.5/15.0
- DSCR +4.6/10.0
- 1% rule +4.2/10.0
- Schools +3.9/10.0
- Condition / age +2.8/5.0
- Rent growth +2.5/5.0
- Livability +2.5/5.0
- Appreciation +0.0/10.0
$240,000
🖨 Deal sheet (PDF) 📄 Offer letter ✓ Due diligence
Listing remarks
Lakefront condo with expansive and beautiful views of the Lake Shastina. Located in the Spearpoint Community of Lake Shastina in Weed. This 3 bedroom 3 bathroom condo features two decks, one upstairs, and one down. Both downstairs bedrooms have deck access and views as well. Large picture windows upstairs allow you to enjoy the view year round. This home is waiting for its next owner, or if you prefer, keep the tenant in place, as she would love to stay. It makes a great rental property or use it for yourself as a primary residence or vacation property. Come take a look! Square footage should be verified by any prospective buyer.
Key facts
- 1,742 sq ft lot
- Built 1970
- Listed 13 days
Neighborhood map
What this means for you Summary
Snapshot
- This is a 3-bed/3.0-bath single-family listed at $240k. Condition is rated average.
Deal economics
- At list price, monthly cash flow is $79 ($953/yr) — positive.
- The deal already cash-flows at list — no discount required.
- To meet the 1% rule (rent ≥ 1% of price), the offer needs to be $220k (8.3% below list).
- Recommended offer: $220k (8.3% below list) — sets the bar for 1% rule.
- Cap rate 6.7% vs local median 3.8% in Lake Shastina — top-decile yield for the area; either an underpriced asset or a hidden risk that comps aren't pricing in. Stress-test before assuming the spread holds.
Location & tenants
- Location reads: area grade D — affects rentability + tenant quality, not the cash-flow math above.
- Yreka Union High (town): math 25% / reading 65% proficiency, ranked #630 of 1,400 in CA (top 45%) — families likely to look elsewhere, expect single-tenant / working-renter base with shorter leases.
- Zoned schools: Big Springs Elementary (math 27% / reading 37%, grade F, #779 of 1,571 statewide, top 52%, 153 students, 61% FRL); Yreka High (math 37% / reading 82%, grade C+, #205 of 1,170 statewide, top 19%, 669 students, 52% FRL).
- Market conditions: 278 active listings in the ZIP; 1 comparable units currently listed for rent nearby; 50 units permitted in Siskiyou County in 2024 (0 in 5+ unit buildings).
Forward outlook
- Local home prices are declining (-3.0%/yr); year-one equity from $2k of loan paydown is wiped out by about $7k of value loss. Plan a longer hold.
- Siskiyou County population projected at -26% by 2050 — secular population decline; favor cash flow + early exit over multi-decade hold.
Negotiation context
- Only 13 days on market — expect competitive offers; lowballing is unlikely to land.
Risks & watch-outs
- Climate carrying-cost: moderate wildfire risk; extreme-heat days projected 7→17/yr by 2055 (HVAC capex compounding) — expect insurance premiums to compound above CPI over the hold.
Questions for the listing agent
- Built in 1970 — when were the roof, HVAC, electrical panel, plumbing, and water heater last replaced?
- Is there a deadline driving the sale (1031 exchange, divorce, estate, relocation)? That informs how much negotiation room exists.
- The area grade is low — what's the realistic commute time and amenity access for the typical tenant pool here? Any planned neighborhood developments (good or bad) we should know about?
- This sits on a lake — are riparian / water-frontage rights deeded with the parcel? Any dock permits, shoreline easements, or HOA water-use restrictions?
- What's the documented flood / surge / shoreline-erosion history here (FEMA AND non-FEMA — e.g., storm surge, creek backup, septic-field saturation)?
- Any water-quality or seasonal algae-bloom issues that affect tenant satisfaction or short-term-rental demand?
- What's the average days-on-market for RENTAL listings here right now (not sales)? A rising rental-DOM trend means longer vacancies and softer asking-rent achievability than the comps imply.
- What's the recent tenant-quality profile in this submarket — average credit score on applications, eviction rate, late-payment / NSF rate, and stable-employment percentage? A property-management company in the area should have these aggregated.
- How much new for-sale + rental construction is in the pipeline within 1–3 miles? Heavy new supply typically softens prices + rents 12–24 months out; constrained supply supports both.
Investment metrics
- 1% rule
- 0.92% ✗
- Cap rate
- 6.69%
- Cash-on-cash
- 1.42%
- DSCR
- 1.06
- GRM
- 9.1
CMA / ARV
- ARV (on-the-fly)
- $484,515
- Comps found
- 9
Show comp detail 9 sales within ~0.75 mi
| Address | Dist | Beds/Ba | Sqft | Sold | Price | $/sf | Match |
|---|---|---|---|---|---|---|---|
| 5541 Lake Shastina Dr | 0.18mi | 3/2.0 | 1,984 (+7%) | 4mo | $375,000 | $189 | 73 |
| 5136 Spear Point Rd | 0.24mi | 3/3.0 | 1,600 (-14%) | 2mo | $270,000 | $169 | 65 |
| 5059 Indian Is | 0.43mi | 4/2.5 (+1) | 1,982 (+7%) | 2mo | $591,000 | $298 | 60 |
| 15014 Mountain Wood Dr | 0.67mi | 3/2.0 | 1,939 (+5%) | 4mo | $380,000 | $196 | 54 |
| 15906 Wampum Way | 0.42mi | 3/2.0 | 1,918 (+4%) | 21mo | $335,000 | $175 | 52 |
| 5539 Rainbow Cir | 0.51mi | 3/2.0 | 1,888 (+2%) | 23mo | $329,000 | $174 | 50 |
| 4711 Elkridge Rd | 0.58mi | 2/2.5 (-1) | 1,800 (-3%) | 24mo | $420,000 | $233 | 41 |
| 4703 Lake Shastina Dr | 0.60mi | 2/2.0 (-1) | 1,596 (-14%) | 4mo | $310,000 | $194 | 37 |
| 16724 Rossburg Ct | 0.74mi | 3/2.0 | 1,674 (-10%) | 24mo | $383,000 | $229 | 26 |
Match score weights: distance 35% · size 25% · config 20% · recency 20%. Top-matched comps best support the ARV.
Projected returns pro-forma
-3.0% appreciation · 3.0% rent growth · sell at horizon
- IRR
- -14.0%
- Equity multiple
- 0.50×
- Total profit
- $-33,799
- Equity at exit
- $35,785
- IRR
- -5.2%
- Equity multiple
- 0.66×
- Total profit
- $-22,784
- Equity at exit
- $20,751
Cash invested: $67,200 (down + closing). Projections, not guarantees.
Landlord ↔ Tenant lean methodology
- Overall (STATE)
- 18 Strongly Tenant-Friendly
- State California
- 18 Strongly Tenant-Friendly · D+13
- County
- — inherits STATE
- City
- — inherits STATE
ZIP-level market 96094
- Active inventory
- 278
- Price-to-rent
- 9.1×
Monthly cashflow live
- Estimated rent
- $2,200 medium interval (Pro) →
- Mortgage (P&I)
- −$1,259
- Tax est. 1.5%
- −$300 /mo · $3,600/yr
- Insurance
- −$100
- HOA
- −$0
- Vacancy / Maint / Mgmt
- −$462
- Net cashflow
- $79
Break-even live
Sensitivity live
| Price | -10% $245 | -5% $162 | +0% $79 | +5% $-4 | +10% $-86 |
|---|---|---|---|---|---|
| Rent | -10% $-94 | -5% $-7 | +0% $79 | +5% $166 | +10% $253 |
| Rate | -1.0pp $200 | -0.5pp $140 | base $79 | +0.5pp $17 | +1.0pp $-46 |
UW: 25.0% down · 7.5% · 30yr · 1.5% tax · 5.0% vac · 8.0% maint · 8.0% mgmt
Financing live
Cash to close
- Down payment
- $60,000
- Closing costs
- $7,200
- Reserves months
- —
- Total cash needed
- —
Loan-product check · same deal, 3 products live
Conventional
25% down · 7.5% · 30yr
- Down + closing
- —
- Monthly P&I
- —
- Monthly cashflow
- —
- DSCR
- —
- Eligible?
- —
Personal DTI + credit; lowest rate.
DSCR
20% down · 8.5% · 30yr
- Down + closing
- —
- Monthly P&I
- —
- Monthly cashflow
- —
- DSCR
- —
- Eligible?
- —
No personal income docs; deal must DSCR.
Hard money
10% down · 12.0% · 12mo
- Down + closing
- —
- Monthly P&I
- —
- Monthly cashflow
- —
- DSCR
- —
- Eligible?
- —
Short-term bridge; refi at stabilization.
Rent comps 1 comps
| Address | Beds | Baths | Sqft | Rent | $/sqft | DOM | Units | Dist |
|---|---|---|---|---|---|---|---|---|
| 5407 Stag Mountain Rd Weed, CA | 3.0 | 2.0 | 1450 | $2,200 | $1.52 | 45d | 1 | 0.65mi |
Listing history 2 events
-
2026-04-21status Pending
-
2026-04-08$240,000 Active
ⓘ Source: listings_history table (triggers on properties + properties_extension) + one-shot
backfill from property_details.listing_events for pre-trigger history.
Climate risk First Street
- Flood 1/10 Low FEMA zone X (unshaded) · 0% chance over 30 yrs
- Wildfire 5/10 Major
- Heat 6/10 Major 7 d/yr ≥94°F today · 17 d/yr by 30 yrs out
- Wind 1/10 Low
- Air quality 10/10 Extreme 31 unhealthy d/yr today · 34 by 30 yrs out
Nearby sold comps map
Loading sold comps map…
Walkable amenities ~0.75 mi
Loading nearby amenities…
Taxation est. · year 1
- Rental income
- $26,400
- − Mortgage interest
- −$13,444
- − Property taxes
- −$3,600
- − Insurance
- −$1,200
- − Repairs & maintenance
- −$2,112
- − Management
- −$2,112
- − Depreciation
- −$6,982
- Taxable loss
- −$3,050
- Est. tax savings @ 24.0%
- +$732
- After-tax cash flow
- $1,685/yr
For passive investors: Depreciation is non-cash, so a rental often shows a tax loss while cash-flowing — sheltering income. Rental losses are passive: they offset passive income freely, and up to $25,000/yr can offset ordinary (W-2) income if you actively participate and your MAGI is under $100k (phasing out to $0 by $150k); unused losses carry forward. On sale, claimed depreciation is recaptured at up to 25%, and gains may owe capital-gains tax (a 1031 exchange can defer both). Figures are a year-1 estimate at your 24.0% rate — not tax advice; consult a CPA.
Condition & rehab AI · 12 photos
This lakefront property offers beautiful views but requires moderate repairs and updates to enhance its resale and rental value.
Repairs flagged
- Moderate Exterior siding — Weathered appearance
- Moderate Front porch flooring — Signs of wear
- Moderate Carpeted flooring — Worn appearance
- Moderate Paint — Faded in some areas
- Minor Curtains — Old and outdated
Value-add opportunities
- Resale Paint interior walls — Fresh paint enhances curb appeal and interior aesthetics
- Rental Replace worn carpet — New carpet improves comfort and reduces maintenance
- Both Replace curtains — Fresh curtains enhance both curb appeal and interior aesthetics
- Resale Replace exterior siding — New siding improves curb appeal and enhances home value
- Both Replace front porch flooring — New flooring improves both curb appeal and interior comfort
Renovation cost estimate screening
| Repair item | Severity | Est. cost |
|---|---|---|
| Exterior siding · Weathered appearance | Moderate | $3,000–15,000 |
| Front porch flooring · Signs of wear | Moderate | $3,000–15,000 |
| Carpeted flooring · Worn appearance | Moderate | $3,000–15,000 |
| Paint · Faded in some areas | Moderate | $3,000–15,000 |
| Curtains · Old and outdated | Minor | $500–3,000 |
| Total estimated repair cost · 5 items | $12,500–63,000 |
Value-add ROI direction
- Resale Paint interior walls — Fresh paint enhances curb appeal and interior aesthetics ↑
- Rental Replace worn carpet — New carpet improves comfort and reduces maintenance ↑
- Both Replace curtains — Fresh curtains enhance both curb appeal and interior aesthetics ↑
- Resale Replace exterior siding — New siding improves curb appeal and enhances home value ↑
- Both Replace front porch flooring — New flooring improves both curb appeal and interior comfort ↑
ⓘ Cost ranges are severity-bucket heuristics (US national rule-of-thumb). Get contractor quotes + a written scope before underwriting a rehab budget.
Schools (NCES district)
- District
- Yreka Union High
- NCES district ID
- 0643410
- Math proficiency
- 25% ▼ -15.00%
- Reading proficiency
- 65% ▬ 0.00%
- Median HH income
- $34,206
- Composite
- 39.28/100
- National rank
- #8184
- State rank
- #630 of 1400 in CA
Livability — Lake Shastina
No livability data for this city. (Only ~50 U.S. cities are tracked.)
Census & demographics
- Census place
- Lake Shastina, CA
- Population (ZIP)
- 6,674
Population outlook (Siskiyou County) Hauer SSP2
- Today (2025)
- 39,337 people
- By 2030
- 36,930 · -6.1%
- By 2040
- 32,367 · -17.7%
- By 2050
- 29,030 · -26.2%
- By 2075
- 23,534 · -40.2%
- By 2100
- 19,312 · -50.9%
Race, ethnicity, and origin ACS 2023
- Neighborhood character
- Predominantly White (69%)
- Race & ethnicity
- White 69% Hispanic / Latino 16% Two or more races 8% Black 4% Asian 4% Native American 2%
- Hispanic origin (detail)
- Mexican 13%
- Common ancestry
- Russian 4% Lithuanian 3% Italian 3%
- Foreign-born
- 6% · Canada, China
- Languages at home
- 88% English-only · Spanish 9% Other Asian/Pacific 1% German/W. Germanic 1%
Political lean MEDSL · Siskiyou
- 2024 margin
- R (+19.2) · D 38.8% · R 58.0% · Other 3.2%
- 2008→2024 swing
- -8.8pp toward R · 2008: -10.4pp · 2024: -19.2pp
- All cycles
- 2024: R+19.2 2020: R+15.8 2016: R+20.7 2012: R+15.6 2008: R+10.4
Not yet ingested
- Civics
- —
Market trends
- HPI YoY
- ▼ -170.11%
- Current HPI
- 152.605
- Rent YoY
- —
- Metro
- —
- State GDP YoY
- ▲ 3.21%
- F500 in state
- 116
Industry mix (Fortune 500 HQ in CA)
| Industry | F500 HQs | Revenue |
|---|---|---|
| Technology | 27 | $1,492B |
|
||
| Financial Services | 3 | $174B |
|
||
| Retail | 3 | $44B |
|
||
| Insurance | 3 | $26B |
|
||
| Media / Entertainment | 2 | $115B |
|
||
| Pharmaceuticals / Biotech | 2 | $62B |
|
||
Price history
2 events — show timeline
- 2026-04-21 Pending — SMLS
- 2026-04-08 Listed $240,000 SMLS
Cash-flow waterfall
monthlySold comps — $/sqft
last 12 mo · ≤1 miLoading sold comps…