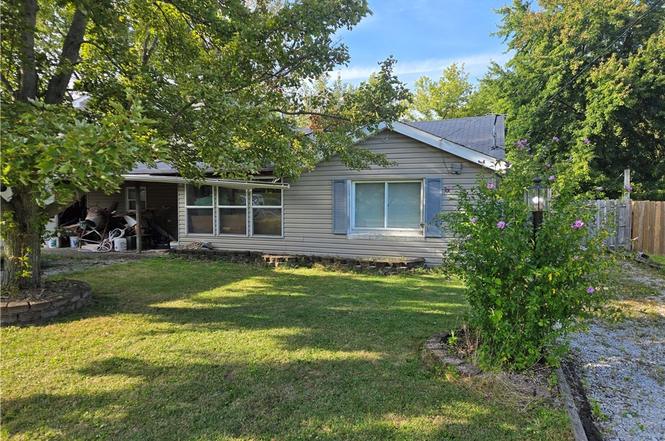
182 E Hamilton St · Oberlin, OH
Flood risk 1/10 · Minimal
- FEMA flood zone
- X (unshaded)
- Chance of flooding over 30 yrs
- 0.0%
- Est. flood insurance / yr
- $473 – $860
Fire risk 1/10 · Minimal
- Est. fire insurance / yr
- $713 – $1,323
Heat risk 3/10 · Minor
- Hot days now (above 99°F)
- 7 days/yr
- Hot days in 30 yrs
- 16 days/yr
Wind risk 1/10 · Minimal
- Chance of severe wind over 30 yrs
- —
Air-quality risk 2/10 · Minimal
- Unhealthy air days now
- 1 days/yr
- Unhealthy air days in 30 yrs
- 2 days/yr
Risk factors via First Street. Map © Google.
Why this score? — see what drove the B grade
The composite is a weighted blend of 9 inputs, each scored 0–100. Each bar is that input's sub-score; the figure is the points it added to the 100-point composite (weight × sub-score).
- Cash flow +30.0/30.0
- 1% rule +10.0/10.0
- DSCR +10.0/10.0
- ARV discount +7.5/15.0
- Schools +4.2/10.0
- Livability +4.2/5.0
- Rent growth +2.5/5.0
- Condition / age +2.5/5.0
- Appreciation +0.0/10.0
$115,000
🖨 Deal sheet 📄 Offer letter ✓ Due diligence
Listing remarks
This spacious four-bedroom home presents an excellent opportunity for buyers seeking a property with renovation potential. While the house currently requires significant repairs and updates, its generous layout and prime location make it a worthwhile investment for those willing to put in the work. Whether you plan to live in it, rent it out, or resell after renovations, this home is a promising canvas for your ideas. Serious buyers only.
Key facts
- Generous layout
- Prime location
- 0.48 acre lot
Tags
Neighborhood map
What this means for you Summary
Snapshot
- This is a 4-bed/2.0-bath single-family listed at $115k.
Deal economics
- At list price, monthly cash flow is $647 ($8k/yr) — positive.
- The deal already cash-flows at list — no discount required.
- Meets the 1% rule at list price ($2k rent vs $115k).
- Recommended offer: $101k (12.0% below list) — sets the bar for market timing.
- Cap rate 13.0% vs local median 4.0% in Oberlin — top-decile yield for the area; either an underpriced asset or a hidden risk that comps aren't pricing in. Stress-test before assuming the spread holds.
Location & tenants
- Location reads 83/100 on livability (#62 in OH, #923 nationally) — a professional / high-income tenant draw. Strengths: cost of living A+, housing A+, amenities A; Watch: employment D+, commute F.
- Oberlin City Schools (town): math 41% / reading 56% proficiency, ranked #447 of 656 in OH (top 68%) — families likely to look elsewhere, expect single-tenant / working-renter base with shorter leases.
- Market conditions: 38 active listings in the ZIP; 1,098 units permitted in Lorain County in 2024 (20 in 5+ unit buildings).
- This rent runs 31% of the median local income ($74k/yr) — at the standard rent-burdened threshold; future hikes will face affordability resistance.
Forward outlook
- Local home prices are declining (-3.0%/yr); year-one equity from $795 of loan paydown is wiped out by about $3k of value loss. Plan a longer hold.
- At projected returns (-3.0% appreciation + 3.0% rent growth), your $32k cash investment doubles in ~6 years — after that, you're playing with house money.
Negotiation context
- It's been on market 211 days — a 12% lower offer ($101k) is reasonable based on typical stale-listing flexibility.
- Current owner paid $28k; list at $115k implies a 304% gain — meaningful room to come down on a strong offer.
Risks & watch-outs
- Watch-outs: built in 1951 — expect roof / HVAC / electrical / plumbing capex.
Questions for the listing agent
- It's been on market 211 days. Have you received any prior offers? Is the seller open to a 12% concession, seller financing, or rate buy-down credit?
- Built in 1951 — when were the roof, HVAC, electrical panel, plumbing, and water heater last replaced?
- Why hasn't it sold? Are there any deal-killer items the seller is aware of (foundation, flood, title, zoning, code violations)?
- Is there a deadline driving the sale (1031 exchange, divorce, estate, relocation)? That informs how much negotiation room exists.
- Schools are A-rated — typically a magnet for longer-tenancy family renters. What's the average tenant stay here, and is there a school-zone premium baked into asking?
- What's the average days-on-market for RENTAL listings here right now (not sales)? A rising rental-DOM trend means longer vacancies and softer asking-rent achievability than the comps imply.
- What's the recent tenant-quality profile in this submarket — average credit score on applications, eviction rate, late-payment / NSF rate, and stable-employment percentage? A property-management company in the area should have these aggregated.
- How much new for-sale + rental construction is in the pipeline within 1–3 miles? Heavy new supply typically softens prices + rents 12–24 months out; constrained supply supports both.
Investment metrics
- 1% rule
- 1.66% ✓
- Cap rate
- 13.05%
- Cash-on-cash
- 24.12%
- DSCR
- 2.07
- GRM
- 5.0
CMA / ARV
- ARV (on-the-fly)
- $236,124
- Comps found
- 7
Show comp detail 7 sales within ~0.75 mi
| Address | Dist | Beds/Ba | Sqft | Sold | Price | $/sf | Match |
|---|---|---|---|---|---|---|---|
| 14409 State Route 58 | 0.41mi | 4/2.0 | 2,049 (+9%) | 0mo | $253,000 | $123 | 65 |
| 365 S Pleasant St | 0.23mi | 3/2.0 (-1) | 1,953 (+4%) | 22mo | $169,000 | $87 | 59 |
| 83 S Pleasant St | 0.68mi | 5/2.0 (+1) | 1,832 (-2%) | 3mo | $170,000 | $93 | 57 |
| 62 Locust St | 0.51mi | 3/2.5 (-1) | 1,800 (-4%) | 8mo | $265,000 | $147 | 56 |
| 110 Shipherd Cir | 0.70mi | 3/2.5 (-1) | 1,898 (+1%) | 5mo | $239,000 | $126 | 54 |
| 45295 Parsons Rd | 0.48mi | 3/2.5 (-1) | 1,766 (-6%) | 21mo | $270,000 | $153 | 44 |
| 55 Spring St | 0.72mi | 5/2.0 (+1) | 1,944 (+4%) | 20mo | $279,275 | $144 | 38 |
Match score weights: distance 35% · size 25% · config 20% · recency 20%. Top-matched comps best support the ARV.
Projected returns pro-forma
-3.0% appreciation · 3.0% rent growth · sell at horizon
- IRR
- 17.4%
- Equity multiple
- 1.70×
- Total profit
- $22,651
- Equity at exit
- $17,147
- IRR
- 25.9%
- Equity multiple
- 3.27×
- Total profit
- $73,078
- Equity at exit
- $9,943
Cash invested: $32,200 (down + closing). Projections, not guarantees.
Landlord ↔ Tenant lean methodology
- Overall (STATE)
- 73 Landlord-Friendly
- State Ohio
- 73 Landlord-Friendly · R+6
- County
- — inherits STATE
- City
- — inherits STATE
ZIP-level market 44074
- Home prices YoY
- -25.8%
- Active inventory
- 38
- Price-to-rent
- 5.0×
Monthly cashflow live
- Estimated rent
- $1,908 medium interval (Pro) →
- Mortgage (P&I)
- −$603
- Tax from tax record
- −$210 /mo · $2,514/yr
- Insurance
- −$48
- HOA
- −$0
- Vacancy / Maint / Mgmt
- −$401
- Net cashflow
- $647
Break-even live
UW: 25.0% down · 7.5% · 30yr · 1.5% tax · 5.0% vac · 8.0% maint · 8.0% mgmt
Financing live
Cash to close
- Down payment
- $28,750
- Closing costs
- $3,450
- Reserves months
- —
- Total cash needed
- —
Loan-product check · same deal, 3 products live
Conventional
25% down · 7.5% · 30yr
- Down + closing
- —
- Monthly P&I
- —
- Monthly cashflow
- —
- DSCR
- —
- Eligible?
- —
Personal DTI + credit; lowest rate.
DSCR
20% down · 8.5% · 30yr
- Down + closing
- —
- Monthly P&I
- —
- Monthly cashflow
- —
- DSCR
- —
- Eligible?
- —
No personal income docs; deal must DSCR.
Hard money
10% down · 12.0% · 12mo
- Down + closing
- —
- Monthly P&I
- —
- Monthly cashflow
- —
- DSCR
- —
- Eligible?
- —
Short-term bridge; refi at stabilization.
Listing history 4 events
-
2026-04-09status Pending
-
2025-11-13price $115,000
-
2025-09-08$140,000 Active
-
1986-10-31soldstatus $28,500
ⓘ Source: listings_history table (triggers on properties + properties_extension) + one-shot
backfill from property_details.listing_events for pre-trigger history.
Tax reassessment forecast OH · Partial reset (capped growth)
- Current annual tax
- $2,514 · $210/mo
- Projected year-2 tax
- $2,514 · $210/mo
- Expected delta
- $0/yr ($0/mo · 0.0%)
ⓘ Screening estimate from a state-policy table — verify with the county assessor before closing.
Climate risk First Street
- Flood 1/10 Low FEMA zone X (unshaded) · 0% chance over 30 yrs
- Wildfire 1/10 Low
- Heat 3/10 Moderate 7 d/yr ≥99°F today · 16 d/yr by 30 yrs out
- Wind 1/10 Low
- Air quality 2/10 Low 1 unhealthy d/yr today · 2 by 30 yrs out
Nearby sold comps map
Loading sold comps map…
Walkable amenities ~0.75 mi
Loading nearby amenities…
Taxation est. · year 1
- Rental income
- $22,901
- − Mortgage interest
- −$6,442
- − Property taxes
- −$2,514
- − Insurance
- −$575
- − Repairs & maintenance
- −$1,832
- − Management
- −$1,832
- − Depreciation
- −$3,345
- Taxable income
- $6,360
- Est. tax owed @ 24.0%
- −$1,526
- After-tax cash flow
- $6,239/yr
For passive investors: Depreciation is non-cash, so a rental often shows a tax loss while cash-flowing — sheltering income. Rental losses are passive: they offset passive income freely, and up to $25,000/yr can offset ordinary (W-2) income if you actively participate and your MAGI is under $100k (phasing out to $0 by $150k); unused losses carry forward. On sale, claimed depreciation is recaptured at up to 25%, and gains may owe capital-gains tax (a 1031 exchange can defer both). Figures are a year-1 estimate at your 24.0% rate — not tax advice; consult a CPA.
Schools (NCES district)
- District
- Oberlin City Schools
- NCES district ID
- 3904459
- Math proficiency
- 41% ▼ -21.00%
- Reading proficiency
- 56% ▼ -7.00%
- Median HH income
- $54,514
- Composite
- 41.92/100
- National rank
- #3362
- State rank
- #447 of 656 in OH
Livability — Oberlin
- Score
- 83/100
- State rank
- #62
- US rank
- #923
Category grades
Schools grade is shown separately in the Schools card above.
Census & demographics
- Census place
- Oberlin, OH
- County
- Lorain · 305,041 people
- City population
- 11,684
- Metro
- Cleveland, OH
- Population (ZIP)
- 11,684
- Household income
- $73,697
- Rent vs Own
- Severe rent burden
- 7.1
Population outlook (Lorain County) Hauer SSP2
- Today (2025)
- 314,924 people
- By 2030
- 317,546 · +0.8%
- By 2040
- 317,962 · +1.0%
- By 2050
- 312,872 · -0.7%
- By 2075
- 301,806 · -4.2%
- By 2100
- 278,271 · -11.6%
Race, ethnicity, and origin ACS 2023
- Neighborhood character
- Predominantly White (75%)
- Race & ethnicity
- White 75% Two or more races 11% Black 9% Hispanic / Latino 6% Asian 3%
- Hispanic origin (detail)
- Mexican 2% Puerto Rican 2%
- Common ancestry
- Romanian 5% Slovak 2% Lithuanian 2%
- Foreign-born
- 4% · Canada, China
- Languages at home
- 92% English-only · Spanish 3% Other Indo-European 1% Chinese 1%
Political lean MEDSL · Lorain
- 2024 margin
- Lean R (+5.7) · D 46.7% · R 52.4%
- 2008→2024 swing
- -23.6pp toward R · 2008: 17.9pp · 2024: -5.7pp
- All cycles
- 2024: R+5.7 2020: R+2.5 2016: R+0.3 2012: D+14.4 2008: D+17.9
Not yet ingested
- Civics
- —
Market trends
- HPI YoY
- ▼ -72.36%
- Current HPI
- 208.1653
- Rent YoY
- —
- Metro
- —
- State GDP YoY
- ▲ 1.98%
- F500 in state
- 48
Industry mix (Fortune 500 HQ in OH)
| Industry | F500 HQs | Revenue |
|---|---|---|
| Insurance | 3 | $145B |
|
||
| Industrial Machinery | 3 | $49B |
|
||
| Financial Services | 3 | $24B |
|
||
| Consumer Goods | 2 | $93B |
|
||
| Aerospace / Defense | 2 | $47B |
|
||
| Utilities | 2 | $33B |
|
||
Price history
+303.5% since first listed4 events — show timeline
- 2026-04-09 Pending — MLSNOW
- 2025-11-13 Price Changed $115,000 MLSNOW
- 2025-09-08 Listed $140,000 MLSNOW
- 1986-10-31 Sold (Public Records) $28,500 Public Records
Property tax history
+2.3%/yrLatest (2025): $2,514 · -4.1% YoY. Source: county tax records.
Cash-flow waterfall
monthlySold comps — $/sqft
last 12 mo · ≤1 miLoading sold comps…