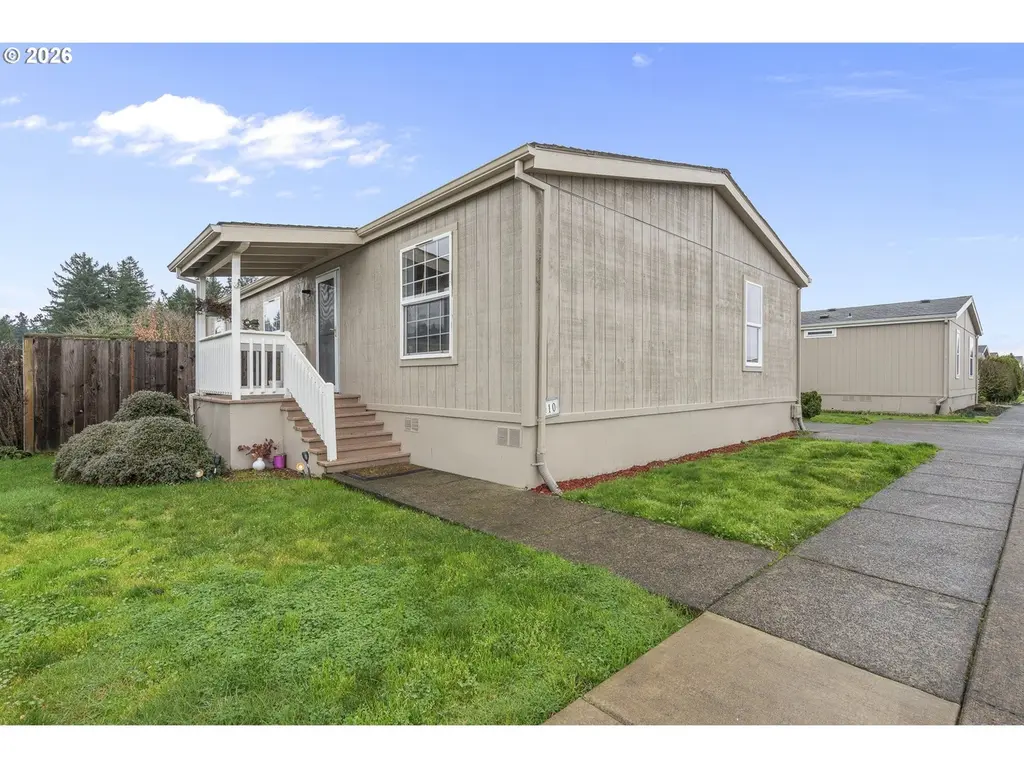
1000 S Mckern Ct #10 · Newberg, OR
Flood risk No data
- FEMA flood zone
- —
- Chance of flooding over 30 yrs
- —
- Est. flood insurance / yr
- —
Fire risk No data
- Est. fire insurance / yr
- —
Heat risk 4/10 · Minor
- Hot days now (above threshold)
- 7 days/yr
- Hot days in 30 yrs
- 15 days/yr
Wind risk No data
- Chance of severe wind over 30 yrs
- —
Air-quality risk 9/10 · Severe
- Unhealthy air days now
- 11 days/yr
- Unhealthy air days in 30 yrs
- 12 days/yr
Risk factors via First Street. Map © Google.
Why this score? — see what drove the B grade
The composite is a weighted blend of 9 inputs, each scored 0–100. Each bar is that input's sub-score; the figure is the points it added to the 100-point composite (weight × sub-score).
- Cash flow +30.0/30.0
- 1% rule +10.0/10.0
- DSCR +10.0/10.0
- ARV discount +8.0/15.0
- Livability +3.8/5.0
- Schools +3.4/10.0
- Rent growth +2.6/5.0
- Condition / age +2.5/5.0
- Appreciation +0.0/10.0
$115,000
🖨 Deal sheet 📄 Offer letter ✓ Due diligence
Listing remarks MLS
Opportunity awaits! 3 bedroom home in the desirable Springbrook Estates neighborhood with a fully fenced yard and covered parking. Enjoy cooking in your spacious kitchen that features solid surface counter tops. Don't miss your chance at home ownership for an affordable price.
Key facts
- Siding updated
- Roof updated
- Fully fenced yard
Tags
Neighborhood map
What this means for you Summary
Snapshot
- This is a 3-bed/2.5-bath manufactured listed at $115k.
Deal economics
- At list price, monthly cash flow is $931 ($11k/yr) — positive.
- The deal already cash-flows at list — no discount required.
- Meets the 1% rule at list price ($2k rent vs $115k).
- Recommended offer: $101k (12.0% below list) — sets the bar for market timing.
- Cap rate 16.0% vs local median 2.4% in Newberg — top-decile yield for the area; either an underpriced asset or a hidden risk that comps aren't pricing in. Stress-test before assuming the spread holds.
Location & tenants
- Location reads 76/100 on livability (#77 in OR, #3,395 nationally) — a middle-class / working-renter tenant base. Strengths: amenities A+, employment A+, housing A+; Watch: cost of living D, commute F.
- Newberg SD 29J (town): math 30% / reading 45% proficiency, ranked #17 of 58 in OR (top 29%) — families likely to look elsewhere, expect single-tenant / working-renter base with shorter leases.
- Market conditions: Rents flat; 230 active listings in the ZIP; 22 comparable units currently listed for rent nearby; rentals at typical pace (median 16d on market — plan ~3-4 weeks tenant-placement turnaround); solid renter incomes; 282 units permitted in Yamhill County in 2024 (0 in 5+ unit buildings).
Forward outlook
- Local home prices are declining (-3.0%/yr); year-one equity from $795 of loan paydown is wiped out by about $3k of value loss. Plan a longer hold.
- Yamhill County population projected at +8% by 2050 — modest demand growth; plan on rents tracking national, not racing it.
- At projected returns (-3.0% appreciation + 0.6% rent growth), your $32k cash investment doubles in ~4 years — after that, you're playing with house money.
Negotiation context
- It's been on market 159 days — a 12% lower offer ($101k) is reasonable based on typical stale-listing flexibility.
- 5 sale attempts since 4y ago; this cycle's ask is 5% above the opening price — seller raised mid-cycle; expect resistance to lowballs.
Questions for the listing agent
- It's been on market 159 days. Have you received any prior offers? Is the seller open to a 12% concession, seller financing, or rate buy-down credit?
- Why hasn't it sold? Are there any deal-killer items the seller is aware of (foundation, flood, title, zoning, code violations)?
- Is there a deadline driving the sale (1031 exchange, divorce, estate, relocation)? That informs how much negotiation room exists.
- Schools are B-rated — typically a magnet for longer-tenancy family renters. What's the average tenant stay here, and is there a school-zone premium baked into asking?
- What's the average days-on-market for RENTAL listings here right now (not sales)? A rising rental-DOM trend means longer vacancies and softer asking-rent achievability than the comps imply.
- What's the recent tenant-quality profile in this submarket — average credit score on applications, eviction rate, late-payment / NSF rate, and stable-employment percentage? A property-management company in the area should have these aggregated.
- How much new for-sale + rental construction is in the pipeline within 1–3 miles? Heavy new supply typically softens prices + rents 12–24 months out; constrained supply supports both.
Investment metrics
- 1% rule
- 1.82% ✓
- Cap rate
- 16.01%
- Cash-on-cash
- 34.71%
- DSCR
- 2.54
- GRM
- 4.6
CMA / ARV
- ARV (median comp)
- $116,217
- List price
- $115,000
- Delta
- -1.05%
- Verdict
- FAIR
- Comps
- 20 within 1.0 mi
Show comp detail 12 sales within ~0.75 mi
| Address | Dist | Beds/Ba | Sqft | Sold | Price | $/sf | Match |
|---|---|---|---|---|---|---|---|
| 1000 S Mckern Ct #10 | 0.00mi | 3/2.0 | 1,296 (0%) | 0mo | $115,000 | $89 | 98 |
| 1000 S Mckern Ct #45 | 0.00mi | 3/2.0 | 1,404 (+8%) | 6mo | $121,000 | $86 | 79 |
| 2902 E 2nd St #67 | 0.34mi | 3/2.0 | 1,344 (+4%) | 4mo | $85,000 | $63 | 72 |
| 1000 S Mckern Ct #58 | 0.00mi | 3/2.0 | 1,456 (+12%) | 9mo | $139,990 | $96 | 70 |
| 2901 E 2nd St #117 | 0.34mi | 3/2.0 | 1,400 (+8%) | 4mo | $123,000 | $88 | 65 |
| 2902 E 2nd St #110 | 0.34mi | 3/2.0 | 1,404 (+8%) | 4mo | $85,000 | $61 | 65 |
| 2901 E 2nd St #60 | 0.34mi | 3/2.0 | 1,152 (-11%) | 4mo | $95,000 | $82 | 60 |
| 2901 E 2nd St #109 | 0.34mi | 2/2.0 (-1) | 1,440 (+11%) | 1mo | $87,800 | $61 | 58 |
| 2902 E 2nd St #98 | 0.42mi | 3/3.0 | 1,440 (+11%) | 3mo | $119,000 | $83 | 58 |
| 2902 E 2nd St #95 | 0.39mi | 2/2.0 (-1) | 1,200 (-7%) | 8mo | $172,000 | $143 | 56 |
| 2901 E 2nd St #77 | 0.34mi | 2/2.0 (-1) | 1,440 (+11%) | 7mo | $95,000 | $66 | 53 |
| 2901 E 2nd St #47 | 0.34mi | 2/2.0 (-1) | 1,152 (-11%) | 9mo | $119,900 | $104 | 51 |
Match score weights: distance 35% · size 25% · config 20% · recency 20%. Top-matched comps best support the ARV.
Projected returns pro-forma
-3.0% appreciation · 0.55% rent growth · sell at horizon
- IRR
- 27.5%
- Equity multiple
- 2.11×
- Total profit
- $35,645
- Equity at exit
- $17,147
- IRR
- 33.6%
- Equity multiple
- 3.72×
- Total profit
- $87,718
- Equity at exit
- $9,943
Cash invested: $32,200 (down + closing). Projections, not guarantees.
Landlord ↔ Tenant lean methodology
- Overall (STATE)
- 28 Tenant-Leaning
- State Oregon
- 28 Tenant-Leaning · D+6
- County
- — inherits STATE
- City
- — inherits STATE
ZIP-level market 97132
- Rents YoY
- 0.6%
- Active inventory
- 230
- Price-to-rent
- 4.6×
Monthly cashflow live
- Estimated rent
- $2,091 high interval (Pro) →
- Mortgage (P&I)
- −$603
- Tax from tax record
- −$69 /mo · $830/yr
- Insurance
- −$48
- HOA
- −$0
- Vacancy / Maint / Mgmt
- −$439
- Net cashflow
- $931
Break-even live
UW: 25.0% down · 7.5% · 30yr · 1.5% tax · 5.0% vac · 8.0% maint · 8.0% mgmt
Financing live
Cash to close
- Down payment
- $28,750
- Closing costs
- $3,450
- Reserves months
- —
- Total cash needed
- —
Loan-product check · same deal, 3 products live
Conventional
25% down · 7.5% · 30yr
- Down + closing
- —
- Monthly P&I
- —
- Monthly cashflow
- —
- DSCR
- —
- Eligible?
- —
Personal DTI + credit; lowest rate.
DSCR
20% down · 8.5% · 30yr
- Down + closing
- —
- Monthly P&I
- —
- Monthly cashflow
- —
- DSCR
- —
- Eligible?
- —
No personal income docs; deal must DSCR.
Hard money
10% down · 12.0% · 12mo
- Down + closing
- —
- Monthly P&I
- —
- Monthly cashflow
- —
- DSCR
- —
- Eligible?
- —
Short-term bridge; refi at stabilization.
Rent comps 22 comps
| Address | Beds | Baths | Sqft | Rent | $/sqft | DOM | Units | Dist |
|---|---|---|---|---|---|---|---|---|
| 506 S Corinne Dr Newberg, OR | 3.0 | 2.5 | 1390 | $2,350 | $1.69 | 17d | 1 | 0.58mi |
| 2501 E 2nd St #12 Newberg, OR | 2.0 | 2.0 | 910 | $1,500 | $1.65 | 23d | 1 | 0.63mi |
| 480 S Lair Ln Newberg, OR | 3.0 | 2.5 | 1345 | $2,395 | $1.78 | 2d | 1 | 0.66mi |
| 2203 E Sam Parrett Dr Newberg, OR | 3.0 | 2.5 | 1386 | $2,399 | $1.73 | 23d | 1 | 0.68mi |
| 401 S Everest St Newberg, OR | 2.0 | 1.0 | 950 | $1,625 | $1.71 | 1d | 1 | 0.84mi |
| 1536 E 3rd St Unit 20 Newberg, OR | 3.0 | 1.0 | 1000 | $1,725 | $1.73 | 43d | 1 | 0.90mi |
| 601 Wynooski St Unit 201 Newberg, OR | 2.0 | 2.0 | 1122 | $1,850 | $1.65 | 43d | 1 | 0.91mi |
| 601 Wynooski St Unit 100 Newberg, OR | 2.0 | 2.0 | 1064 | $1,745 | $1.64 | 14d | 1 | 0.92mi |
| 611 Sitka Ave Unit 03 Newberg, OR | 2.0 | 1.5 | 900 | $1,550 | $1.72 | 43d | 1 | 1.04mi |
| 2400 E Haworth Ave Newberg, OR | 1.0–3.0 | 1.0–1.5 | 1025 | $1,850 | $1.80 | 1d | 2 | 1.11mi |
| 1009 N Hulet Ave Newberg, OR | 3.0 | 2.0 | 1412 | $2,250 | $1.59 | 7d | 1 | 1.16mi |
| 1109 S River St Newberg, OR | 2.0 | 2.0 | 969 | $1,812 | $1.87 | 1d | 3 | 1.18mi |
| 1401 N Springbrook Rd Newberg, OR | 2.0 | 1.0 | 960 | $1,550 | $1.61 | 16d | 4 | 1.23mi |
| 1401 N Springbrook Rd Apt 128 Newberg, OR | 2.0 | 1.0 | 960 | $1,500 | $1.56 | 1d | 1 | 1.23mi |
| 2507 Hawthorne Dr Newberg, OR | 2.0 | 1.0 | 950 | $1,700 | $1.79 | 1d | 1 | 1.25mi |
| 1401 N Springbrook Rd Unit 220 Newberg, OR | 2.0 | 1.0 | 960 | $1,600 | $1.67 | 23d | 1 | 1.25mi |
| 905 S College St Unit B Newberg, OR | 3.0 | 1.5 | 1248 | $1,995 | $1.60 | 23d | 1 | 1.32mi |
| 606 E Ninth St Apt 34 Newberg, OR | 2.0 | 1.0 | 920 | $1,550 | $1.68 | 4d | 1 | 1.34mi |
| 606 E 9th St Newberg, OR | 2.0 | 1.0–1.5 | 920 | $1,550 | $1.68 | 20d | 2 | 1.34mi |
| 4001 E Jory St Newberg, OR | 1.0–3.0 | 1.0–2.0 | 941 | $2,440 | $2.59 | 1d | 1 | 1.35mi |
| 4460 E Jory St Unit 114 Newberg, OR | 2.0 | 2.0 | 909 | $1,899 | $2.09 | 10d | 1 | 1.45mi |
| 1909 N Springbrook Rd Newberg, OR | 3.0 | 2.0 | 1687 | $2,550 | $1.51 | 23d | 1 | 1.47mi |
Listing history 12 events
-
2026-05-12status Pending 277-char remark
Show marketing remark (277 chars)
Opportunity awaits! 3 bedroom home in the desirable Springbrook Estates neighborhood with a fully fenced yard and covered parking. Enjoy cooking in your spacious kitchen that features solid surface counter tops. Don't miss your chance at home ownership for an affordable price.
-
2026-04-10status Active 277-char remark
Show marketing remark (277 chars)
Opportunity awaits! 3 bedroom home in the desirable Springbrook Estates neighborhood with a fully fenced yard and covered parking. Enjoy cooking in your spacious kitchen that features solid surface counter tops. Don't miss your chance at home ownership for an affordable price.
-
2026-03-29status Pending 277-char remark
Show marketing remark (277 chars)
Opportunity awaits! 3 bedroom home in the desirable Springbrook Estates neighborhood with a fully fenced yard and covered parking. Enjoy cooking in your spacious kitchen that features solid surface counter tops. Don't miss your chance at home ownership for an affordable price.
-
2026-03-05price $115,000 277-char remark
Show marketing remark (277 chars)
Opportunity awaits! 3 bedroom home in the desirable Springbrook Estates neighborhood with a fully fenced yard and covered parking. Enjoy cooking in your spacious kitchen that features solid surface counter tops. Don't miss your chance at home ownership for an affordable price.
-
2026-01-09price $125,000 277-char remark
Show marketing remark (277 chars)
Opportunity awaits! 3 bedroom home in the desirable Springbrook Estates neighborhood with a fully fenced yard and covered parking. Enjoy cooking in your spacious kitchen that features solid surface counter tops. Don't miss your chance at home ownership for an affordable price.
-
2026-01-09status Active 277-char remark
Show marketing remark (277 chars)
Opportunity awaits! 3 bedroom home in the desirable Springbrook Estates neighborhood with a fully fenced yard and covered parking. Enjoy cooking in your spacious kitchen that features solid surface counter tops. Don't miss your chance at home ownership for an affordable price.
-
2025-09-26$110,000 Active 277-char remark
Show marketing remark (277 chars)
Opportunity awaits! 3 bedroom home in the desirable Springbrook Estates neighborhood with a fully fenced yard and covered parking. Enjoy cooking in your spacious kitchen that features solid surface counter tops. Don't miss your chance at home ownership for an affordable price.
-
2022-11-19historical
-
2022-11-02status Active
-
2022-10-25historical Active under Contract
-
2022-10-11price $144,900
-
2022-08-12$149,900 Active
ⓘ Source: listings_history table (triggers on properties + properties_extension) + one-shot
backfill from property_details.listing_events for pre-trigger history.
Tax reassessment forecast OR · Resets to sale price
- Current annual tax
- $830 · $69/mo
- Projected year-2 tax
- $1,116 · $93/mo
- Expected delta
- +$286/yr (+$24/mo · 34.4%)
ⓘ Screening estimate from a state-policy table — verify with the county assessor before closing.
Climate risk First Street
- Heat 4/10 Moderate
- Air quality 9/10 Extreme 11 unhealthy d/yr today · 12 by 30 yrs out
Nearby sold comps map
Loading sold comps map…
Walkable amenities ~0.75 mi
Loading nearby amenities…
Taxation est. · year 1
- Rental income
- $25,088
- − Mortgage interest
- −$6,442
- − Property taxes
- −$830
- − Insurance
- −$575
- − Repairs & maintenance
- −$2,007
- − Management
- −$2,007
- − Depreciation
- −$3,345
- Taxable income
- $9,882
- Est. tax owed @ 24.0%
- −$2,372
- After-tax cash flow
- $8,806/yr
For passive investors: Depreciation is non-cash, so a rental often shows a tax loss while cash-flowing — sheltering income. Rental losses are passive: they offset passive income freely, and up to $25,000/yr can offset ordinary (W-2) income if you actively participate and your MAGI is under $100k (phasing out to $0 by $150k); unused losses carry forward. On sale, claimed depreciation is recaptured at up to 25%, and gains may owe capital-gains tax (a 1031 exchange can defer both). Figures are a year-1 estimate at your 24.0% rate — not tax advice; consult a CPA.
Schools (NCES district)
- District
- Newberg SD 29J
- NCES district ID
- 4108720
- Math proficiency
- 30% ▼ -13.00%
- Reading proficiency
- 45% ▼ -12.00%
- Median HH income
- $62,898
- Composite
- 33.6/100
- National rank
- #5414
- State rank
- #17 of 58 in OR
Livability — Newberg
- Score
- 76/100
- State rank
- #77
- US rank
- #3395
Category grades
Schools grade is shown separately in the Schools card above.
Census & demographics
- Census place
- Newberg, OR
- County
- Yamhill County · 71,150 people
- City population
- 32,486
- Metro
- Portland-Vancouver-Hillsboro, OR-WA
- Population (ZIP)
- 32,486
- Household income
- $96,493
- Rent vs Own
- Severe rent burden
- 1311.0
Population outlook (Yamhill County) Hauer SSP2
- Today (2025)
- 109,295 people
- By 2030
- 112,060 · +2.5%
- By 2040
- 115,975 · +6.1%
- By 2050
- 118,155 · +8.1%
- By 2075
- 120,968 · +10.7%
- By 2100
- 116,163 · +6.3%
Race, ethnicity, and origin ACS 2023
- Neighborhood character
- Predominantly White (76%)
- Race & ethnicity
- White 76% Hispanic / Latino 14% Two or more races 12% Asian 3%
- Hispanic origin (detail)
- Mexican 11%
- Common ancestry
- Italian 5% Portuguese 3% Slovak 3%
- Foreign-born
- 7% · Canada, China
- Languages at home
- 89% English-only · Spanish 8% Other Indo-European 1% Other Asian/Pacific 1%
Political lean MEDSL · Yamhill
- 2024 margin
- Lean R (+6.1) · D 45.3% · R 51.4% · Other 3.3%
- 2008→2024 swing
- -4.8pp toward R · 2008: -1.4pp · 2024: -6.1pp
- All cycles
- 2024: R+6.1 2020: R+4.0 2016: R+8.8 2012: R+6.7 2008: R+1.4
Not yet ingested
- Civics
- —
Market trends
- HPI YoY
- ▼ -265.11%
- Current HPI
- 320.8972
- Rent YoY
- ▲ 0.55%
- Metro
- Portland-Vancouver-Hillsboro, OR-WA
- State GDP YoY
- ▲ 2.05%
- F500 in state
- 2
Industry mix (Fortune 500 HQ in OR)
| Industry | F500 HQs | Revenue |
|---|---|---|
| Consumer Goods | 1 | $51B |
|
||
Price history
-23.3% since first listed12 events — show timeline
- 2026-05-12 Pending — RMLS
- 2026-04-10 Relisted — RMLS
- 2026-03-29 Pending — RMLS
- 2026-03-05 Price Changed $115,000 RMLS
- 2026-01-09 Price Changed $125,000 RMLS
- 2026-01-09 Relisted — RMLS
- 2025-09-26 Listed $110,000 RMLS
- 2022-11-19 Listing Removed — WVMLS
- 2022-11-02 Relisted — WVMLS
- 2022-10-25 Contingent — WVMLS
- 2022-10-11 Price Changed $144,900 WVMLS
- 2022-08-12 Listed $149,900 WVMLS
Property tax history
+1.3%/yrLatest (2025): $830 · +4.0% YoY. Source: county tax records.
Cash-flow waterfall
monthlySold comps — $/sqft
last 12 mo · ≤1 miLoading sold comps…