 🏗️ New Construction
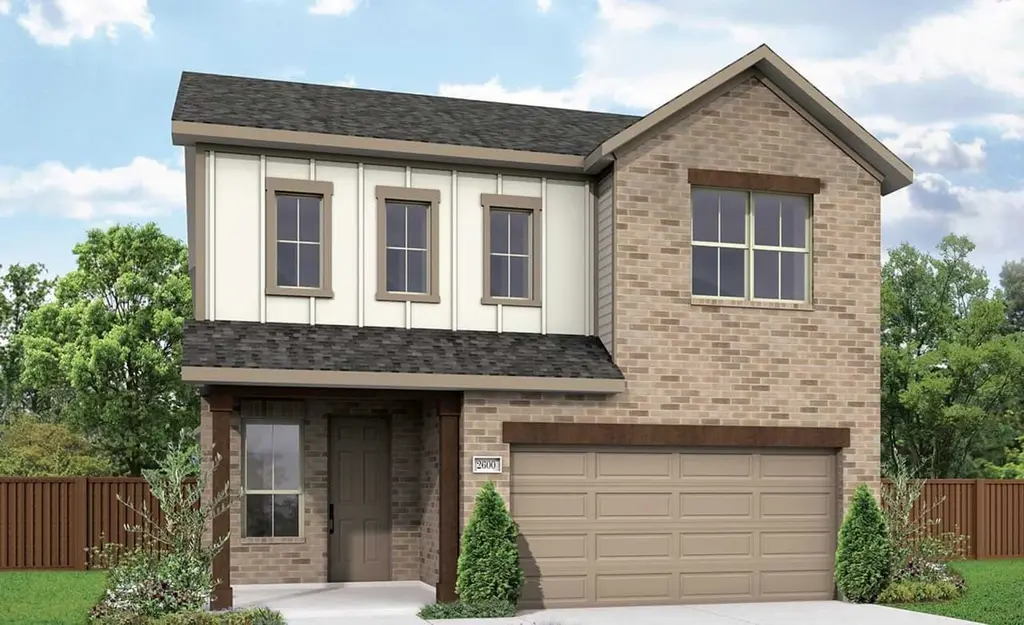
40722 Mostyn Lake Dr · Magnolia, TX
Flood risk No data
- FEMA flood zone
- —
- Chance of flooding over 30 yrs
- —
- Est. flood insurance / yr
- —
Fire risk No data
- Est. fire insurance / yr
- —
Heat risk No data
- Hot days now (above threshold)
- —
- Hot days in 30 yrs
- —
Wind risk No data
- Chance of severe wind over 30 yrs
- —
Air-quality risk No data
- Unhealthy air days now
- —
- Unhealthy air days in 30 yrs
- —
Risk factors via First Street. Map © Google.
Why this score? — see what drove the D grade
The composite is a weighted blend of 9 inputs, each scored 0–100. Each bar is that input's sub-score; the figure is the points it added to the 100-point composite (weight × sub-score).
- Appreciation +10.0/10.0
- ARV discount +7.5/15.0
- Cash flow +6.8/30.0
- Condition / age +4.0/5.0
- Schools +3.9/10.0
- Livability +3.7/5.0
- Rent growth +2.6/5.0
- 1% rule +2.1/10.0
- DSCR +1.1/10.0
$314,990
🖨 Deal sheet (PDF) 📄 Offer letter ✓ Due diligence
Listing remarks
Enjoy relaxed living at Mostyn Springs, a charming community in the peaceful countryside of Magnolia, TX, with convenient access to top-rated schools, shopping, and dining. Step into the stunning Benchmark plan, featuring an open-concept layout where the kitchen flows seamlessly into the dining area and family room, perfect for everyday living and entertaining. The kitchen includes stainless steel appliances, 42" custom cabinets & omega stone countertops, while vinyl plank flooring in the main areas and tile in the wet spaces add durability. The primary suite offers a spacious shower, dual sinks, and an oversized closet with a convenient door to the utility room. Upstairs, the ga
Key facts
- Custom cabinets
- Vinyl plank flooring
- Open-concept layout
Tags
Property features AI
Finance
- HOA & community: Association managed by Lead Association Management; Annual association fee of $800
Exterior
- Parking: Attached 2-car garage
- Utilities: Public water; Public sewer
- Home design: Residential property; New construction (under construction); Faces south
- Construction: Built in 2026; Brick, cement siding, and wood siding exterior; Composition roof; Slab foundation
- Exterior features: Deck; Patio; Fenced backyard; Subdivision lot
Interior
- Kitchen: Dishwasher; Disposal; Gas oven; Gas range; Microwave; Kitchen island; Walk-in pantry
- Bedrooms: Primary bedroom on the first floor (16x14); Three additional bedrooms on the second floor (12x10, 12x10, 11x10); Total of 4 bedrooms plus additional rooms
- Flooring: Carpet; Plank flooring; Tile; Vinyl
- Bathrooms: 3 full bathrooms; 1 half bathroom
- Heating & cooling: Central heating (gas); Central air conditioning (electric)
- Interior features: Double vanity; Kitchen island; Kitchen/family room combo; Primary bedroom with private bath; Solid surface counters; Tub with shower; Walk-in pantry; Kitchen/dining combo; Living/dining room combo; Programmable thermostat; Insulated doors
- Laundry & utility: Washer hookup; Electric dryer hookup
Neighborhood map
What this means for you Summary
Snapshot
- This is a 4-bed/3.5-bath single-family listed at $315k. Condition is rated good.
Deal economics
- At list price, monthly cash flow is $-503 ($-6k/yr) — negative.
- To cash-flow at today's rent, offer at most $254k (19.5% below list).
- To meet the 1% rule (rent ≥ 1% of price), the offer needs to be $230k (26.9% below list).
- Recommended offer: $230k (26.9% below list) — sets the bar for 1% rule.
- Cap rate 4.4% vs local median 3.4% in Magnolia — meaningfully above typical; check what's discounted (condition, days-on-market, listing class) to confirm the premium yield is real.
Location & tenants
- Location reads 73/100 on livability (#222 in TX) — a middle-class / working-renter tenant base. Strengths: crime A+, cost of living A+, housing A+; Watch: amenities F, commute F.
- Magnolia ISD (rural): math 42% / reading 45% proficiency, ranked #247 of 826 in TX (top 30%) — families likely to look elsewhere, expect single-tenant / working-renter base with shorter leases.
- Zoned schools: Magnolia Parkway El (math 38% / reading 46%, grade F, #1,335 of 4,322 statewide, top 33%, 776 students, 45% FRL); Bear Branch J H (math 44% / reading 46%, grade D, #479 of 1,662 statewide, top 29%, 1,076 students, 37% FRL); Magnolia H S (math 47% / reading 62%, grade C-, #379 of 1,632 statewide, top 26%, 2,248 students, 31% FRL) — zoned schools at 37% FRL track the district average.
- Market conditions: Rents flat; 1622 active listings in the ZIP; high-income renter base; 13,259 units permitted in Montgomery County in 2024 (1,402 in 5+ unit buildings).
Forward outlook
- In year one you build about $35k of equity ($2k loan paydown + $33k appreciation (10.0% local appreciation)).
- Montgomery County population projected at +65% by 2050 — long-run rental-demand tailwind backs the buy-and-hold thesis.
- By year 2, paydown + projected appreciation supports a ~$56k cash-out refi (75% LTV) — recoverable capital for the next deal without selling this one.
Negotiation context
- It's been on market 26 days — a 2% lower offer ($310k) is reasonable based on typical stale-listing flexibility.
Questions for the listing agent
- What do current leases actually rent for vs. the listed asking? Can we see a recent rent roll and the last 12 months of T-12 income?
- What does the HOA fee cover, when was the last increase, and are there any pending special assessments or reserve-fund shortfalls?
- Is there a deadline driving the sale (1031 exchange, divorce, estate, relocation)? That informs how much negotiation room exists.
- Schools are D-rated, which usually means shorter tenancies and higher turnover. Who's the typical renter profile here, and what's been the actual vacancy rate?
- The area grade is low — what's the realistic commute time and amenity access for the typical tenant pool here? Any planned neighborhood developments (good or bad) we should know about?
- What's the average days-on-market for RENTAL listings here right now (not sales)? A rising rental-DOM trend means longer vacancies and softer asking-rent achievability than the comps imply.
- What's the recent tenant-quality profile in this submarket — average credit score on applications, eviction rate, late-payment / NSF rate, and stable-employment percentage? A property-management company in the area should have these aggregated.
- How much new for-sale + rental construction is in the pipeline within 1–3 miles? Heavy new supply typically softens prices + rents 12–24 months out; constrained supply supports both.
Investment metrics
- 1% rule
- 0.71% ✗
- Cap rate
- 4.44%
- Cash-on-cash
- -6.60%
- DSCR
- 0.71
- GRM
- 11.8
CMA / ARV
- ARV (on-the-fly)
- $326,337
- Comps found
- 12
Show comp detail 12 sales within ~0.75 mi
| Address | Dist | Beds/Ba | Sqft | Sold | Price | $/sf | Match |
|---|---|---|---|---|---|---|---|
| 40748 Mostyn Lake Dr | 0.05mi | 4/3.5 | 2,689 (-0%) | 1mo | $319,990 | $119 | 96 |
| 40704 Mostyn Lake Dr | 0.04mi | 4/3.5 | 2,663 (-1%) | 6mo | $318,990 | $120 | 91 |
| 13074 Sarah Springs Way | 0.10mi | 4/3.5 | 2,695 (-0%) | 6mo | $319,990 | $119 | 90 |
| 40712 Pessi Rd | 0.24mi | 4/3.5 | 2,689 (-0%) | 7mo | $312,990 | $116 | 82 |
| 40732 Pessi Rd | 0.22mi | 4/3.5 | 2,689 (-0%) | 11mo | $317,990 | $118 | 80 |
| 12747 Dina Springs Ln | 0.25mi | 5/3.0 (+1) | 2,760 (+2%) | 4mo | $332,990 | $121 | 74 |
| 40533 Mostyn Lake Dr | 0.38mi | 4/2.5 | 2,608 (-3%) | 10mo | $315,000 | $121 | 64 |
| 40792 Mostyn Lake Dr | 0.14mi | 4/2.5 | 2,377 (-12%) | 9mo | $329,990 | $139 | 62 |
| 40588 Mostyn Lake Dr | 0.26mi | 4/2.5 | 2,370 (-12%) | 2mo | $328,990 | $139 | 61 |
| 40569 Mostyn Lake Dr | 0.29mi | 5/3.0 (+1) | 2,897 (+7%) | 10mo | $379,000 | $131 | 59 |
| 12413 S Hill Ct | 0.66mi | 5/3.0 (+1) | 2,860 (+6%) | 4mo | $339,000 | $119 | 49 |
| 40931 Westley Ln | 0.59mi | 4/3.5 | 3,053 (+13%) | 3mo | $724,900 | $237 | 48 |
Match score weights: distance 35% · size 25% · config 20% · recency 20%. Top-matched comps best support the ARV.
Projected returns pro-forma
10.0% appreciation · 0.32% rent growth · sell at horizon
- IRR
- 18.9%
- Equity multiple
- 2.53×
- Total profit
- $139,749
- Equity at exit
- $293,990
- IRR
- 17.0%
- Equity multiple
- 5.66×
- Total profit
- $425,882
- Equity at exit
- $634,001
Cash invested: $91,374 (down + closing). Projections, not guarantees.
Landlord ↔ Tenant lean methodology
- Overall (STATE)
- 87 Strongly Landlord-Friendly
- State Texas
- 87 Strongly Landlord-Friendly · R+5
- County
- — inherits STATE
- City
- — inherits STATE
ZIP-level market 77354
- Home prices YoY
- 2.4%
- Rents YoY
- 0.3%
- Active inventory
- 1622
- Price-to-rent
- 11.4×
Monthly cashflow live
- Estimated rent
- $2,303 medium interval (Pro) →
- Mortgage (P&I)
- −$1,711
- Tax est. 1.5%
- −$408 /mo · $4,895/yr
- Insurance
- −$136
- HOA
- −$67
- Vacancy / Maint / Mgmt
- −$484
- Net cashflow
- $-503
Break-even live
Sensitivity live
| Price | -10% $-277 | -5% $-390 | +0% $-503 | +5% $-615 | +10% $-728 |
|---|---|---|---|---|---|
| Rent | -10% $-685 | -5% $-594 | +0% $-503 | +5% $-412 | +10% $-321 |
| Rate | -1.0pp $-338 | -0.5pp $-420 | base $-503 | +0.5pp $-587 | +1.0pp $-673 |
UW: 25.0% down · 7.5% · 30yr · 1.5% tax · 5.0% vac · 8.0% maint · 8.0% mgmt
Financing live
Cash to close
- Down payment
- $81,584
- Closing costs
- $9,790
- Reserves months
- —
- Total cash needed
- —
Loan-product check · same deal, 3 products live
Conventional
25% down · 7.5% · 30yr
- Down + closing
- —
- Monthly P&I
- —
- Monthly cashflow
- —
- DSCR
- —
- Eligible?
- —
Personal DTI + credit; lowest rate.
DSCR
20% down · 8.5% · 30yr
- Down + closing
- —
- Monthly P&I
- —
- Monthly cashflow
- —
- DSCR
- —
- Eligible?
- —
No personal income docs; deal must DSCR.
Hard money
10% down · 12.0% · 12mo
- Down + closing
- —
- Monthly P&I
- —
- Monthly cashflow
- —
- DSCR
- —
- Eligible?
- —
Short-term bridge; refi at stabilization.
HOA detail
- Monthly dues
- $67 · $804/yr
Listing history 16 events
-
2026-06-21days on market $314,990 Active 26 DOM
-
2026-06-18price $314,990 Active 23 DOM
-
2026-06-18days on market $324,990 Active 23 DOM
-
2026-06-17days on market $324,990 Active 22 DOM
-
2026-06-16days on market $324,990 Active 21 DOM
-
2026-06-15days on market $324,990 Active 20 DOM
-
2026-06-13days on market $324,990 Active 18 DOM
-
2026-06-09days on market $324,990 Active 14 DOM
-
2026-06-08days on market $324,990 Active 13 DOM
-
2026-06-07days on market $324,990 Active 12 DOM
-
2026-06-04days on market $324,990 Active 9 DOM
-
2026-06-03days on market $324,990 Active 8 DOM
-
2026-06-02days on market $324,990 Active 7 DOM
-
2026-06-01days on market $324,990 Active 6 DOM
-
2026-05-31days on market $324,990 Active 5 DOM
-
2026-05-26$324,990 Active
ⓘ Source: listings_history table (triggers on properties + properties_extension) + one-shot
backfill from property_details.listing_events for pre-trigger history.
Nearby sold comps map
Loading sold comps map…
Walkable amenities ~0.75 mi
Loading nearby amenities…
Taxation est. · year 1
- Rental income
- $27,641
- − Mortgage interest
- −$18,280
- − Property taxes
- −$4,895
- − Insurance
- −$1,632
- − Repairs & maintenance
- −$2,211
- − Management
- −$2,211
- − HOA
- −$804
- − Depreciation
- −$9,493
- Taxable loss
- −$11,886
- Est. tax savings @ 24.0%
- +$2,853
- After-tax cash flow
- $-3,178/yr
For passive investors: Depreciation is non-cash, so a rental often shows a tax loss while cash-flowing — sheltering income. Rental losses are passive: they offset passive income freely, and up to $25,000/yr can offset ordinary (W-2) income if you actively participate and your MAGI is under $100k (phasing out to $0 by $150k); unused losses carry forward. On sale, claimed depreciation is recaptured at up to 25%, and gains may owe capital-gains tax (a 1031 exchange can defer both). Figures are a year-1 estimate at your 24.0% rate — not tax advice; consult a CPA.
Condition & rehab AI · 14 photos
This home is in excellent condition with a modern kitchen and bathrooms, and a well-maintained exterior. It is move-in ready and would benefit from a fresh coat of paint on the exterior trim and a thorough gutter inspection.
Value-add opportunities
- Both Paint exterior trim — Enhances curb appeal and value
- Both Inspect and clean gutters — Prevents water damage and improves home's appearance
Renovation cost estimate screening
Value-add ROI direction
- Both Paint exterior trim — Enhances curb appeal and value ↑
- Both Inspect and clean gutters — Prevents water damage and improves home's appearance ↑
ⓘ Cost ranges are severity-bucket heuristics (US national rule-of-thumb). Get contractor quotes + a written scope before underwriting a rehab budget.
Schools (NCES district)
- District
- Magnolia ISD
- NCES district ID
- 4828740
- Math proficiency
- 42% ▼ -7.00%
- Reading proficiency
- 45% ▼ -4.00%
- Median HH income
- $71,692
- Composite
- 39.46/100
- National rank
- #3958
- State rank
- #247 of 826 in TX
Livability — Magnolia
- Score
- 73/100
- State rank
- #222
- US rank
- #5442
Category grades
Schools grade is shown separately in the Schools card above.
Census & demographics
- County
- Montgomery County · 663,713 people
- City population
- 106,505
- Metro
- Houston-The Woodlands-Sugar Land, TX
- Population (ZIP)
- 44,900
- Household income
- $112,504
- Rent vs Own
- Severe rent burden
- 586.0
Population outlook (Montgomery County) Hauer SSP2
- Today (2025)
- 713,896 people
- By 2030
- 805,263 · +12.8%
- By 2040
- 992,708 · +39.1%
- By 2050
- 1,179,590 · +65.2%
- By 2075
- 1,628,084 · +128.1%
- By 2100
- 1,937,880 · +171.5%
Race, ethnicity, and origin ACS 2023
- Neighborhood character
- Predominantly White (66%)
- Race & ethnicity
- White 66% Hispanic / Latino 25% Two or more races 18% Black 3% Asian 1%
- Hispanic origin (detail)
- Mexican 14% Puerto Rican 1%
- Common ancestry
- Lithuanian 4% Slovak 2% Italian 2%
- Foreign-born
- 11% · Canada, Vietnam
- Languages at home
- 83% English-only · Spanish 15% Other Indo-European 1% German/W. Germanic 1%
Political lean MEDSL · Montgomery
- 2024 margin
- Solid R (+45.5) · D 26.8% · R 72.3%
- 2008→2024 swing
- +7.2pp toward D · 2008: -52.7pp · 2024: -45.5pp
- All cycles
- 2024: R+45.5 2020: R+43.8 2016: R+51.4 2012: R+60.7 2008: R+52.7
Not yet ingested
- Civics
- —
Market trends
- HPI YoY
- ▲ 12.09%
- Current HPI
- 512.87
- Rent YoY
- ▲ 0.32%
- Metro
- Houston-The Woodlands-Sugar Land, TX
- State GDP YoY
- ▲ 3.95%
- F500 in state
- 110
Industry mix (Fortune 500 HQ in TX)
| Industry | F500 HQs | Revenue |
|---|---|---|
| Energy | 16 | $1,198B |
|
||
| Technology | 5 | $198B |
|
||
| Engineering / Construction | 4 | $72B |
|
||
| Energy Services | 3 | $60B |
|
||
| Utilities | 3 | $41B |
|
||
| Healthcare | 2 | $330B |
|
||
Price history
1 event — show timeline
- 2026-05-26 Listed $324,990 HARMLS
Cash-flow waterfall
monthlySold comps — $/sqft
last 12 mo · ≤1 miLoading sold comps…