1731 Gainesville St SE #201 · Washington, DC
Flood risk 1/10 · Minimal
- FEMA flood zone
- X (unshaded)
- Chance of flooding over 30 yrs
- 0.0%
- Est. flood insurance / yr
- $507 – $1,088
Fire risk 1/10 · Minimal
- Est. fire insurance / yr
- $631 – $1,173
Heat risk 7/10 · Major
- Hot days now (above 104°F)
- 7 days/yr
- Hot days in 30 yrs
- 14 days/yr
Wind risk 4/10 · Minor
- Chance of severe wind over 30 yrs
- 21.0%
Air-quality risk 4/10 · Minor
- Unhealthy air days now
- 4 days/yr
- Unhealthy air days in 30 yrs
- 5 days/yr
Risk factors via First Street. Map © Google.
Why this score? — see what drove the D grade
The composite is a weighted blend of 9 inputs, each scored 0–100. Each bar is that input's sub-score; the figure is the points it added to the 100-point composite (weight × sub-score).
- Cash flow +11.0/30.0
- ARV discount +7.5/15.0
- 1% rule +5.3/10.0
- Livability +3.7/5.0
- Schools +3.6/10.0
- Rent growth +3.5/5.0
- DSCR +3.2/10.0
- Condition / age +2.5/5.0
- Appreciation +0.0/10.0
$179,000
🖨 Deal sheet 📄 Offer letter ✓ Due diligence
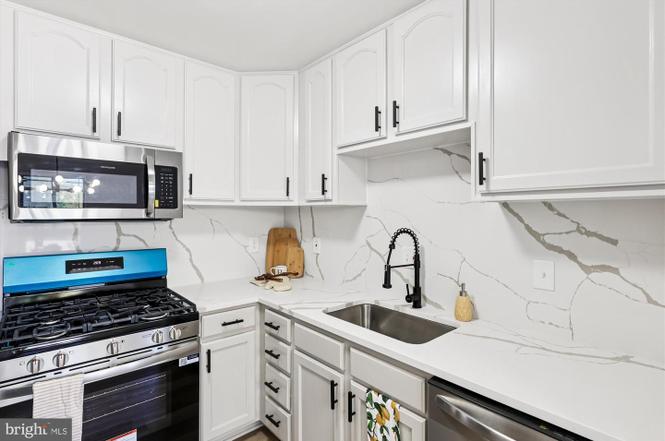
Listing remarks
Price Improvement! This home qualifies for a $10k grant and a $5k closing credit! Forget the stress of endless searching! This is the turnkey opportunity you've been waiting for. This inviting 2-bedroom, 1-bath unit at Hillwood Condominium has been completely refreshed, providing 785 square feet of open and modern living, just moments from everything DC has to offer. The entire space has been drenched in fresh paint, providing a bright canvas for the new LVP flooring that flows seamlessly through the main areas. The kitchen is the true centerpiece, featuring sleek quartz countertops, a matching quartz backsplash, and a complete suite of new stainless steel appliances. Both bedrooms offer co
Key facts
- Plush new carpeting
- Completely refreshed
- New lvp flooring
Tags
Property features AI
Finance
- Other: Property managed (property manager present)
- HOA & community: Monthly condo fee of $414 (professional off-site management); HOA fee includes water and sewer; Community center amenity
Exterior
- Parking: Assigned parking space in parking lot (Space #27)
- Utilities: Public water; No septic system (public sewer); Electric cooling fuel; Natural gas heating and hot water
- Home design: Condominium unit in a garden-style building (1–4 floors); Unit/flat; Entry on floor 2; Building name: RANDLE HEIGHTS; Six-unit building; Pets allowed with size/weight restrictions
- Construction: Brick construction; Year built/effective 2025; No basement
- Exterior features: No tidal water
Interior
- Kitchen: Dishwasher; Disposal; Microwave; Gas range / oven; Stove; Refrigerator
- Bedrooms: Two bedrooms on the main level
- Flooring: Carpet; Luxury vinyl plank
- Bathrooms: One full bathroom (main level)
- Heating & cooling: Central heating (natural gas); Central air conditioning (electric); Natural gas hot water
- Interior features: Open floor plan; Crown moldings; Combination dining and living area; Tub with shower; Upgraded countertops
- Laundry & utility: Stacked washer/dryer in unit; Washer/dryer hookup in unit
Neighborhood map
What this means for you Summary
Snapshot
- This is a 2-bed/1.0-bath condo listed at $179k.
Deal economics
- At list price, monthly cash flow is $-75 ($-904/yr) — negative.
- To cash-flow at today's rent, offer at most $166k (7.4% below list).
- Meets the 1% rule at list price ($2k rent vs $179k).
- Recommended offer: $158k (12.0% below list) — sets the bar for market timing.
- Cap rate 5.8% vs local median 2.5% in Washington — top-decile yield for the area; either an underpriced asset or a hidden risk that comps aren't pricing in. Stress-test before assuming the spread holds.
Location & tenants
- Location reads 73/100 on livability (#1 in DC) — a middle-class / working-renter tenant base. Strengths: amenities A+, commute A+, employment A+; Watch: crime F, cost of living F.
- District Of Columbia Public Schools (urban): math 33% / reading 40% proficiency, ranked #8 of 32 in DC (top 25%) — families likely to look elsewhere, expect single-tenant / working-renter base with shorter leases; 65% free/reduced lunch — lower-income household profile, screen leases tightly.
- Market conditions: Rents rising (+3.9%/yr); 296 active listings in the ZIP; 40 comparable units currently listed for rent nearby; rentals at typical pace (median 24d on market — plan ~3-4 weeks tenant-placement turnaround); 1,737 units permitted in District of Columbia in 2024 (1,506 in 5+ unit buildings).
- This rent runs 41% of the median local income ($54k/yr) — at the standard rent-burdened threshold; future hikes will face affordability resistance.
Forward outlook
- Local home prices are declining (-3.0%/yr); year-one equity from $1k of loan paydown is wiped out by about $5k of value loss. Plan a longer hold.
- District of Columbia County population projected at +50% by 2050 — long-run rental-demand tailwind backs the buy-and-hold thesis.
Negotiation context
- It's been on market 237 days — a 12% lower offer ($158k) is reasonable based on typical stale-listing flexibility.
Risks & watch-outs
- Watch-outs: HOA is 23% of rent.
- Climate carrying-cost: extreme-heat days projected 7→14/yr by 2055 (HVAC capex compounding) — expect insurance premiums to compound above CPI over the hold.
Questions for the listing agent
- What do current leases actually rent for vs. the listed asking? Can we see a recent rent roll and the last 12 months of T-12 income?
- It's been on market 237 days. Have you received any prior offers? Is the seller open to a 12% concession, seller financing, or rate buy-down credit?
- Built in 1965 — when were the roof, HVAC, electrical panel, plumbing, and water heater last replaced?
- What does the HOA fee cover, when was the last increase, and are there any pending special assessments or reserve-fund shortfalls?
- Any open or pending special assessments — roof, HVAC, plumbing, elevator, façade? What's the per-unit balance and payoff schedule, and is the seller paying it off at close or rolling it to the buyer?
- Why hasn't it sold? Are there any deal-killer items the seller is aware of (foundation, flood, title, zoning, code violations)?
- Is there a deadline driving the sale (1031 exchange, divorce, estate, relocation)? That informs how much negotiation room exists.
- Crime grade is F in this area — have there been break-ins, vandalism, or insurance claims at this property in the last 3 years? What carrier currently insures it and at what premium?
- The area grade is low — what's the realistic commute time and amenity access for the typical tenant pool here? Any planned neighborhood developments (good or bad) we should know about?
- What's the average days-on-market for RENTAL listings here right now (not sales)? A rising rental-DOM trend means longer vacancies and softer asking-rent achievability than the comps imply.
- What's the recent tenant-quality profile in this submarket — average credit score on applications, eviction rate, late-payment / NSF rate, and stable-employment percentage? A property-management company in the area should have these aggregated.
- How much new apartment / multifamily construction is in the pipeline within 1–3 miles? Heavy new supply (>2% of stock underway) typically softens rents 12–24 months out; light construction supports rent growth.
Investment metrics
- 1% rule
- 1.03% ✓
- Cap rate
- 5.79%
- Cash-on-cash
- -1.80%
- DSCR
- 0.92
- GRM
- 8.1
CMA / ARV
No comps found within radius.
Projected returns pro-forma
-3.0% appreciation · 3.86% rent growth · sell at horizon
- IRR
- -17.9%
- Equity multiple
- 0.36×
- Total profit
- $-31,992
- Equity at exit
- $26,689
- IRR
- -8.0%
- Equity multiple
- 0.47×
- Total profit
- $-26,491
- Equity at exit
- $15,477
Cash invested: $50,120 (down + closing). Projections, not guarantees.
Landlord ↔ Tenant lean methodology
- Overall (CITY)
- 0 Strongly Tenant-Friendly
- State District of Columbia
- 12 Strongly Tenant-Friendly · D+43
- County
- — inherits STATE
- City Washington
- 0 Strongly Tenant-Friendly · D+43
ZIP-level market 20020
- Rents YoY
- 3.9%
- Active inventory
- 296
- Price-to-rent
- 8.1×
Monthly cashflow live
- Estimated rent
- $1,840 high interval (Pro) →
- Mortgage (P&I)
- −$939
- Tax from tax record
- −$102 /mo · $1,218/yr
- Insurance
- −$75
- HOA
- −$414
- Vacancy / Maint / Mgmt
- −$386
- Net cashflow
- $-75
Break-even live
UW: 25.0% down · 7.5% · 30yr · 1.5% tax · 5.0% vac · 8.0% maint · 8.0% mgmt
Financing live
Cash to close
- Down payment
- $44,750
- Closing costs
- $5,370
- Reserves months
- —
- Total cash needed
- —
Loan-product check · same deal, 3 products live
Conventional
25% down · 7.5% · 30yr
- Down + closing
- —
- Monthly P&I
- —
- Monthly cashflow
- —
- DSCR
- —
- Eligible?
- —
Personal DTI + credit; lowest rate.
DSCR
20% down · 8.5% · 30yr
- Down + closing
- —
- Monthly P&I
- —
- Monthly cashflow
- —
- DSCR
- —
- Eligible?
- —
No personal income docs; deal must DSCR.
Hard money
10% down · 12.0% · 12mo
- Down + closing
- —
- Monthly P&I
- —
- Monthly cashflow
- —
- DSCR
- —
- Eligible?
- —
Short-term bridge; refi at stabilization.
Rent comps 40 comps
| Address | Beds | Baths | Sqft | Rent | $/sqft | DOM | Units | Dist |
|---|---|---|---|---|---|---|---|---|
| 1507 Erie St SE Washington, DC | 1.0 | 1.0 | 1000 | $2,800 | $2.80 | 24d | 1 | 0.35mi |
| 2341 Green St SE Washington, DC | 2.0 | 1.0 | 741 | $1,225 | $1.65 | 24d | 1 | 0.43mi |
| 2936 Knox Pl SE Washington, DC | 1.0 | 1.0 | 800 | $1,750 | $2.19 | 3d | 1 | 0.44mi |
| 2482 Alabama Ave SE Unit 302 Washington, DC | 1.0 | 1.0 | 725 | $1,350 | $1.86 | 24d | 1 | 0.47mi |
| 2472 Alabama Ave SE Unit B2 Washington, DC | 3.0 | 1.0 | 827 | $2,500 | $3.02 | 24d | 1 | 0.48mi |
| 2000 Ridgecrest Ct SE Washington, DC | 3.0 | 1.0 | 850 | $1,486 | $1.75 | 1d | 1 | 0.49mi |
| 2000 Ridgecrest Ct SE Washington, DC | 2.0–3.0 | 1.0 | 900 | $1,750 | $1.94 | 1d | 6 | 0.49mi |
| 2429 Alabama Ave SE Unit 204 Washington, DC | 3.0 | 1.0 | 635 | $2,850 | $4.49 | 22d | 1 | 0.50mi |
| 2495 Alabama Ave SE Unit 302 Washington, DC | 3.0 | 1.0 | 825 | $2,600 | $3.15 | 22d | 1 | 0.51mi |
| 1619 Butler St SE Unit 3 Washington, DC | 2.0 | 1.0 | 700 | $1,700 | $2.43 | 24d | 1 | 0.51mi |
| 2439 25th St SE Washington, DC | 1.0 | 1.0 | 679 | $1,293 | $1.90 | 16d | 1 | 0.53mi |
| 2816 Hartford St SE Washington, DC | 3.0 | 1.0 | 760 | $9,000 | $11.84 | 3d | 1 | 0.54mi |
| 2833 28th St SE Unit 4 Washington, DC | 3.0 | 1.0 | 820 | $2,200 | $2.68 | 24d | 1 | 0.57mi |
| 1717 Alabama Ave SE Washington, DC | 1.0–2.0 | 1.0 | 600 | $1,445 | $2.41 | 2d | 9 | 0.58mi |
| 2629 Douglass Rd SE Washington, DC | 2.0–3.0 | 1.0–1.5 | 888 | $1,450 | $1.63 | 1d | 13 | 0.58mi |
| 3275 15th Pl SE #101 Washington, DC | 3.0 | 1.0 | 984 | $2,250 | $2.29 | 24d | 1 | 0.60mi |
| 1425-1429 Cedar St SE Washington, DC | 1.0 | 1.0 | 644 | $1,419 | $2.20 | 2d | 5 | 0.60mi |
| 2805 28th St SE Unit 1 Washington, DC | 2.0 | 1.0 | 800 | $1,690 | $2.11 | 24d | 1 | 0.61mi |
| 2627 Jasper St SE Washington, DC | 1.0–2.0 | 1.0–1.5 | 838 | $1,729 | $2.06 | 24d | 1 | 0.61mi |
| 3281 15th Pl SE Washington, DC | 3.0 | 1.0 | 1012 | $1,750 | $1.73 | 7d | 1 | 0.61mi |
| 2838 Hartford St SE #304 Washington, DC | 2.0 | 1.0 | 775 | $1,500 | $1.94 | 2d | 1 | 0.63mi |
| 2838 Hartford St SE Washington, DC | 2.0 | 1.0 | 785 | $1,538 | $1.96 | 18d | 2 | 0.63mi |
| 1907 Good Hope Ct SE #7 Washington, DC | 1.0 | 1.0 | 578 | $1,500 | $2.60 | 24d | 1 | 0.64mi |
| 1907 Good Hope Ct SE #309 Washington, DC | 2.0 | 1.0 | 670 | $1,595 | $2.38 | 24d | 1 | 0.64mi |
| 1907 Marion Barry Ave SE Washington, DC | 2.0 | 1.0 | 900 | $1,495 | $1.66 | 24d | 1 | 0.64mi |
| 2841 Gainesville St SE #201 Washington, DC | 2.0 | 1.0 | 784 | $1,900 | $2.42 | 2d | 1 | 0.64mi |
| 2847 Gainesville St SE Unit 303 Washington, DC | 3.0 | 1.0 | 902 | $2,400 | $2.66 | 24d | 1 | 0.66mi |
| 2847 Gainesville St SE Unit B2 Washington, DC | 2.0 | 1.0 | 710 | $1,700 | $2.39 | 24d | 1 | 0.66mi |
| 2609 Douglass Rd SE #402 Washington, DC | 2.0 | 2.0 | 990 | $2,200 | $2.22 | 24d | 1 | 0.66mi |
| 3212 28th St SE Unit D Washington, DC | 3.0 | 1.0 | 790 | $2,100 | $2.66 | 24d | 1 | 0.68mi |
| 1953 19th Pl SE Apt 104 Washington, DC | 3.0 | 1.0 | 980 | $2,800 | $2.86 | 5d | 1 | 0.69mi |
| 1953 19th Pl SE Apt 301 Washington, DC | 3.0 | 1.0 | 980 | $5,301 | $5.41 | 24d | 1 | 0.69mi |
| 1720 Trenton Pl SE Washington, DC | 1.0–2.0 | 1.0 | 600 | $1,335 | $2.23 | 1d | 2 | 0.69mi |
| 3216 28th St SE #2 Washington, DC | 3.0 | 1.0 | 600 | $2,204 | $3.67 | 24d | 1 | 0.69mi |
| 2607 Naylor Rd SE Washington, DC | 1.0 | 1.0 | 665 | $1,275 | $1.92 | 7d | 4 | 0.69mi |
| 1526 V St SE Unit 2 Washington, DC | 2.0 | 1.0 | 800 | $1,700 | $2.12 | 24d | 1 | 0.70mi |
| 1847 Marion Barry Ave SE Washington, DC | 1.0–2.0 | 1.0 | 725 | $1,525 | $2.10 | 24d | 1 | 0.71mi |
| 2300 Good Hope Rd SE Washington, DC | 2.0 | 1.0–2.0 | 1020 | $1,913 | $1.88 | 24d | 6 | 0.71mi |
| 3009 30th St SE Washington, DC | 1.0 | 1.0 | 800 | $1,600 | $2.00 | 3d | 1 | 0.71mi |
| 2716 29th St SE Washington, DC | 2.0 | 1.0 | 850 | $2,000 | $2.35 | 24d | 1 | 0.72mi |
HOA detail condo
- Monthly dues
- $414 · $4,968/yr
- Assessments
- None detected in remarks — confirm with the listing agent.
Listing history 15 events
-
2026-06-18days on market $179,000 Active 237 DOM
-
2026-06-17days on market $179,000 Active 236 DOM
-
2026-06-16days on market $179,000 Active 235 DOM
-
2026-06-15days on market $179,000 Active 234 DOM
-
2026-06-13days on market $179,000 Active 232 DOM
-
2026-06-09days on market $179,000 Active 228 DOM
-
2026-06-08days on market $179,000 Active 227 DOM
-
2026-06-07days on market $179,000 Active 226 DOM
-
2026-06-04days on market $179,000 Active 223 DOM
-
2026-06-03days on market $179,000 Active 222 DOM
-
2026-06-02days on market $179,000 Active 221 DOM
-
2026-06-01days on market $179,000 Active 220 DOM
-
2026-05-31days on market $179,000 Active 219 DOM
-
2026-04-11price $179,000
-
2025-10-24$185,000 Active
ⓘ Source: listings_history table (triggers on properties + properties_extension) + one-shot
backfill from property_details.listing_events for pre-trigger history.
Tax reassessment forecast DC · Partial reset (capped growth)
- Current annual tax
- $1,218 · $102/mo
- Projected year-2 tax
- $1,218 · $102/mo
- Expected delta
- $0/yr ($0/mo · 0.0%)
ⓘ Screening estimate from a state-policy table — verify with the county assessor before closing.
Climate risk First Street
- Flood 1/10 Low FEMA zone X (unshaded) · 0% chance over 30 yrs
- Wildfire 1/10 Low
- Heat 7/10 Severe 7 d/yr ≥104°F today · 14 d/yr by 30 yrs out
- Wind 4/10 Moderate 21% chance of damaging wind over 30 yrs
- Air quality 4/10 Moderate 4 unhealthy d/yr today · 5 by 30 yrs out
Nearby sold comps map
Loading sold comps map…
Walkable amenities ~0.75 mi
Loading nearby amenities…
Taxation est. · year 1
- Rental income
- $22,078
- − Mortgage interest
- −$10,027
- − Property taxes
- −$1,218
- − Insurance
- −$895
- − Repairs & maintenance
- −$1,766
- − Management
- −$1,766
- − HOA
- −$4,968
- − Depreciation
- −$5,207
- Taxable loss
- −$3,770
- Est. tax savings @ 24.0%
- +$905
- After-tax cash flow
- $1/yr
For passive investors: Depreciation is non-cash, so a rental often shows a tax loss while cash-flowing — sheltering income. Rental losses are passive: they offset passive income freely, and up to $25,000/yr can offset ordinary (W-2) income if you actively participate and your MAGI is under $100k (phasing out to $0 by $150k); unused losses carry forward. On sale, claimed depreciation is recaptured at up to 25%, and gains may owe capital-gains tax (a 1031 exchange can defer both). Figures are a year-1 estimate at your 24.0% rate — not tax advice; consult a CPA.
Schools (NCES district)
- District
- District Of Columbia Public Schools
- NCES district ID
- 1100030
- Math proficiency
- 33% ▲ 3.00%
- Reading proficiency
- 40% ▲ 5.00%
- Median HH income
- $67,671
- Composite
- 35.84/100
- National rank
- #9606
- State rank
- #8 of 32 in DC
Livability — Washington
- Score
- 73/100
- State rank
- #1
- US rank
- #5327
Category grades
Schools grade is shown separately in the Schools card above.
Census & demographics
- Census place
- Washington, DC
- County
- District of Columbia · 671,873 people
- City population
- 671,873
- Metro
- Washington-Arlington-Alexandria, DC-VA-MD-WV
- Population (ZIP)
- 53,005
- Household income
- $54,032
- Rent vs Own
- Severe rent burden
- 5148.0
Population outlook (District of Columbia County) Hauer SSP2
- Today (2025)
- 821,926 people
- By 2030
- 899,517 · +9.4%
- By 2040
- 1,061,162 · +29.1%
- By 2050
- 1,231,493 · +49.8%
- By 2075
- 1,603,312 · +95.1%
- By 2100
- 1,847,141 · +124.7%
Race, ethnicity, and origin ACS 2023
- Neighborhood character
- Predominantly Black (90%)
- Race & ethnicity
- Black 90% Two or more races 3% Hispanic / Latino 3% White 3%
- Common ancestry
- Lithuanian 1%
- Foreign-born
- 3% · Canada
- Languages at home
- 95% English-only · Spanish 2% French/Haitian/Cajun 1%
Political lean MEDSL · District of Columbia
- 2024 margin
- Solid D (+86.1) · D 91.2% · R 5.1% · Other 3.8%
- 2008→2024 swing
- +0.1pp no change · 2008: 85.9pp · 2024: 86.1pp
- All cycles
- 2024: D+86.1 2020: D+86.8 2016: D+88.7 2012: D+84.2 2008: D+85.9
Not yet ingested
- Civics
- —
Market trends
- HPI YoY
- ▼ -415.44%
- Current HPI
- 306.5068
- Rent YoY
- ▲ 3.86%
- Metro
- Washington-Arlington-Alexandria, DC-VA-MD-WV
- State GDP YoY
- ▲ 1.33%
- F500 in state
- 6
Industry mix (Fortune 500 HQ in DC)
| Industry | F500 HQs | Revenue |
|---|---|---|
| Financial Services | 1 | $153B |
|
||
| Life Sciences / Industrials | 1 | $25B |
|
||
| Industrial Machinery | 1 | $8B |
|
||
Price history
-3.2% since first listed2 events — show timeline
- 2026-04-11 Price Changed $179,000 BRIGHT MLS
- 2025-10-24 Listed $185,000 BRIGHT MLS
Property tax history
+7.7%/yrLatest (2025): $1,218 · -4.0% YoY. Source: county tax records.
Cash-flow waterfall
monthlySold comps — $/sqft
last 12 mo · ≤1 miLoading sold comps…