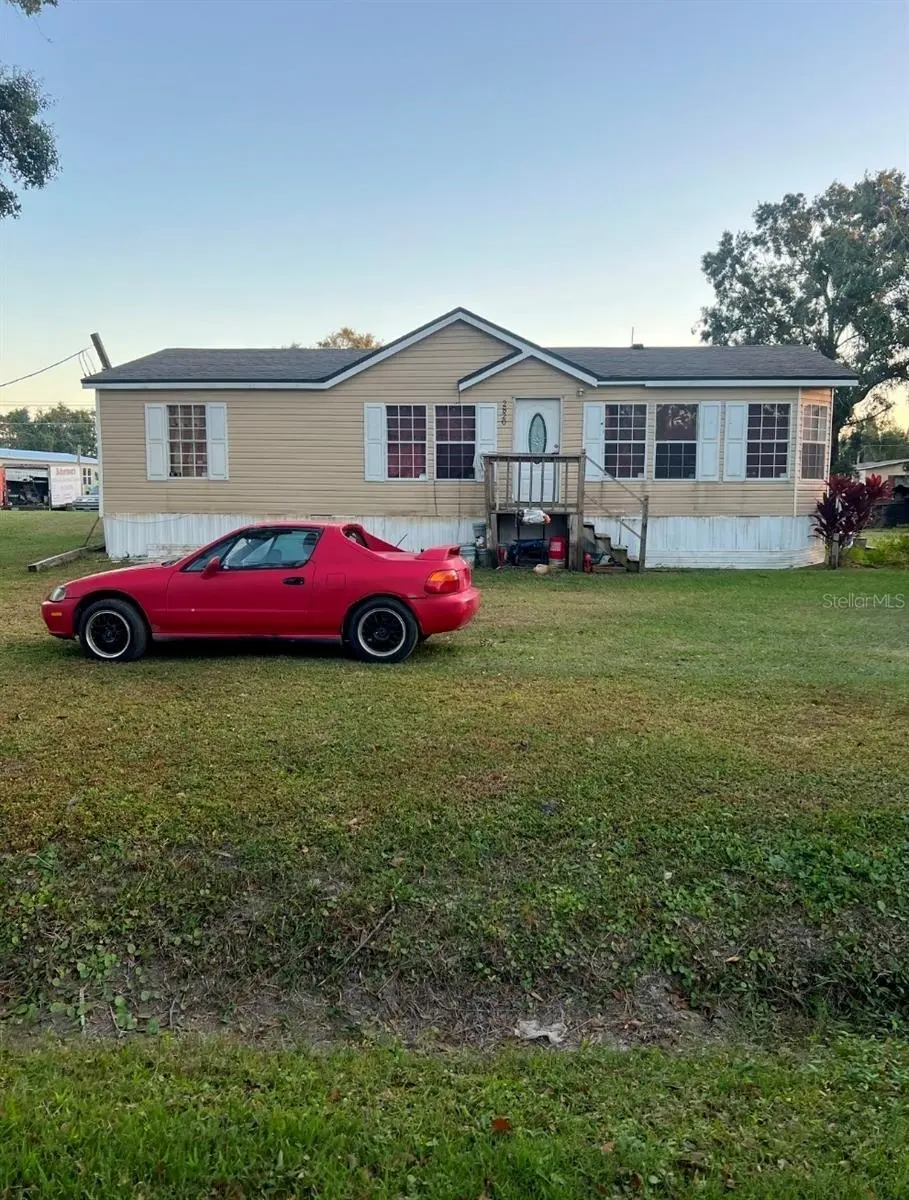
2820 Metro Dr · Ruskin, FL
Flood risk 1/10 · Minimal
- FEMA flood zone
- X (unshaded)
- Chance of flooding over 30 yrs
- 0.0%
- Est. flood insurance / yr
- $507 – $1,088
Fire risk 3/10 · Minor
- Est. fire insurance / yr
- $947 – $1,759
Heat risk 10/10 · Severe
- Hot days now (above 107°F)
- 7 days/yr
- Hot days in 30 yrs
- 28 days/yr
Wind risk 10/10 · Severe
- Chance of severe wind over 30 yrs
- 99.0%
Air-quality risk 3/10 · Minor
- Unhealthy air days now
- 3 days/yr
- Unhealthy air days in 30 yrs
- 4 days/yr
Risk factors via First Street. Map © Google.
Why this score? — see what drove the C+ grade
The composite is a weighted blend of 9 inputs, each scored 0–100. Each bar is that input's sub-score; the figure is the points it added to the 100-point composite (weight × sub-score).
- Cash flow +26.8/30.0
- DSCR +9.2/10.0
- ARV discount +7.5/15.0
- 1% rule +7.3/10.0
- Schools +4.2/10.0
- Livability +3.6/5.0
- Rent growth +2.7/5.0
- Condition / age +2.5/5.0
- Appreciation +0.0/10.0
$199,000
🖨 Deal sheet 📄 Offer letter ✓ Due diligence
Listing remarks MLS
Just under half acre ready to move 3 bedroom 2 bath new roof in 2023 and new ac installed 2024. No deed restrictions here or hoa's plenty of room for rv and boats come take a look see make your appointment buy now.
Key facts
- 0.4 acre lot
- Built 2005
- Listed 201 days
Neighborhood map
What this means for you Summary
Snapshot
- This is a 4-bed/2.0-bath manufactured listed at $199k.
Deal economics
- At list price, monthly cash flow is $542 ($7k/yr) — positive.
- The deal already cash-flows at list — no discount required.
- Meets the 1% rule at list price ($2k rent vs $199k).
- Recommended offer: $175k (12.0% below list) — sets the bar for market timing.
- Cap rate 9.6% vs local median 4.7% in Ruskin — top-decile yield for the area; either an underpriced asset or a hidden risk that comps aren't pricing in. Stress-test before assuming the spread holds.
Location & tenants
- Location reads 71/100 on livability (#392 in FL) — a middle-class / working-renter tenant base. Strengths: cost of living A+, housing A+, commute B+; Watch: schools F, amenities F, health & safety F.
- Hillsborough (suburban): math 47% / reading 50% proficiency, ranked #41 of 73 in FL (top 56%) — families likely to look elsewhere, expect single-tenant / working-renter base with shorter leases.
- Market conditions: Rents flat; 489 active listings in the ZIP; 9,053 units permitted in Hillsborough County in 2024 (4,555 in 5+ unit buildings).
- This rent runs 41% of the median local income ($72k/yr) — at the standard rent-burdened threshold; future hikes will face affordability resistance.
Forward outlook
- Local home prices are declining (-3.0%/yr); year-one equity from $1k of loan paydown is wiped out by about $6k of value loss. Plan a longer hold.
- Hillsborough County population projected at +37% by 2050 — long-run rental-demand tailwind backs the buy-and-hold thesis.
Negotiation context
- It's been on market 201 days — a 12% lower offer ($175k) is reasonable based on typical stale-listing flexibility.
- 3 sale attempts since 11y ago; this cycle's ask has dropped $16k (7%) from the opening price — seller is motivated, your offer sets the floor, not the list.
- Current owner paid $54k; list at $199k implies a 269% gain — meaningful room to come down on a strong offer.
Risks & watch-outs
- Climate carrying-cost: severe wind risk, 99% chance of damaging wind over 30y; extreme-heat days projected 7→28/yr by 2055 (HVAC capex compounding) — expect insurance premiums to compound above CPI over the hold.
Questions for the listing agent
- It's been on market 201 days. Have you received any prior offers? Is the seller open to a 12% concession, seller financing, or rate buy-down credit?
- Why hasn't it sold? Are there any deal-killer items the seller is aware of (foundation, flood, title, zoning, code violations)?
- Is there a deadline driving the sale (1031 exchange, divorce, estate, relocation)? That informs how much negotiation room exists.
- Schools are F-rated, which usually means shorter tenancies and higher turnover. Who's the typical renter profile here, and what's been the actual vacancy rate?
- What's the average days-on-market for RENTAL listings here right now (not sales)? A rising rental-DOM trend means longer vacancies and softer asking-rent achievability than the comps imply.
- What's the recent tenant-quality profile in this submarket — average credit score on applications, eviction rate, late-payment / NSF rate, and stable-employment percentage? A property-management company in the area should have these aggregated.
- How much new for-sale + rental construction is in the pipeline within 1–3 miles? Heavy new supply typically softens prices + rents 12–24 months out; constrained supply supports both.
Investment metrics
- 1% rule
- 1.23% ✓
- Cap rate
- 9.56%
- Cash-on-cash
- 11.68%
- DSCR
- 1.52
- GRM
- 6.8
CMA / ARV
No comps found within radius.
Projected returns pro-forma
-3.0% appreciation · 0.9% rent growth · sell at horizon
- IRR
- -1.3%
- Equity multiple
- 0.95×
- Total profit
- $-2,715
- Equity at exit
- $29,672
- IRR
- 6.0%
- Equity multiple
- 1.40×
- Total profit
- $22,392
- Equity at exit
- $17,206
Cash invested: $55,720 (down + closing). Projections, not guarantees.
Landlord ↔ Tenant lean methodology
- Overall (STATE)
- 87 Strongly Landlord-Friendly
- State Florida
- 87 Strongly Landlord-Friendly · R+3
- County
- — inherits STATE
- City
- — inherits STATE
ZIP-level market 33570
- Home prices YoY
- -28.8%
- Rents YoY
- 0.9%
- Active inventory
- 489
- Price-to-rent
- 6.8×
Monthly cashflow live
- Estimated rent
- $2,446 medium interval (Pro) →
- Mortgage (P&I)
- −$1,044
- Tax from tax record
- −$263 /mo · $3,161/yr
- Insurance
- −$83
- HOA
- −$0
- Vacancy / Maint / Mgmt
- −$514
- Net cashflow
- $542
Break-even live
UW: 25.0% down · 7.5% · 30yr · 1.5% tax · 5.0% vac · 8.0% maint · 8.0% mgmt
Financing live
Cash to close
- Down payment
- $49,750
- Closing costs
- $5,970
- Reserves months
- —
- Total cash needed
- —
Loan-product check · same deal, 3 products live
Conventional
25% down · 7.5% · 30yr
- Down + closing
- —
- Monthly P&I
- —
- Monthly cashflow
- —
- DSCR
- —
- Eligible?
- —
Personal DTI + credit; lowest rate.
DSCR
20% down · 8.5% · 30yr
- Down + closing
- —
- Monthly P&I
- —
- Monthly cashflow
- —
- DSCR
- —
- Eligible?
- —
No personal income docs; deal must DSCR.
Hard money
10% down · 12.0% · 12mo
- Down + closing
- —
- Monthly P&I
- —
- Monthly cashflow
- —
- DSCR
- —
- Eligible?
- —
Short-term bridge; refi at stabilization.
Listing history 8 events
-
2025-12-17price $199,000 214-char remark
Show marketing remark (214 chars)
Just under half acre ready to move 3 bedroom 2 bath new roof in 2023 and new ac installed 2024. No deed restrictions here or hoa's plenty of room for rv and boats come take a look see make your appointment buy now.
-
2025-10-30$214,900 Active 214-char remark
Show marketing remark (214 chars)
Just under half acre ready to move 3 bedroom 2 bath new roof in 2023 and new ac installed 2024. No deed restrictions here or hoa's plenty of room for rv and boats come take a look see make your appointment buy now.
-
2015-07-30soldstatus $54,000 Sold 75-char remark
Show marketing remark (75 chars)
HUD HOME FOR SALE. Sold "AS IS". Buyer to verify all information.
-
2015-07-14status Pending 75-char remark
Show marketing remark (75 chars)
HUD HOME FOR SALE. Sold "AS IS". Buyer to verify all information.
-
2015-07-09status Active 75-char remark
Show marketing remark (75 chars)
HUD HOME FOR SALE. Sold "AS IS". Buyer to verify all information.
-
2015-07-01status Pending 75-char remark
Show marketing remark (75 chars)
HUD HOME FOR SALE. Sold "AS IS". Buyer to verify all information.
-
2015-06-17$48,000 Active 75-char remark
Show marketing remark (75 chars)
HUD HOME FOR SALE. Sold "AS IS". Buyer to verify all information.
-
2005-10-20soldstatus $22,500
ⓘ Source: listings_history table (triggers on properties + properties_extension) + one-shot
backfill from property_details.listing_events for pre-trigger history.
Tax reassessment forecast FL · Resets to sale price
- Current annual tax
- $3,161 · $263/mo
- Projected year-2 tax
- $3,161 · $263/mo
- Expected delta
- $0/yr ($0/mo · 0.0%)
ⓘ Screening estimate from a state-policy table — verify with the county assessor before closing.
Climate risk First Street
- Flood 1/10 Low FEMA zone X (unshaded) · 0% chance over 30 yrs
- Wildfire 3/10 Moderate
- Heat 10/10 Extreme 7 d/yr ≥107°F today · 28 d/yr by 30 yrs out
- Wind 10/10 Extreme 99% chance of damaging wind over 30 yrs
- Air quality 3/10 Moderate 3 unhealthy d/yr today · 4 by 30 yrs out
Nearby sold comps map
Loading sold comps map…
Walkable amenities ~0.75 mi
Loading nearby amenities…
Taxation est. · year 1
- Rental income
- $29,352
- − Mortgage interest
- −$11,147
- − Property taxes
- −$3,161
- − Insurance
- −$995
- − Repairs & maintenance
- −$2,348
- − Management
- −$2,348
- − Depreciation
- −$5,789
- Taxable income
- $3,564
- Est. tax owed @ 24.0%
- −$855
- After-tax cash flow
- $5,654/yr
For passive investors: Depreciation is non-cash, so a rental often shows a tax loss while cash-flowing — sheltering income. Rental losses are passive: they offset passive income freely, and up to $25,000/yr can offset ordinary (W-2) income if you actively participate and your MAGI is under $100k (phasing out to $0 by $150k); unused losses carry forward. On sale, claimed depreciation is recaptured at up to 25%, and gains may owe capital-gains tax (a 1031 exchange can defer both). Figures are a year-1 estimate at your 24.0% rate — not tax advice; consult a CPA.
Schools (NCES district)
- District
- Hillsborough
- NCES district ID
- 1200870
- Math proficiency
- 47% ▼ -8.00%
- Reading proficiency
- 50% ▼ -4.00%
- Median HH income
- $50,622
- Composite
- 41.6/100
- National rank
- #3435
- State rank
- #41 of 73 in FL
Livability — Ruskin
- Score
- 71/100
- State rank
- #392
- US rank
- #6879
Category grades
Schools grade is shown separately in the Schools card above.
Census & demographics
- County
- Hillsborough County · 1,540,968 people
- City population
- 33,319
- Metro
- Tampa-St. Petersburg-Clearwater, FL
- Population (ZIP)
- 33,319
- Household income
- $72,172
- Rent vs Own
- Severe rent burden
- 611.0
Population outlook (Hillsborough County) Hauer SSP2
- Today (2025)
- 1,607,022 people
- By 2030
- 1,733,968 · +7.9%
- By 2040
- 1,979,565 · +23.2%
- By 2050
- 2,203,427 · +37.1%
- By 2075
- 2,667,893 · +66.0%
- By 2100
- 2,891,558 · +79.9%
Race, ethnicity, and origin ACS 2023
- Neighborhood character
- Diverse neighborhood (Simpson 0.69)
- Race & ethnicity
- White 40% Hispanic / Latino 32% Black 23% Two or more races 13% Asian 2%
- Hispanic origin (detail)
- Mexican 16% Puerto Rican 6% Cuban 1% Dominican 4%
- Common ancestry
- Italian 2% Romanian 2% Hispanic 2%
- Foreign-born
- 13% · Canada, Jamaica
- Languages at home
- 72% English-only · Spanish 23% French/Haitian/Cajun 2%
Political lean MEDSL · Hillsborough
- 2024 margin
- Toss-up / Even · D 47.8% · R 50.9% · Other 1.3%
- 2008→2024 swing
- -10.2pp toward R · 2008: 7.1pp · 2024: -3.1pp
- All cycles
- 2024: R+3.1 2020: D+6.9 2016: D+6.8 2012: D+6.7 2008: D+7.1
Not yet ingested
- Civics
- —
Market trends
- HPI YoY
- ▼ -112.10%
- Current HPI
- 277.8257
- Rent YoY
- ▲ 0.90%
- Metro
- Tampa-St. Petersburg-Clearwater, FL
- State GDP YoY
- ▲ 3.28%
- F500 in state
- 36
Industry mix (Fortune 500 HQ in FL)
| Industry | F500 HQs | Revenue |
|---|---|---|
| Industrial Technology | 2 | $29B |
|
||
| Insurance | 2 | $17B |
|
||
| Retail | 1 | $60B |
|
||
| Technology Distribution | 1 | $58B |
|
||
| Homebuilding | 1 | $35B |
|
||
| Technology Manufacturing | 1 | $35B |
|
||
Price history
+784.4% since first listed8 events — show timeline
- 2025-12-17 Price Changed $199,000 Stellar MLS as Distributed by MLS Grid
- 2025-10-30 Listed $214,900 Stellar MLS as Distributed by MLS Grid
- 2015-07-30 Sold (MLS) $54,000 Stellar MLS as Distributed by MLS Grid
- 2015-07-14 Pending — Stellar MLS as Distributed by MLS Grid
- 2015-07-09 Relisted — Stellar MLS as Distributed by MLS Grid
- 2015-07-01 Pending — Stellar MLS as Distributed by MLS Grid
- 2015-06-17 Listed $48,000 Stellar MLS as Distributed by MLS Grid
- 2005-10-20 Sold (Public Records) $22,500 Public Records
Property tax history
+22.0%/yrLatest (2025): $3,161 · +11.7% YoY. Source: county tax records.
Cash-flow waterfall
monthlySold comps — $/sqft
last 12 mo · ≤1 miLoading sold comps…