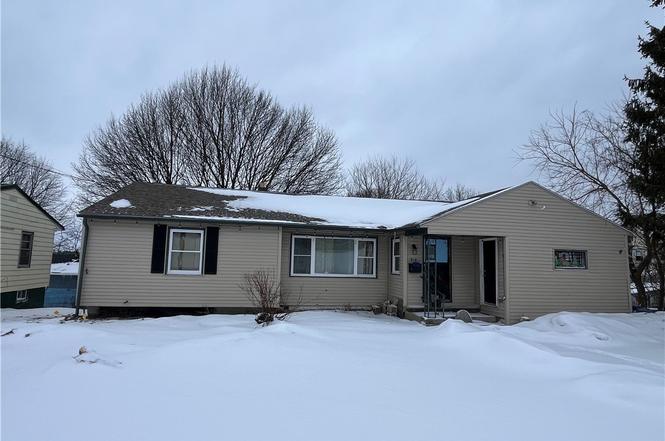
918 Stolp Ave · Syracuse, NY
Flood risk 1/10 · Minimal
- FEMA flood zone
- X (unshaded)
- Chance of flooding over 30 yrs
- 0.0%
- Est. flood insurance / yr
- $473 – $860
Fire risk 1/10 · Minimal
- Est. fire insurance / yr
- $691 – $1,283
Heat risk 3/10 · Minor
- Hot days now (above 95°F)
- 7 days/yr
- Hot days in 30 yrs
- 16 days/yr
Wind risk 1/10 · Minimal
- Chance of severe wind over 30 yrs
- 1.0%
Air-quality risk 2/10 · Minimal
- Unhealthy air days now
- 0 days/yr
- Unhealthy air days in 30 yrs
- 1 days/yr
Risk factors via First Street. Map © Google.
Why this score? — see what drove the B- grade
The composite is a weighted blend of 9 inputs, each scored 0–100. Each bar is that input's sub-score; the figure is the points it added to the 100-point composite (weight × sub-score).
- Cash flow +30.0/30.0
- 1% rule +10.0/10.0
- DSCR +10.0/10.0
- ARV discount +7.5/15.0
- Livability +3.9/5.0
- Rent growth +2.5/5.0
- Condition / age +2.5/5.0
- Schools +1.8/10.0
- Appreciation +0.0/10.0
$79,900
🖨 Deal sheet 📄 Offer letter ✓ Due diligence
Listing remarks
INVESTOR ALERT! Don’t miss this rare opportunity at 918 Stolp Ave, a large ranch perfectly positioned on the edge of the historic Strathmore neighborhood and directly across from the Woodland Reservoir. The main level offers a spacious layout with three bedrooms and two full bathrooms, including a dedicated primary en-suite. High-end touches such as original hardwood floors, wood-look ceramic kitchen tile, and soft-close cabinetry provide a head start for a higher adjusted resale value. The full walk-out basement is already plumbed for a third full bathroom and is ready to be transformed into additional living space. By finishing this level, the home’s footprint can grow to over
Key facts
- Soft-close cabinetry
- 5,808 sq ft lot
- Built 1970
Tags
Neighborhood map
What this means for you Summary
Snapshot
- This is a 3-bed/2.5-bath single-family listed at $80k.
Deal economics
- At list price, monthly cash flow is $721 ($9k/yr) — positive.
- The deal already cash-flows at list — no discount required.
- Meets the 1% rule at list price ($2k rent vs $80k).
- Cap rate 17.1% vs local median 8.2% in Syracuse — top-decile yield for the area; either an underpriced asset or a hidden risk that comps aren't pricing in. Stress-test before assuming the spread holds.
Location & tenants
- Location reads 77/100 on livability (#187 in NY, #2,869 nationally) — a middle-class / working-renter tenant base. Strengths: amenities A+, commute A+, cost of living A+; Watch: schools D+, crime F, employment D-.
- Syracuse City School District (urban): math 18% / reading 26% proficiency, ranked #590 of 590 in NY (top 100%) — low school quality limits family demand, transient renter base, plan for 1-2y turnover; 74% free/reduced lunch — lower-income household profile, screen leases tightly.
- Market conditions: 63 active listings in the ZIP; 15 comparable units currently listed for rent nearby; rentals at typical pace (median 21d on market — plan ~3-4 weeks tenant-placement turnaround); 616 units permitted in Onondaga County in 2024 (256 in 5+ unit buildings).
Forward outlook
- Local home prices are declining (-3.0%/yr); year-one equity from $552 of loan paydown is wiped out by about $2k of value loss. Plan a longer hold.
- Onondaga County population projected to shrink 9% by 2050 — rents likely to lag national; underwrite the cash flow, not the appreciation.
- At projected returns (-3.0% appreciation + 3.0% rent growth), your $22k cash investment doubles in ~4 years — after that, you're playing with house money.
Negotiation context
- Only 3 days on market — expect competitive offers; lowballing is unlikely to land.
Questions for the listing agent
- Built in 1970 — when were the roof, HVAC, electrical panel, plumbing, and water heater last replaced?
- Is there a deadline driving the sale (1031 exchange, divorce, estate, relocation)? That informs how much negotiation room exists.
- Schools are D-rated, which usually means shorter tenancies and higher turnover. Who's the typical renter profile here, and what's been the actual vacancy rate?
- Crime grade is F in this area — have there been break-ins, vandalism, or insurance claims at this property in the last 3 years? What carrier currently insures it and at what premium?
- What's the average days-on-market for RENTAL listings here right now (not sales)? A rising rental-DOM trend means longer vacancies and softer asking-rent achievability than the comps imply.
- What's the recent tenant-quality profile in this submarket — average credit score on applications, eviction rate, late-payment / NSF rate, and stable-employment percentage? A property-management company in the area should have these aggregated.
- How much new for-sale + rental construction is in the pipeline within 1–3 miles? Heavy new supply typically softens prices + rents 12–24 months out; constrained supply supports both.
Investment metrics
- 1% rule
- 2.01% ✓
- Cap rate
- 17.12%
- Cash-on-cash
- 38.68%
- DSCR
- 2.72
- GRM
- 4.1
CMA / ARV
- ARV (on-the-fly)
- $262,818
- Comps found
- 12
Show comp detail 12 sales within ~0.75 mi
| Address | Dist | Beds/Ba | Sqft | Sold | Price | $/sf | Match |
|---|---|---|---|---|---|---|---|
| 202 Fairdale Ave | 0.33mi | 3/1.5 | 1,720 (+3%) | 7mo | $227,000 | $132 | 70 |
| 1607 Stolp Ave | 0.36mi | 3/2.5 | 1,778 (+6%) | 9mo | $279,900 | $157 | 65 |
| 412 Roberts Ave | 0.37mi | 4/1.0 (+1) | 1,639 (-2%) | 7mo | $219,300 | $134 | 63 |
| 1015 Velasko Rd | 0.38mi | 3/1.5 | 1,557 (-7%) | 6mo | $280,000 | $180 | 62 |
| 413 Fitch St | 0.53mi | 3/2.0 | 1,624 (-3%) | 9mo | $50,000 | $31 | 61 |
| 505 Stinard Ave | 0.29mi | 4/2.0 (+1) | 1,496 (-11%) | 7mo | $242,500 | $162 | 56 |
| 127 Austin Ave | 0.46mi | 3/2.0 | 1,512 (-10%) | 7mo | $205,000 | $136 | 54 |
| 302 Carlton Rd | 0.64mi | 3/1.5 | 1,644 (-2%) | 11mo | $310,000 | $189 | 54 |
| 5167 Jupiter Inlt | 0.57mi | 2/2.0 (-1) | 1,812 (+8%) | 5mo | $340,000 | $188 | 48 |
| 626 Roberts Ave | 0.60mi | 4/1.5 (+1) | 1,760 (+5%) | 10mo | $235,000 | $134 | 46 |
| 122 Sunhill Ter | 0.54mi | 3/2.0 | 1,443 (-14%) | 7mo | $229,000 | $159 | 44 |
| 138 Merrell Rd | 0.75mi | 4/1.0 (+1) | 1,590 (-5%) | 6mo | $195,000 | $123 | 40 |
Match score weights: distance 35% · size 25% · config 20% · recency 20%. Top-matched comps best support the ARV.
Projected returns pro-forma
-3.0% appreciation · 3.0% rent growth · sell at horizon
- IRR
- 34.9%
- Equity multiple
- 2.48×
- Total profit
- $33,007
- Equity at exit
- $11,913
- IRR
- 41.7%
- Equity multiple
- 4.93×
- Total profit
- $87,974
- Equity at exit
- $6,908
Cash invested: $22,372 (down + closing). Projections, not guarantees.
Landlord ↔ Tenant lean methodology
- Overall (STATE)
- 15 Strongly Tenant-Friendly
- State New York
- 15 Strongly Tenant-Friendly · D+10
- County
- — inherits STATE
- City
- — inherits STATE
ZIP-level market 13207
- Home prices YoY
- -23.0%
- Active inventory
- 63
- Price-to-rent
- 4.1×
Monthly cashflow live
- Estimated rent
- $1,606 high interval (Pro) →
- Mortgage (P&I)
- −$419
- Tax from tax record
- −$95 /mo · $1,141/yr
- Insurance
- −$33
- HOA
- −$0
- Vacancy / Maint / Mgmt
- −$337
- Net cashflow
- $721
Break-even live
UW: 25.0% down · 7.5% · 30yr · 1.5% tax · 5.0% vac · 8.0% maint · 8.0% mgmt
Financing live
Cash to close
- Down payment
- $19,975
- Closing costs
- $2,397
- Reserves months
- —
- Total cash needed
- —
Loan-product check · same deal, 3 products live
Conventional
25% down · 7.5% · 30yr
- Down + closing
- —
- Monthly P&I
- —
- Monthly cashflow
- —
- DSCR
- —
- Eligible?
- —
Personal DTI + credit; lowest rate.
DSCR
20% down · 8.5% · 30yr
- Down + closing
- —
- Monthly P&I
- —
- Monthly cashflow
- —
- DSCR
- —
- Eligible?
- —
No personal income docs; deal must DSCR.
Hard money
10% down · 12.0% · 12mo
- Down + closing
- —
- Monthly P&I
- —
- Monthly cashflow
- —
- DSCR
- —
- Eligible?
- —
Short-term bridge; refi at stabilization.
Rent comps 15 comps
| Address | Beds | Baths | Sqft | Rent | $/sqft | DOM | Units | Dist |
|---|---|---|---|---|---|---|---|---|
| 315 Grant Ave #17 Syracuse, NY | 3.0 | 2.0 | 1477 | $1,275 | $0.86 | 13d | 1 | 0.19mi |
| 1110 Bellevue Ave Syracuse, NY | 3.0 | 1.0 | 1449 | $1,500 | $1.04 | 43d | 1 | 0.36mi |
| 409 Stolp Ave Syracuse, NY | 1.0–3.0 | 1.0 | 849 | $1,575 | $1.86 | 13d | 5 | 0.41mi |
| 214 Rowland St Syracuse, NY | 4.0 | 1.0 | 2092 | $1,800 | $0.86 | 13d | 1 | 0.51mi |
| 122 Putnam St Syracuse, NY | 3.0 | 1.0 | 1064 | $2,050 | $1.93 | 21d | 1 | 0.64mi |
| 318 Kellogg St Unit 1 Syracuse, NY | 3.0 | 1.0 | 1523 | $1,650 | $1.08 | 43d | 1 | 0.78mi |
| 318 Kellogg St Unit 2 Syracuse, NY | 3.0 | 1.0 | 1523 | $1,675 | $1.10 | 43d | 1 | 0.78mi |
| 326 Holland St Unit 1 Syracuse, NY | 3.0 | 1.0 | 2100 | $1,825 | $0.87 | 43d | 1 | 0.83mi |
| 229 Kellogg St Syracuse, NY | 2.0 | 1.0 | 2046 | $1,300 | $0.64 | 21d | 1 | 0.90mi |
| 5111 Ball Rd Syracuse, NY | 1.0–2.0 | 1.0–1.5 | 1138 | $1,820 | $1.60 | 13d | 16 | 0.93mi |
| 349 Bryant Ave Syracuse, NY | 3.0 | 1.5 | 1500 | $2,300 | $1.53 | 13d | 1 | 1.07mi |
| 121 Whittier Ave Syracuse, NY | 4.0 | 1.0 | 1400 | $600 | $0.43 | 43d | 1 | 1.12mi |
| 213 Fletcher Ave Unit 2 Syracuse, NY | 3.0 | 1.0 | 1200 | $1,700 | $1.42 | 13d | 1 | 1.19mi |
| 1330 Midland Ave Syracuse, NY | 4.0 | 1.0 | 1870 | $2,000 | $1.07 | 21d | 1 | 1.42mi |
| 269 W Borden Ave Syracuse, NY | 4.0 | 1.5 | 1800 | $650 | $0.36 | 21d | 1 | 1.44mi |
Listing history 2 events
-
2026-02-28status Pending
-
2026-02-25$79,900 Active
ⓘ Source: listings_history table (triggers on properties + properties_extension) + one-shot
backfill from property_details.listing_events for pre-trigger history.
Tax reassessment forecast NY · Partial reset (capped growth)
- Current annual tax
- $1,141 · $95/mo
- Projected year-2 tax
- $1,246 · $104/mo
- Expected delta
- +$105/yr (+$9/mo · 9.2%)
ⓘ Screening estimate from a state-policy table — verify with the county assessor before closing.
Climate risk First Street
- Flood 1/10 Low FEMA zone X (unshaded) · 0% chance over 30 yrs
- Wildfire 1/10 Low
- Heat 3/10 Moderate 7 d/yr ≥95°F today · 16 d/yr by 30 yrs out
- Wind 1/10 Low 100% chance of damaging wind over 30 yrs
- Air quality 2/10 Low 0 unhealthy d/yr today · 1 by 30 yrs out
Nearby sold comps map
Loading sold comps map…
Walkable amenities ~0.75 mi
Loading nearby amenities…
Taxation est. · year 1
- Rental income
- $19,269
- − Mortgage interest
- −$4,476
- − Property taxes
- −$1,141
- − Insurance
- −$400
- − Repairs & maintenance
- −$1,542
- − Management
- −$1,542
- − Depreciation
- −$2,324
- Taxable income
- $7,846
- Est. tax owed @ 24.0%
- −$1,883
- After-tax cash flow
- $6,771/yr
For passive investors: Depreciation is non-cash, so a rental often shows a tax loss while cash-flowing — sheltering income. Rental losses are passive: they offset passive income freely, and up to $25,000/yr can offset ordinary (W-2) income if you actively participate and your MAGI is under $100k (phasing out to $0 by $150k); unused losses carry forward. On sale, claimed depreciation is recaptured at up to 25%, and gains may owe capital-gains tax (a 1031 exchange can defer both). Figures are a year-1 estimate at your 24.0% rate — not tax advice; consult a CPA.
Schools (NCES district)
- District
- Syracuse City School District
- NCES district ID
- 3628590
- Math proficiency
- 18% ▼ -5.00%
- Reading proficiency
- 26% ▬ 0.00%
- Median HH income
- $32,097
- Composite
- 17.83/100
- National rank
- #9007
- State rank
- #590 of 590 in NY
Livability — Syracuse
- Score
- 77/100
- State rank
- #187
- US rank
- #2869
Category grades
Schools grade is shown separately in the Schools card above.
Census & demographics
- Census place
- Syracuse, NY
- City population
- 152,627
- Population (ZIP)
- 12,383
Population outlook (Onondaga County) Hauer SSP2
- Today (2025)
- 467,894 people
- By 2030
- 463,381 · -1.0%
- By 2040
- 447,697 · -4.3%
- By 2050
- 426,399 · -8.9%
- By 2075
- 373,661 · -20.1%
- By 2100
- 307,967 · -34.2%
Race, ethnicity, and origin ACS 2023
- Neighborhood character
- Diverse neighborhood (Simpson 0.68)
- Race & ethnicity
- White 43% Black 33% Hispanic / Latino 17% Two or more races 11% Native American 1% Asian 1%
- Hispanic origin (detail)
- Puerto Rican 13% Cuban 1%
- Common ancestry
- Romanian 3% Lithuanian 1% Slovak 1%
- Foreign-born
- 4% · Canada, South Korea
- Languages at home
- 89% English-only · Spanish 9% French/Haitian/Cajun 1%
Political lean MEDSL · Onondaga
- 2024 margin
- D (+17.3) · D 58.6% · R 41.4%
- 2008→2024 swing
- -3.0pp toward R · 2008: 20.3pp · 2024: 17.3pp
- All cycles
- 2024: D+17.3 2020: D+20.6 2016: D+12.8 2012: D+21.1 2008: D+20.3
Not yet ingested
- Civics
- —
Market trends
- HPI YoY
- ▼ -95.17%
- Current HPI
- 318.9257
- Rent YoY
- —
- Metro
- —
- State GDP YoY
- ▲ 2.60%
- F500 in state
- 92
Industry mix (Fortune 500 HQ in NY)
| Industry | F500 HQs | Revenue |
|---|---|---|
| Financial Services | 10 | $950B |
|
||
| Consumer Goods | 9 | $162B |
|
||
| Insurance | 4 | $225B |
|
||
| Telecommunications | 2 | $144B |
|
||
| Pharmaceuticals | 2 | $112B |
|
||
| Media / Entertainment | 2 | $69B |
|
||
Price history
2 events — show timeline
- 2026-02-28 Pending — CNYIS
- 2026-02-25 Listed $79,900 CNYIS
Property tax history
-0.1%/yrLatest (2025): $1,141 · +0.0% YoY. Source: county tax records.
Cash-flow waterfall
monthlySold comps — $/sqft
last 12 mo · ≤1 miLoading sold comps…