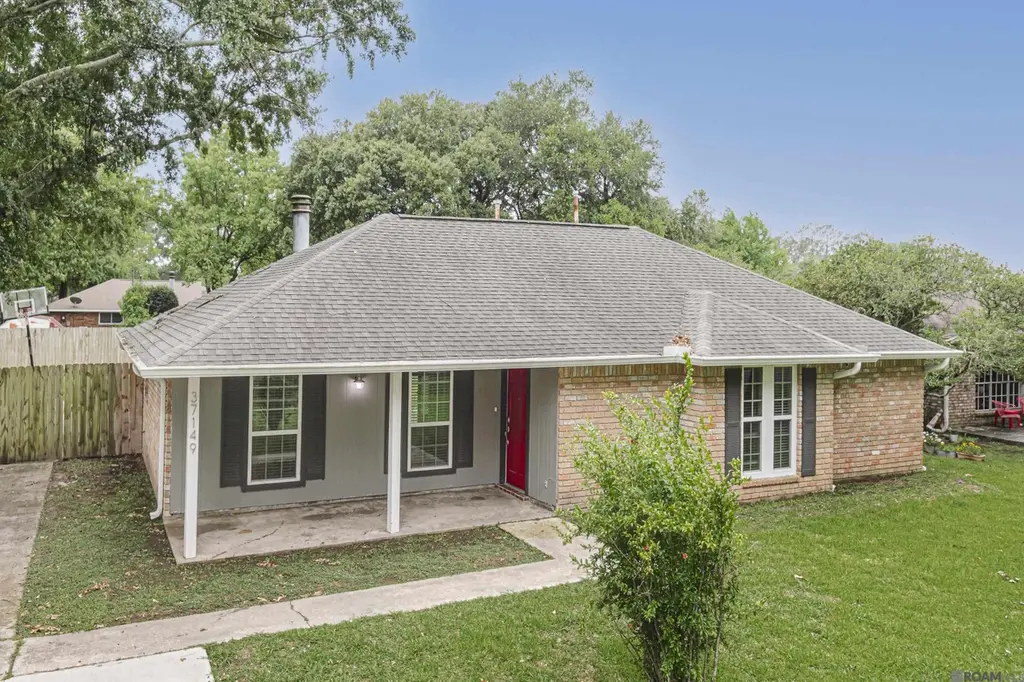
37149 Sue St · Prairieville, LA
Flood risk 1/10 · Minimal
- FEMA flood zone
- X
- Chance of flooding over 30 yrs
- 0.0%
- Est. flood insurance / yr
- $507 – $1,088
Fire risk 1/10 · Minimal
- Est. fire insurance / yr
- $1,269 – $2,357
Heat risk 8/10 · Major
- Hot days now (above 108°F)
- 7 days/yr
- Hot days in 30 yrs
- 21 days/yr
Wind risk 9/10 · Severe
- Chance of severe wind over 30 yrs
- 99.0%
Air-quality risk 2/10 · Minimal
- Unhealthy air days now
- 1 days/yr
- Unhealthy air days in 30 yrs
- 2 days/yr
Risk factors via First Street. Map © Google.
Why this score? — see what drove the D grade
The composite is a weighted blend of 9 inputs, each scored 0–100. Each bar is that input's sub-score; the figure is the points it added to the 100-point composite (weight × sub-score).
- Cash flow +13.6/30.0
- ARV discount +10.3/15.0
- Schools +4.7/10.0
- DSCR +4.1/10.0
- Livability +3.5/5.0
- 1% rule +3.0/10.0
- Rent growth +2.5/5.0
- Condition / age +2.5/5.0
- Appreciation +0.0/10.0
$265,000
🖨 Deal sheet (PDF) 📄 Offer letter ✓ Due diligence
Listing remarks MLS
NEW ROOF- JUST REPLACED IN 2026! Lovely updated brick home in Dutchtown. Located in established neighborhood off Hwy,. 73, next to Dutchtown Middle & Primary School and directly across the street from Dutchtown High. Have the kids walk to school! Inside has been painted neutral colors, granite countertops in kitchen with white cabinets, recessed lighting, no carpet, all hardwood floors and ceramic. Large fenced backyard complete with a shed. Convenient location to I-10. No flood insurance required! Very rare for a house to come up in this neighborhood! So jump on this opportunity as fast as you can!
Key facts
- Convenient location
- Granite countertops
- New roof
Tags
Property features AI
Finance
- Other: Subdivision: Dutchtown Acres; Directions: Hwy 73 to John St., left on Rosetta, right on Sue
Exterior
- Parking: 2 parking spaces; 2-car carport
- Utilities: Public water; Public sewer; Cable connected
- Home design: Detached single-family home; Residential property
- Construction: Brick construction; Shingle roof; Slab foundation; Built on lot approximately 0.27 acres (83 x 140)
- Exterior features: Porch; Fenced yard (wood, full)
Interior
- Kitchen: Range; Oven; Dishwasher; Disposal; Microwave; Stainless steel appliances
- Flooring: Tile; Wood; Ceramic tile; Laminate
- Bathrooms: 2 full bathrooms
- Heating & cooling: Electric heating; Central air; Ceiling fans
- Interior features: Fireplace (1); Lighting
- Laundry & utility: Laundry inside
Neighborhood map
What this means for you Summary
Snapshot
- This is a 3-bed/2.0-bath single-family listed at $265k.
Deal economics
- At list price, monthly cash flow is $15 ($184/yr) — positive.
- The deal already cash-flows at list — no discount required.
- To meet the 1% rule (rent ≥ 1% of price), the offer needs to be $211k (20.3% below list).
- Recommended offer: $211k (20.3% below list) — sets the bar for 1% rule.
- Cap rate 6.4% vs local median 4.4% in Prairieville — top-decile yield for the area; either an underpriced asset or a hidden risk that comps aren't pricing in. Stress-test before assuming the spread holds.
Location & tenants
- Location reads 69/100 on livability (#70 in LA) — a middle-class / working-renter tenant base. Strengths: employment A+, housing A+, crime B+; Watch: amenities F, commute F, health & safety F.
- Ascension Parish (suburban): math 48% / reading 58% proficiency, ranked #7 of 98 in LA (top 7%) — acceptable for families but not a draw, mixed tenant base, ~2y average lease.
- Zoned schools: Dutchtown Primary School (math 65% / reading 73%, grade A-, #32 of 646 statewide, top 5%, 603 students, 43% FRL); Dutchtown Middle School (math 56% / reading 70%, grade B+, #10 of 218 statewide, top 5%, 657 students, 36% FRL); Dutchtown High School (math 70% / reading 68%, grade B, #9 of 265 statewide, top 3%, 2,643 students, 30% FRL).
- Zoned-school proficiency averages 67% at this address vs 53% district-wide (+14 pts) — the actual schools serving this property are materially stronger than the Ascension Parish average implies; a family-tenant draw the district grade alone would hide.
- Market conditions: 139 active listings in the ZIP; 2 comparable units currently listed for rent nearby; 579 units permitted in Ascension Parish in 2024 (0 in 5+ unit buildings).
Forward outlook
- Local home prices are declining (-3.0%/yr); year-one equity from $2k of loan paydown is wiped out by about $8k of value loss. Plan a longer hold.
- Ascension County population projected at +43% by 2050 — long-run rental-demand tailwind backs the buy-and-hold thesis.
Negotiation context
- Only 11 days on market — expect competitive offers; lowballing is unlikely to land.
- 10 sale attempts since 26y ago with the ask held roughly flat each time — persistent listings suggest the price (not the market) is what's stuck; bring a comps-based counter.
- Current owner paid $95k; list at $265k implies a 179% gain — meaningful room to come down on a strong offer.
Risks & watch-outs
- Climate carrying-cost: severe wind risk, 99% chance of damaging wind over 30y; extreme-heat days projected 7→21/yr by 2055 (HVAC capex compounding) — expect insurance premiums to compound above CPI over the hold.
Questions for the listing agent
- Is there a deadline driving the sale (1031 exchange, divorce, estate, relocation)? That informs how much negotiation room exists.
- Schools are A-rated — typically a magnet for longer-tenancy family renters. What's the average tenant stay here, and is there a school-zone premium baked into asking?
- The area grade is low — what's the realistic commute time and amenity access for the typical tenant pool here? Any planned neighborhood developments (good or bad) we should know about?
- What's the average days-on-market for RENTAL listings here right now (not sales)? A rising rental-DOM trend means longer vacancies and softer asking-rent achievability than the comps imply.
- What's the recent tenant-quality profile in this submarket — average credit score on applications, eviction rate, late-payment / NSF rate, and stable-employment percentage? A property-management company in the area should have these aggregated.
- How much new for-sale + rental construction is in the pipeline within 1–3 miles? Heavy new supply typically softens prices + rents 12–24 months out; constrained supply supports both.
Investment metrics
- 1% rule
- 0.80% ✗
- Cap rate
- 6.36%
- Cash-on-cash
- 0.25%
- DSCR
- 1.01
- GRM
- 10.5
CMA / ARV
- ARV (on-the-fly)
- $282,625
- Comps found
- 12
Show comp detail 12 sales within ~0.75 mi
| Address | Dist | Beds/Ba | Sqft | Sold | Price | $/sf | Match |
|---|---|---|---|---|---|---|---|
| 37092 Sue St | 0.12mi | 3/2.0 | 1,534 (-5%) | 8mo | $285,000 | $186 | 80 |
| 37101 Sue St | 0.09mi | 3/2.0 | 1,484 (-8%) | 10mo | $199,000 | $134 | 74 |
| 37055 John St | 0.18mi | 3/2.5 | 1,716 (+6%) | 7mo | $285,000 | $166 | 73 |
| 12501 Dutchtown Villa Dr | 0.73mi | 3/2.0 | 1,584 (-2%) | 4mo | $265,000 | $167 | 60 |
| 12410 Sugarmill Dr | 0.62mi | 3/2.0 | 1,676 (+4%) | 10mo | $325,000 | $194 | 57 |
| 13008 Dutchtown Mill Dr | 0.61mi | 3/2.0 | 1,745 (+8%) | 2mo | $314,000 | $180 | 56 |
| 12470 Highland Dr | 0.70mi | 3/2.0 | 1,573 (-3%) | 13mo | $275,000 | $175 | 52 |
| 37219 Cobblestone Ave | 0.15mi | 4/2.0 (+1) | 1,815 (+12%) | 23mo | $285,000 | $157 | 48 |
| 13229 Old Dutchtown Ave | 0.61mi | 3/2.5 | 1,822 (+13%) | 9mo | $330,000 | $181 | 40 |
| 37363 Mill Park Ave | 0.47mi | 3/3.0 | 1,807 (+12%) | 19mo | $337,500 | $187 | 38 |
| 12486 Highland Dr | 0.68mi | 3/2.0 | 1,416 (-12%) | 19mo | $1,700 | $1 | 32 |
| 12498 Highland Dr | 0.67mi | 4/2.0 (+1) | 1,844 (+14%) | 11mo | $315,000 | $171 | 31 |
Match score weights: distance 35% · size 25% · config 20% · recency 20%. Top-matched comps best support the ARV.
Projected returns pro-forma
-3.0% appreciation · 3.0% rent growth · sell at horizon
- IRR
- -15.9%
- Equity multiple
- 0.43×
- Total profit
- $-42,043
- Equity at exit
- $39,512
- IRR
- -7.6%
- Equity multiple
- 0.52×
- Total profit
- $-35,671
- Equity at exit
- $22,912
Cash invested: $74,200 (down + closing). Projections, not guarantees.
Landlord ↔ Tenant lean methodology
- Overall (STATE)
- 90 Strongly Landlord-Friendly
- State Louisiana
- 90 Strongly Landlord-Friendly · R+12
- County
- — inherits STATE
- City
- — inherits STATE
ZIP-level market 70734
- Home prices YoY
- -21.6%
- Active inventory
- 139
- Price-to-rent
- 10.5×
Monthly cashflow live
- Estimated rent
- $2,111 medium interval (Pro) →
- Mortgage (P&I)
- −$1,390
- Tax from tax record
- −$152 /mo · $1,826/yr
- Insurance
- −$110
- HOA
- −$0
- Vacancy / Maint / Mgmt
- −$443
- Net cashflow
- $15
Break-even live
Sensitivity live
| Price | -10% $165 | -5% $90 | +0% $15 | +5% $-60 | +10% $-135 |
|---|---|---|---|---|---|
| Rent | -10% $-151 | -5% $-68 | +0% $15 | +5% $99 | +10% $182 |
| Rate | -1.0pp $149 | -0.5pp $83 | base $15 | +0.5pp $-53 | +1.0pp $-123 |
UW: 25.0% down · 7.5% · 30yr · 1.5% tax · 5.0% vac · 8.0% maint · 8.0% mgmt
Financing live
Cash to close
- Down payment
- $66,250
- Closing costs
- $7,950
- Reserves months
- —
- Total cash needed
- —
Loan-product check · same deal, 3 products live
Conventional
25% down · 7.5% · 30yr
- Down + closing
- —
- Monthly P&I
- —
- Monthly cashflow
- —
- DSCR
- —
- Eligible?
- —
Personal DTI + credit; lowest rate.
DSCR
20% down · 8.5% · 30yr
- Down + closing
- —
- Monthly P&I
- —
- Monthly cashflow
- —
- DSCR
- —
- Eligible?
- —
No personal income docs; deal must DSCR.
Hard money
10% down · 12.0% · 12mo
- Down + closing
- —
- Monthly P&I
- —
- Monthly cashflow
- —
- DSCR
- —
- Eligible?
- —
Short-term bridge; refi at stabilization.
Rent comps 2 comps
| Address | Beds | Baths | Sqft | Rent | $/sqft | DOM | Units | Dist |
|---|---|---|---|---|---|---|---|---|
| 13170 Dutchtown Point Ave Gonzales, LA | 1.0–3.0 | 1.0–2.0 | 958 | $1,615 | $1.69 | 16d | 28 | 0.45mi |
| 37393 Preserve Trl Gonzales, LA | 3.0 | 2.5 | 1956 | $2,500 | $1.28 | 16d | 2 | 0.49mi |
Listing history 7 events
-
2026-06-21days on market $265,000 Active 11 DOM
-
2026-06-18days on market $265,000 Active 8 DOM
-
2026-06-17days on market $265,000 Active 7 DOM
-
2026-06-16days on market $265,000 Active 6 DOM
-
2026-06-15days on market $265,000 Active 5 DOM
-
2026-06-14remarks 609-char remark
-
2026-06-14$265,000 Active 3 DOM
ⓘ Source: listings_history table (triggers on properties + properties_extension) + one-shot
backfill from property_details.listing_events for pre-trigger history.
Tax reassessment forecast LA · Resets to sale price
- Current annual tax
- $1,826 · $152/mo
- Projected year-2 tax
- $1,826 · $152/mo
- Expected delta
- $0/yr ($0/mo · 0.0%)
ⓘ Screening estimate from a state-policy table — verify with the county assessor before closing.
Climate risk First Street
- Flood 1/10 Low FEMA zone X · 0% chance over 30 yrs
- Wildfire 1/10 Low
- Heat 8/10 Severe 7 d/yr ≥108°F today · 21 d/yr by 30 yrs out
- Wind 9/10 Extreme 99% chance of damaging wind over 30 yrs
- Air quality 2/10 Low 1 unhealthy d/yr today · 2 by 30 yrs out
Nearby sold comps map
Loading sold comps map…
Walkable amenities ~0.75 mi
Loading nearby amenities…
Taxation est. · year 1
- Rental income
- $25,330
- − Mortgage interest
- −$14,844
- − Property taxes
- −$1,826
- − Insurance
- −$1,325
- − Repairs & maintenance
- −$2,026
- − Management
- −$2,026
- − Depreciation
- −$7,709
- Taxable loss
- −$4,426
- Est. tax savings @ 24.0%
- +$1,062
- After-tax cash flow
- $1,246/yr
For passive investors: Depreciation is non-cash, so a rental often shows a tax loss while cash-flowing — sheltering income. Rental losses are passive: they offset passive income freely, and up to $25,000/yr can offset ordinary (W-2) income if you actively participate and your MAGI is under $100k (phasing out to $0 by $150k); unused losses carry forward. On sale, claimed depreciation is recaptured at up to 25%, and gains may owe capital-gains tax (a 1031 exchange can defer both). Figures are a year-1 estimate at your 24.0% rate — not tax advice; consult a CPA.
Schools (NCES district)
- District
- Ascension Parish
- NCES district ID
- 2200090
- Math proficiency
- 48% ▼ -31.00%
- Reading proficiency
- 58% ▼ -25.00%
- Median HH income
- $68,423
- Composite
- 47.0/100
- National rank
- #2347
- State rank
- #7 of 98 in LA
Livability — Prairieville
- Score
- 69/100
- State rank
- #70
- US rank
- #8507
Category grades
Schools grade is shown separately in the Schools card above.
Census & demographics
- City population
- 49,278
- Population (ZIP)
- 9,880
Population outlook (Ascension County) Hauer SSP2
- Today (2025)
- 145,480 people
- By 2030
- 158,329 · +8.8%
- By 2040
- 183,741 · +26.3%
- By 2050
- 207,615 · +42.7%
- By 2075
- 260,244 · +78.9%
- By 2100
- 289,576 · +99.0%
Race, ethnicity, and origin ACS 2023
- Neighborhood character
- Diverse neighborhood (Simpson 0.59)
- Race & ethnicity
- White 58% Hispanic / Latino 21% Black 17% Two or more races 14% Asian 2%
- Hispanic origin (detail)
- Mexican 6%
- Common ancestry
- Lithuanian 4% Italian 2% Serbian 2%
- Foreign-born
- 5% · Canada, Jamaica, South Korea
- Languages at home
- 91% English-only · Spanish 6% French/Haitian/Cajun 1% Other Asian/Pacific 1%
Political lean MEDSL · Ascension
- 2024 margin
- Solid R (+34.0) · D 32.2% · R 66.1% · Other 1.7%
- 2008→2024 swing
- +1.7pp toward D · 2008: -35.7pp · 2024: -34.0pp
- All cycles
- 2024: R+34.0 2020: R+32.5 2016: R+36.0 2012: R+34.3 2008: R+35.7
Not yet ingested
- Civics
- —
Market trends
- HPI YoY
- ▼ -40.70%
- Current HPI
- 148.0987
- Rent YoY
- —
- Metro
- —
- State GDP YoY
- ▲ 3.29%
- F500 in state
- 10
Industry mix (Fortune 500 HQ in LA)
| Industry | F500 HQs | Revenue |
|---|---|---|
| Telecommunications | 2 | $23B |
|
||
| Utilities | 1 | $12B |
|
||
| Wholesale / Distribution | 1 | $5B |
|
||
| Advertising | 1 | $2B |
|
||
Price history
+178.9% since first listed17 events — show timeline
- 2026-06-10 Listed $265,000 GBRMLS
- 2026-06-10 Listed $265,000 AcadianaMLS
- 2025-03-25 Relisted — GBRMLS
- 2025-03-10 Pending — GBRMLS
- 2025-02-28 Listed $265,000 GBRMLS
- 2025-02-28 Listed $265,000 AcadianaMLS
- 2024-06-25 Delisted — GBRMLS
- 2024-06-18 Price Changed $255,000 GBRMLS
- 2024-05-30 Price Changed $265,000 GBRMLS
- 2024-05-20 Listed $255,000 AcadianaMLS
- 2024-05-20 Listed $275,000 GBRMLS
- 2001-04-19 Sold (Public Records) $95,000 Public Records
- 2001-04-19 Sold (Public Records) — Public Records
- 2001-04-18 Sold (MLS) — GBRMLS
- 2000-10-09 Listed $99,000 GBRMLS
- 2000-10-09 Listed $99,000 AcadianaMLS
- 2000-05-08 Listed $95,000 AcadianaMLS
Property tax history
+4.4%/yrLatest (2025): $1,826 · -1.5% YoY. Source: county tax records.
Cash-flow waterfall
monthlySold comps — $/sqft
last 12 mo · ≤1 miLoading sold comps…