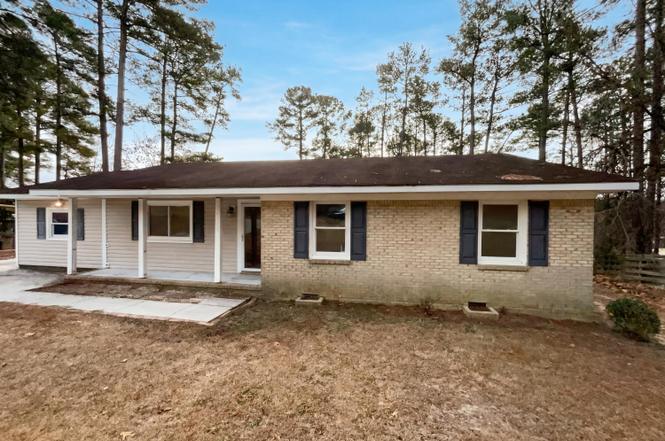
1004 Vesper Ln · Fayetteville, NC
Flood risk 1/10 · Minimal
- FEMA flood zone
- X (unshaded)
- Chance of flooding over 30 yrs
- 0.0%
- Est. flood insurance / yr
- $507 – $1,088
Fire risk 4/10 · Minor
- Est. fire insurance / yr
- $906 – $1,684
Heat risk 7/10 · Major
- Hot days now (above 105°F)
- 7 days/yr
- Hot days in 30 yrs
- 16 days/yr
Wind risk 7/10 · Major
- Chance of severe wind over 30 yrs
- 78.0%
Air-quality risk 2/10 · Minimal
- Unhealthy air days now
- 0 days/yr
- Unhealthy air days in 30 yrs
- 1 days/yr
Risk factors via First Street. Map © Google.
Why this score? — see what drove the D- grade
The composite is a weighted blend of 9 inputs, each scored 0–100. Each bar is that input's sub-score; the figure is the points it added to the 100-point composite (weight × sub-score).
- ARV discount +10.6/15.0
- Cash flow +10.0/30.0
- Livability +3.8/5.0
- Rent growth +3.2/5.0
- Schools +3.1/10.0
- 1% rule +2.8/10.0
- DSCR +2.8/10.0
- Condition / age +2.5/5.0
- Appreciation +0.0/10.0
$188,000
🖨 Deal sheet (PDF) 📄 Offer letter ✓ Due diligence
Listing remarks
Welcome to 1004 Vesper Ln, a home that exudes charm and sophistication. The kitchen is a chef's dream, boasting an accent backsplash that adds a touch of elegance to the space. The culinary experience is further enhanced by the inclusion of all stainless steel appliances, ensuring a modern and efficient cooking environment. Step outside to a spacious deck, perfect for entertaining or simply enjoying a quiet evening under the stars. The property also features a fenced-in backyard, providing privacy and a safe space for outdoor activities. This home is a perfect blend of style and comfort, making it a must-see for those seeking a unique living experience.
Key facts
- Spacious deck
- Fenced-in backyard
- Accent backsplash
Tags
Property features AI
Finance
- HOA & community: No homeowners association
Exterior
- Parking: 1 open parking space
- Utilities: Public water; Public sewer
- Home design: Single-story home
- Construction: Brick and vinyl siding exterior; Composition/shingle roof; Other foundation
- Exterior features: Public-maintained road access; Lot size about 0.31 acres
Interior
- Bedrooms: 3 bedrooms (all on the main level)
- Flooring: Hardwood; Tile
- Bathrooms: 2 full bathrooms
- Heating & cooling: Central heating; Central air conditioning
- Interior features: Hardwood and tile flooring
Neighborhood map
What this means for you Summary
Snapshot
- This is a 3-bed/2.0-bath single-family listed at $188k.
Deal economics
- At list price, monthly cash flow is $-114 ($-1k/yr) — negative.
- To cash-flow at today's rent, offer at most $168k (10.7% below list).
- To meet the 1% rule (rent ≥ 1% of price), the offer needs to be $147k (21.8% below list).
- Recommended offer: $147k (21.8% below list) — sets the bar for 1% rule.
Location & tenants
- Location reads 75/100 on livability (#45 in NC, #4,031 nationally) — a middle-class / working-renter tenant base. Strengths: commute A+, cost of living A+, housing A+; Watch: crime F, employment D-.
- Cumberland County Schools (urban): math 32% / reading 41% proficiency, ranked #126 of 178 in NC (top 71%) — families likely to look elsewhere, expect single-tenant / working-renter base with shorter leases.
- Zoned schools: Westarea Elementary (math 12% / reading 27%, grade F, #1,242 of 1,410 statewide, top 90%, 559 students, 100% FRL); Luther Nick Jeralds Middle (math 13% / reading 24%, grade F, #436 of 475 statewide, top 93%, 616 students, 100% FRL); E E Smith High (math 42% / reading 41%, grade F, #381 of 535 statewide, top 72%, 1,004 students, 99% FRL) — zoned schools average 99% FRL vs 55% district-wide (45 pts higher); higher-poverty schools than district average — tighter screening recommended.
- Market conditions: Rents rising (+2.8%/yr); 363 active listings in the ZIP; 26 comparable units currently listed for rent nearby; rentals at typical pace (median 26d on market — plan ~3-4 weeks tenant-placement turnaround); 1,125 units permitted in Cumberland County in 2024 (104 in 5+ unit buildings).
Forward outlook
- Local home prices are declining (-3.0%/yr); year-one equity from $1k of loan paydown is wiped out by about $6k of value loss. Plan a longer hold.
Negotiation context
- It's been on market 137 days — a 12% lower offer ($165k) is reasonable based on typical stale-listing flexibility.
Risks & watch-outs
- Climate carrying-cost: major wind risk, 78% chance of damaging wind over 30y; extreme-heat days projected 7→16/yr by 2055 (HVAC capex compounding) — expect insurance premiums to compound above CPI over the hold.
Questions for the listing agent
- What do current leases actually rent for vs. the listed asking? Can we see a recent rent roll and the last 12 months of T-12 income?
- It's been on market 137 days. Have you received any prior offers? Is the seller open to a 22% concession, seller financing, or rate buy-down credit?
- Why hasn't it sold? Are there any deal-killer items the seller is aware of (foundation, flood, title, zoning, code violations)?
- Is there a deadline driving the sale (1031 exchange, divorce, estate, relocation)? That informs how much negotiation room exists.
- Crime grade is F in this area — have there been break-ins, vandalism, or insurance claims at this property in the last 3 years? What carrier currently insures it and at what premium?
- The area grade is low — what's the realistic commute time and amenity access for the typical tenant pool here? Any planned neighborhood developments (good or bad) we should know about?
- What's the average days-on-market for RENTAL listings here right now (not sales)? A rising rental-DOM trend means longer vacancies and softer asking-rent achievability than the comps imply.
- What's the recent tenant-quality profile in this submarket — average credit score on applications, eviction rate, late-payment / NSF rate, and stable-employment percentage? A property-management company in the area should have these aggregated.
- How much new for-sale + rental construction is in the pipeline within 1–3 miles? Heavy new supply typically softens prices + rents 12–24 months out; constrained supply supports both.
Investment metrics
- 1% rule
- 0.78% ✗
- Cap rate
- 5.57%
- Cash-on-cash
- -2.60%
- DSCR
- 0.88
- GRM
- 10.7
CMA / ARV
- ARV (on-the-fly)
- $202,120
- Comps found
- 12
Show comp detail 12 sales within ~0.75 mi
| Address | Dist | Beds/Ba | Sqft | Sold | Price | $/sf | Match |
|---|---|---|---|---|---|---|---|
| 1016 Vesper Ln | 0.06mi | 3/1.5 | 1,220 (-2%) | 10mo | $180,000 | $148 | 85 |
| 1040 Vesper Ln | 0.15mi | 3/2.0 | 1,270 (+2%) | 11mo | $221,700 | $175 | 80 |
| 652 Dowfield Dr | 0.45mi | 3/2.0 | 1,258 (+2%) | 1mo | $208,000 | $165 | 76 |
| 1109 Vesper Ln | 0.19mi | 3/2.0 | 1,368 (+10%) | 1mo | $245,000 | $179 | 73 |
| 3940 Foster Dr | 0.43mi | 3/2.0 | 1,290 (+4%) | 11mo | $190,000 | $147 | 64 |
| 901 Drew Ct | 0.38mi | 3/2.0 | 1,137 (-8%) | 6mo | $190,000 | $167 | 63 |
| 3419 Sandystone Cir | 0.34mi | 3/2.5 | 1,369 (+10%) | 9mo | $207,000 | $151 | 57 |
| 698 Dowfield Dr | 0.59mi | 3/2.0 | 1,111 (-10%) | 3mo | $128,000 | $115 | 52 |
| 683 Dowfield Dr | 0.52mi | 3/2.0 | 1,066 (-14%) | 3mo | $175,999 | $165 | 50 |
| 722 Hilton Dr | 0.44mi | 3/1.5 | 1,054 (-15%) | 5mo | $137,000 | $130 | 48 |
| 780 Joefield Dr | 0.74mi | 3/2.0 | 1,405 (+13%) | 2mo | $228,000 | $162 | 42 |
| 693 Dowfield Dr | 0.55mi | 3/2.0 | 1,409 (+14%) | 14mo | $230,000 | $163 | 40 |
Match score weights: distance 35% · size 25% · config 20% · recency 20%. Top-matched comps best support the ARV.
Projected returns pro-forma
-3.0% appreciation · 2.82% rent growth · sell at horizon
- IRR
- -20.8%
- Equity multiple
- 0.28×
- Total profit
- $-37,975
- Equity at exit
- $28,031
- IRR
- -14.5%
- Equity multiple
- 0.17×
- Total profit
- $-43,463
- Equity at exit
- $16,255
Cash invested: $52,640 (down + closing). Projections, not guarantees.
Landlord ↔ Tenant lean methodology
- Overall (STATE)
- 85 Strongly Landlord-Friendly
- State North Carolina
- 85 Strongly Landlord-Friendly · R+3
- County
- — inherits STATE
- City
- — inherits STATE
ZIP-level market 28311
- Home prices YoY
- -18.4%
- Rents YoY
- 2.8%
- Active inventory
- 363
- Price-to-rent
- 10.7×
Monthly cashflow live
- Estimated rent
- $1,471 high interval (Pro) →
- Mortgage (P&I)
- −$986
- Tax from tax record
- −$212 /mo · $2,540/yr
- Insurance
- −$78
- HOA
- −$0
- Vacancy / Maint / Mgmt
- −$309
- Net cashflow
- $-114
Break-even live
Sensitivity live
| Price | -10% $-7 | -5% $-61 | +0% $-114 | +5% $-167 | +10% $-220 |
|---|---|---|---|---|---|
| Rent | -10% $-230 | -5% $-172 | +0% $-114 | +5% $-56 | +10% $2 |
| Rate | -1.0pp $-19 | -0.5pp $-66 | base $-114 | +0.5pp $-163 | +1.0pp $-212 |
UW: 25.0% down · 7.5% · 30yr · 1.5% tax · 5.0% vac · 8.0% maint · 8.0% mgmt
Financing live
Cash to close
- Down payment
- $47,000
- Closing costs
- $5,640
- Reserves months
- —
- Total cash needed
- —
Loan-product check · same deal, 3 products live
Conventional
25% down · 7.5% · 30yr
- Down + closing
- —
- Monthly P&I
- —
- Monthly cashflow
- —
- DSCR
- —
- Eligible?
- —
Personal DTI + credit; lowest rate.
DSCR
20% down · 8.5% · 30yr
- Down + closing
- —
- Monthly P&I
- —
- Monthly cashflow
- —
- DSCR
- —
- Eligible?
- —
No personal income docs; deal must DSCR.
Hard money
10% down · 12.0% · 12mo
- Down + closing
- —
- Monthly P&I
- —
- Monthly cashflow
- —
- DSCR
- —
- Eligible?
- —
Short-term bridge; refi at stabilization.
Rent comps 26 comps
| Address | Beds | Baths | Sqft | Rent | $/sqft | DOM | Units | Dist |
|---|---|---|---|---|---|---|---|---|
| 3523 Rosehill Rd Fayetteville, NC | 4.0 | 1.0 | 1448 | $1,450 | $1.00 | 15d | 1 | 0.25mi |
| 3613 Pine Lake Dr Fayetteville, NC | 1.0–3.0 | 1.0–2.0 | 1116 | $1,645 | $1.47 | 15d | 31 | 0.29mi |
| 3446 Sandystone Cir Fayetteville, NC | 3.0 | 2.5 | 1489 | $1,700 | $1.14 | 25d | 1 | 0.35mi |
| 848 Tamarack Dr Fayetteville, NC | 1.0–2.0 | 1.0 | 705 | $1,171 | $1.66 | 15d | 49 | 0.38mi |
| 3963 Loufield Dr Fayetteville, NC | 3.0 | 2.0 | 1446 | $1,500 | $1.04 | 25d | 1 | 0.47mi |
| 4202 S Dowfield Dr Fayetteville, NC | 2.0 | 1.0 | 800 | $930 | $1.16 | 25d | 1 | 0.55mi |
| 4206 S Dowfield Dr Fayetteville, NC | 2.0 | 1.0 | 900 | $895 | $0.99 | 25d | 1 | 0.55mi |
| 715 Ashburton Dr Fayetteville, NC | 3.0 | 2.0 | 1278 | $1,600 | $1.25 | 25d | 1 | 0.67mi |
| 909 Southview Cir Unit B Fayetteville, NC | 2.0 | 1.5 | 923 | $945 | $1.02 | 25d | 1 | 0.75mi |
| 733 Ashburton Dr Fayetteville, NC | 3.0 | 1.5 | 1118 | $1,300 | $1.16 | 25d | 1 | 0.77mi |
| 4310 Coolidge St Fayetteville, NC | 3.0 | 1.5 | 1212 | $1,250 | $1.03 | 15d | 1 | 0.83mi |
| 4736 Rosehill Rd Fayetteville, NC | 3.0 | 2.0 | 1000 | $1,240 | $1.24 | 25d | 1 | 0.88mi |
| 633 Elk Ct Fayetteville, NC | 2.0 | 1.5 | 1000 | $1,000 | $1.00 | 25d | 1 | 0.97mi |
| 927 Fiske Dr Fayetteville, NC | 3.0 | 1.0 | 926 | $1,200 | $1.30 | 25d | 1 | 1.19mi |
| 2523 Mulranny Dr Fayetteville, NC | 1.0–3.0 | 1.0–2.0 | 1112 | $1,589 | $1.43 | 15d | 9 | 1.22mi |
| 1216 Superior Pointe Pl Fayetteville, NC | 3.0 | 2.5 | 1288 | $1,450 | $1.13 | 25d | 1 | 1.22mi |
| 790 Arthington St Fayetteville, NC | 2.0 | 2.5 | 1000 | $1,350 | $1.35 | 25d | 1 | 1.23mi |
| 5523 Livingston Dr Fayetteville, NC | 4.0 | 1.5 | 1305 | $1,600 | $1.23 | 25d | 1 | 1.27mi |
| 318 Nugget Ct Fayetteville, NC | 4.0 | 2.0 | 1425 | $1,650 | $1.16 | 15d | 1 | 1.28mi |
| 4453 Oakmont Cir Fayetteville, NC | 3.0 | 1.0 | 1101 | $1,300 | $1.18 | 15d | 1 | 1.32mi |
| 319 Idlewild Dr Fayetteville, NC | 2.0 | 2.0–2.5 | 1080 | $1,340 | $1.24 | 15d | 9 | 1.42mi |
| 319 Idlewild Dr Fayetteville, NC | 2.0 | 2.0–2.5 | 1080 | $1,350 | $1.25 | 25d | 3 | 1.43mi |
| 2641 McArthur Landing Cir Fayetteville, NC | 3.0 | 2.0 | 1450 | $1,500 | $1.03 | 25d | 1 | 1.43mi |
| 2641 McArthur Landing Cir Fayetteville, NC | 3.0 | 2.0 | 1450 | $1,400 | $0.97 | 23d | 1 | 1.43mi |
| 2641 McArthur Landing Cir #102 Fayetteville, NC | 3.0 | 2.0 | 1400 | $1,375 | $0.98 | 25d | 1 | 1.43mi |
| 2500 McArthur Landing Cir Fayetteville, NC | 2.0–3.0 | 2.0 | 1226 | $1,420 | $1.16 | 15d | 13 | 1.49mi |
Listing history 25 events
-
2026-06-21days on market $188,000 Active 137 DOM
-
2026-06-18days on market $188,000 Active 134 DOM
-
2026-06-17days on market $188,000 Active 133 DOM
-
2026-06-16days on market $188,000 Active 132 DOM
-
2026-06-15days on market $188,000 Active 131 DOM
-
2026-06-14days on market $188,000 Active 129 DOM
-
2026-06-13pricedays on market $188,000 Active 128 DOM
-
2026-06-10days on market $190,000 Active 126 DOM
-
2026-06-09days on market $190,000 Active 125 DOM
-
2026-06-08days on market $190,000 Active 124 DOM
-
2026-06-07days on market $190,000 Active 123 DOM
-
2026-06-03days on market $190,000 Active 119 DOM
-
2026-06-02days on market $190,000 Active 118 DOM
-
2026-06-01days on market $190,000 Active 117 DOM
-
2026-05-31days on market $190,000 Active 116 DOM
-
2026-05-30days on market $190,000 Active 115 DOM
-
2026-05-14price $193,000
-
2026-04-23price $200,000
-
2026-04-09price $209,000
-
2026-03-26price $212,000
-
2026-03-05price $215,000
-
2026-02-12price $218,000
-
2026-02-04$225,000 Active
-
2026-01-23soldstatus $215,000
-
1989-07-31soldstatus $57,500
ⓘ Source: listings_history table (triggers on properties + properties_extension) + one-shot
backfill from property_details.listing_events for pre-trigger history.
Tax reassessment forecast NC · Resets to sale price
- Current annual tax
- $2,540 · $212/mo
- Projected year-2 tax
- $2,540 · $212/mo
- Expected delta
- $0/yr ($0/mo · 0.0%)
ⓘ Screening estimate from a state-policy table — verify with the county assessor before closing.
Climate risk First Street
- Flood 1/10 Low FEMA zone X (unshaded) · 0% chance over 30 yrs
- Wildfire 4/10 Moderate
- Heat 7/10 Severe 7 d/yr ≥105°F today · 16 d/yr by 30 yrs out
- Wind 7/10 Severe 78% chance of damaging wind over 30 yrs
- Air quality 2/10 Low 0 unhealthy d/yr today · 1 by 30 yrs out
Nearby sold comps map
Loading sold comps map…
Walkable amenities ~0.75 mi
Loading nearby amenities…
Taxation est. · year 1
- Rental income
- $17,650
- − Mortgage interest
- −$10,531
- − Property taxes
- −$2,540
- − Insurance
- −$940
- − Repairs & maintenance
- −$1,412
- − Management
- −$1,412
- − Depreciation
- −$5,469
- Taxable loss
- −$4,653
- Est. tax savings @ 24.0%
- +$1,117
- After-tax cash flow
- $-250/yr
For passive investors: Depreciation is non-cash, so a rental often shows a tax loss while cash-flowing — sheltering income. Rental losses are passive: they offset passive income freely, and up to $25,000/yr can offset ordinary (W-2) income if you actively participate and your MAGI is under $100k (phasing out to $0 by $150k); unused losses carry forward. On sale, claimed depreciation is recaptured at up to 25%, and gains may owe capital-gains tax (a 1031 exchange can defer both). Figures are a year-1 estimate at your 24.0% rate — not tax advice; consult a CPA.
Schools (NCES district)
- District
- Cumberland County Schools
- NCES district ID
- 3700011
- Math proficiency
- 32% ▼ -2.00%
- Reading proficiency
- 41% ▼ -1.00%
- Median HH income
- $44,168
- Composite
- 31.0/100
- National rank
- #6096
- State rank
- #126 of 178 in NC
Livability — Fayetteville
- Score
- 75/100
- State rank
- #45
- US rank
- #4031
Category grades
Schools grade is shown separately in the Schools card above.
Census & demographics
- Census place
- Fayetteville, NC
- County
- Cumberland County · 265,314 people
- City population
- 226,118
- Metro
- Fayetteville, NC
- Population (ZIP)
- 36,629
- Household income
- $62,170
- Rent vs Own
- Severe rent burden
- 1645.0
Population outlook (Cumberland County) Hauer SSP2
- Today (2025)
- 330,855 people
- By 2030
- 333,523 · +0.8%
- By 2040
- 335,583 · +1.4%
- By 2050
- 335,325 · +1.4%
- By 2075
- 342,853 · +3.6%
- By 2100
- 340,698 · +3.0%
Race, ethnicity, and origin ACS 2023
- Neighborhood character
- Diverse neighborhood (Simpson 0.67)
- Race & ethnicity
- Black 42% White 38% Hispanic / Latino 9% Two or more races 8% Asian 3% Native American 1%
- Hispanic origin (detail)
- Mexican 3% Puerto Rican 4%
- Common ancestry
- Slovak 1% Lithuanian 1% Italian 1%
- Foreign-born
- 7% · Canada, South Korea, Jamaica
- Languages at home
- 89% English-only · Spanish 6% German/W. Germanic 1% Other Indo-European 1%
Political lean MEDSL · Cumberland
- 2024 margin
- D (+13.4) · D 56.1% · R 42.7% · Other 1.2%
- 2008→2024 swing
- -4.3pp toward R · 2008: 17.7pp · 2024: 13.4pp
- All cycles
- 2024: D+13.4 2020: D+16.6 2016: D+16.0 2012: D+19.7 2008: D+17.7
Not yet ingested
- Civics
- —
Market trends
- HPI YoY
- ▼ -45.88%
- Current HPI
- 203.0731
- Rent YoY
- ▲ 2.82%
- Metro
- Fayetteville, NC
- State GDP YoY
- ▲ 3.28%
- F500 in state
- 26
Industry mix (Fortune 500 HQ in NC)
| Industry | F500 HQs | Revenue |
|---|---|---|
| Financial Services | 2 | $213B |
|
||
| Retail | 2 | $95B |
|
||
| Industrial Conglomerate | 1 | $38B |
|
||
| Metals / Steel | 1 | $35B |
|
||
| Utilities | 1 | $30B |
|
||
| Industrial Machinery | 1 | $19B |
|
||
Price history
+235.7% since first listed9 events — show timeline
- 2026-05-14 Price Changed $193,000 TMLS
- 2026-04-23 Price Changed $200,000 TMLS
- 2026-04-09 Price Changed $209,000 TMLS
- 2026-03-26 Price Changed $212,000 TMLS
- 2026-03-05 Price Changed $215,000 TMLS
- 2026-02-12 Price Changed $218,000 TMLS
- 2026-02-04 Listed $225,000 TMLS
- 2026-01-23 Sold (Public Records) $215,000 Public Records
- 1989-07-31 Sold (Public Records) $57,500 Public Records
Property tax history
+5.3%/yrLatest (2025): $2,540 · +24.6% YoY. Source: county tax records.
Cash-flow waterfall
monthlySold comps — $/sqft
last 12 mo · ≤1 miLoading sold comps…