 🏗️ New Construction
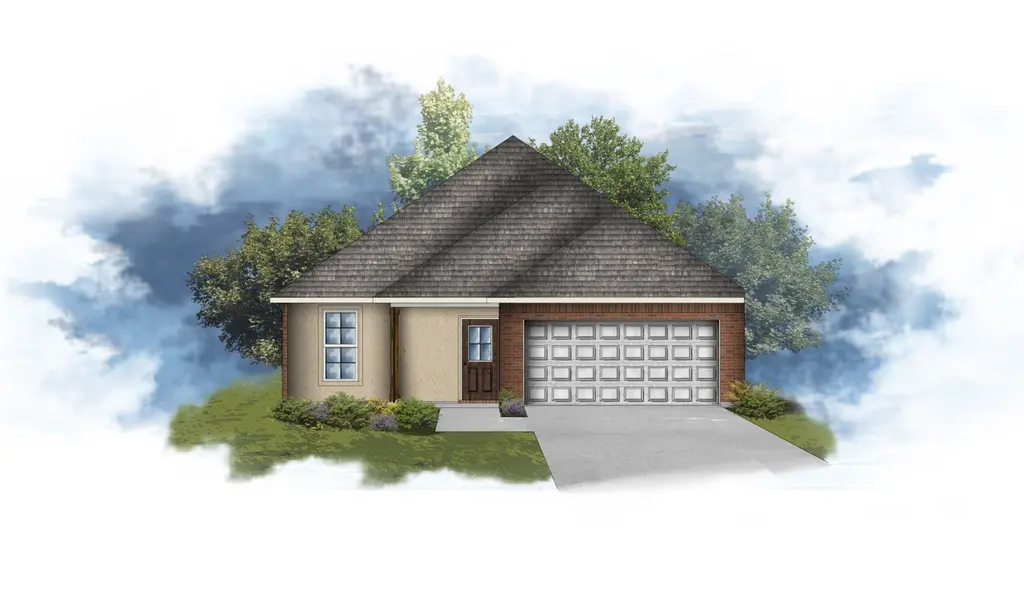
Welsburg II B Plan · Scott, LA
Flood risk No data
- FEMA flood zone
- —
- Chance of flooding over 30 yrs
- —
- Est. flood insurance / yr
- —
Fire risk No data
- Est. fire insurance / yr
- —
Heat risk No data
- Hot days now (above threshold)
- —
- Hot days in 30 yrs
- —
Wind risk No data
- Chance of severe wind over 30 yrs
- —
Air-quality risk No data
- Unhealthy air days now
- —
- Unhealthy air days in 30 yrs
- —
Risk factors via First Street. Map © Google.
Why this score? — see what drove the D grade
The composite is a weighted blend of 9 inputs, each scored 0–100. Each bar is that input's sub-score; the figure is the points it added to the 100-point composite (weight × sub-score).
- Cash flow +15.0/30.0
- ARV discount +7.5/15.0
- DSCR +4.6/10.0
- 1% rule +4.1/10.0
- Schools +3.6/10.0
- Livability +3.3/5.0
- Rent growth +2.5/5.0
- Condition / age +1.0/5.0
- Appreciation +0.0/10.0
$232,990
🖨 Deal sheet 📄 Offer letter ✓ Due diligence
Listing remarks MLS
Harvest Creek, located in Scott, Louisiana, is an idyllic community offering the perfect blend of small-town charm and modern conveniences. It provides easy access to top-rated schools such as Acadiana High, Scott Middle School, Westside Elementary, and St. Peter & Paul Catholic Elementary. Nestled in a prime location just a few minute's drive from Lafayette. Harvest Creek offers a unique combination of tranquility and comfort. Discover the vibrant traditions of Cajun Culture at Acadiana Village, a family-friendly hub for learning and exploration, a short 15-minute drive from Harvest Creek. This family-oriented neighborhood is designed with community living in mind, featuring spacious homes, safe streets, and beautiful landscaping. Our energy star certified homes have a range of features which include low e-tilt windows, R-15 wall insolation and R-38 insolation in the attic, a tankless gas water heater, stainless steel appliances, 3cm granite countertops with undermount sinks, and a post-tension slab. Experience peace of mind with DSLD Homes' comprehensive warranty coverage one year on the entirety of the home, two years for home systems, and five years for structural integrity. Your dream home is protected every step of the way. With its welcoming atmosphere, Harvest Creek is perfect for those looking to enjoy a peaceful yet vibrant lifestyle in a well-connected area.
Key facts
- Low e tilt windows
- Top rated schools
- Granite countertops
Tags
Neighborhood map
What this means for you Summary
Snapshot
- This is a 4-bed/2.0-bath single-family listed at $233k. Condition is rated poor.
Deal economics
- At list price, monthly cash flow is $76 ($908/yr) — positive.
- The deal already cash-flows at list — no discount required.
- To meet the 1% rule (rent ≥ 1% of price), the offer needs to be $229k (1.9% below list).
- Recommended offer: $205k (12.0% below list) — sets the bar for market timing.
- Cap rate 6.7% vs local median 4.7% in Scott — top-decile yield for the area; either an underpriced asset or a hidden risk that comps aren't pricing in. Stress-test before assuming the spread holds.
Location & tenants
- Location reads 66/100 on livability (#116 in LA) — a middle-class / working-renter tenant base. Strengths: cost of living A+, health & safety A+, schools B+; Watch: crime F, amenities F, commute F.
- Lafayette Parish (urban): math 38% / reading 46% proficiency, ranked #19 of 98 in LA (top 19%) — families likely to look elsewhere, expect single-tenant / working-renter base with shorter leases.
- Market conditions: 276 active listings in the ZIP; 3 comparable units currently listed for rent nearby; rentals leasing fast (median 14d on market — plan ~1-2 weeks tenant-placement turnaround); 1,585 units permitted in Lafayette Parish in 2024 (10 in 5+ unit buildings).
Forward outlook
- Local home prices are declining (-3.0%/yr); year-one equity from $2k of loan paydown is wiped out by about $8k of value loss. Plan a longer hold.
- Lafayette County population projected at +34% by 2050 — long-run rental-demand tailwind backs the buy-and-hold thesis.
Negotiation context
- It's been on market 429 days — a 12% lower offer ($205k) is reasonable based on typical stale-listing flexibility.
Questions for the listing agent
- It's been on market 429 days. Have you received any prior offers? Is the seller open to a 12% concession, seller financing, or rate buy-down credit?
- Have any recent inspections been done? Can we get a copy of the seller's disclosures and any deferred-maintenance estimates?
- Why hasn't it sold? Are there any deal-killer items the seller is aware of (foundation, flood, title, zoning, code violations)?
- Is there a deadline driving the sale (1031 exchange, divorce, estate, relocation)? That informs how much negotiation room exists.
- Schools are B-rated — typically a magnet for longer-tenancy family renters. What's the average tenant stay here, and is there a school-zone premium baked into asking?
- Crime grade is F in this area — have there been break-ins, vandalism, or insurance claims at this property in the last 3 years? What carrier currently insures it and at what premium?
- The area grade is low — what's the realistic commute time and amenity access for the typical tenant pool here? Any planned neighborhood developments (good or bad) we should know about?
- What's the average days-on-market for RENTAL listings here right now (not sales)? A rising rental-DOM trend means longer vacancies and softer asking-rent achievability than the comps imply.
- What's the recent tenant-quality profile in this submarket — average credit score on applications, eviction rate, late-payment / NSF rate, and stable-employment percentage? A property-management company in the area should have these aggregated.
- How much new for-sale + rental construction is in the pipeline within 1–3 miles? Heavy new supply typically softens prices + rents 12–24 months out; constrained supply supports both.
Investment metrics
- 1% rule
- 0.91% ✗
- Cap rate
- 6.66%
- Cash-on-cash
- 1.30%
- DSCR
- 1.06
- GRM
- 9.1
CMA / ARV
- ARV (median comp)
- $250,319
- List price
- $232,990
- Delta
- -6.92%
- Verdict
- FAIR
- Comps
- 20 within 1.0 mi
Show comp detail 12 sales within ~0.75 mi
| Address | Dist | Beds/Ba | Sqft | Sold | Price | $/sf | Match |
|---|---|---|---|---|---|---|---|
| 102 Pine Harvest Ln | 0.04mi | 3/2.0 (-1) | 1,538 (-2%) | 2mo | $234,265 | $152 | 89 |
| 123 Pine Harvest Ln | 0.03mi | 3/2.0 (-1) | 1,495 (-5%) | 4mo | $228,220 | $153 | 82 |
| 121 Pine Harvest Ln | 0.04mi | 3/2.0 (-1) | 1,750 (+12%) | 3mo | $249,375 | $143 | 72 |
| 211 Nandina Dr | 0.53mi | 3/2.0 (-1) | 1,495 (-5%) | 0mo | $231,321 | $155 | 62 |
| 216 Keystone Dr | 0.67mi | 3/2.0 (-1) | 1,559 (-1%) | 6mo | $329,000 | $211 | 58 |
| 109 Nandina Dr | 0.73mi | 3/2.0 (-1) | 1,601 (+2%) | 5mo | $235,790 | $147 | 53 |
| 126 Crooked Pine Ln | 0.68mi | 3/2.0 (-1) | 1,519 (-3%) | 6mo | $303,000 | $199 | 53 |
| 200 Nandina Dr | 0.53mi | 3/2.0 (-1) | 1,735 (+11%) | 1mo | $255,956 | $148 | 51 |
| 212 Nandina Dr | 0.53mi | 3/2.0 (-1) | 1,735 (+11%) | 6mo | $250,450 | $144 | 47 |
| 111 Nandina Dr | 0.73mi | 3/2.0 (-1) | 1,689 (+8%) | 2mo | $245,664 | $145 | 46 |
| 149 Fremont Dr | 0.61mi | 3/2.0 (-1) | 1,420 (-9%) | 6mo | $176,000 | $124 | 46 |
| 204 Keystone Dr | 0.67mi | 3/2.0 (-1) | 1,346 (-14%) | 2mo | $309,000 | $230 | 39 |
Match score weights: distance 35% · size 25% · config 20% · recency 20%. Top-matched comps best support the ARV.
Projected returns pro-forma
-3.0% appreciation · 3.0% rent growth · sell at horizon
- IRR
- -14.2%
- Equity multiple
- 0.49×
- Total profit
- $-35,710
- Equity at exit
- $37,323
- IRR
- -5.4%
- Equity multiple
- 0.65×
- Total profit
- $-24,752
- Equity at exit
- $21,643
Cash invested: $70,089 (down + closing). Projections, not guarantees.
Landlord ↔ Tenant lean methodology
- Overall (STATE)
- 90 Strongly Landlord-Friendly
- State Louisiana
- 90 Strongly Landlord-Friendly · R+12
- County
- — inherits STATE
- City
- — inherits STATE
ZIP-level market 70583
- Active inventory
- 276
- Price-to-rent
- 8.5×
Monthly cashflow live
- Estimated rent
- $2,285 medium interval (Pro) →
- Mortgage (P&I)
- −$1,313
- Tax est. 1.5%
- −$313 /mo · $3,755/yr
- Insurance
- −$104
- HOA
- −$0
- Vacancy / Maint / Mgmt
- −$480
- Net cashflow
- $76
Break-even live
UW: 25.0% down · 7.5% · 30yr · 1.5% tax · 5.0% vac · 8.0% maint · 8.0% mgmt
Financing live
Cash to close
- Down payment
- $62,580
- Closing costs
- $7,510
- Reserves months
- —
- Total cash needed
- —
Loan-product check · same deal, 3 products live
Conventional
25% down · 7.5% · 30yr
- Down + closing
- —
- Monthly P&I
- —
- Monthly cashflow
- —
- DSCR
- —
- Eligible?
- —
Personal DTI + credit; lowest rate.
DSCR
20% down · 8.5% · 30yr
- Down + closing
- —
- Monthly P&I
- —
- Monthly cashflow
- —
- DSCR
- —
- Eligible?
- —
No personal income docs; deal must DSCR.
Hard money
10% down · 12.0% · 12mo
- Down + closing
- —
- Monthly P&I
- —
- Monthly cashflow
- —
- DSCR
- —
- Eligible?
- —
Short-term bridge; refi at stabilization.
Rent comps 3 comps
| Address | Beds | Baths | Sqft | Rent | $/sqft | DOM | Units | Dist |
|---|---|---|---|---|---|---|---|---|
| 128 Oak Village Dr Scott, LA | 3.0 | 2.0 | 1445 | $2,450 | $1.70 | 13d | 1 | 0.81mi |
| 1313 Apollo Rd Scott, LA | 1.0–3.0 | 1.0–2.0 | 1100 | $2,000 | $1.82 | 13d | 10 | 1.01mi |
| 401 Pinto St Lafayette, LA | 3.0 | 2.0 | 1601 | $2,300 | $1.44 | 43d | 1 | 1.20mi |
Listing history 17 events
-
2026-06-18days on market $232,990 Active 429 DOM
-
2026-06-17days on market $232,990 Active 428 DOM
-
2026-06-16days on market $232,990 Active 427 DOM
-
2026-06-15days on market $232,990 Active 426 DOM
-
2026-06-14days on market $232,990 Active 424 DOM
-
2026-06-13days on market $232,990 Active 423 DOM
-
2026-06-10days on market $232,990 Active 421 DOM
-
2026-06-09days on market $232,990 Active 420 DOM
-
2026-06-08days on market $232,990 Active 419 DOM
-
2026-06-07days on market $232,990 Active 418 DOM
-
2026-06-05days on market $232,990 Active 415 DOM
-
2026-06-03days on market $232,990 Active 414 DOM
-
2026-06-02days on market $232,990 Active 413 DOM
-
2026-06-01days on market $232,990 Active 412 DOM
-
2026-05-31days on market $232,990 Active 411 DOM
-
2026-05-30days on market $232,990 Active 410 DOM
-
2025-04-16$232,990 Active 1397-char remark
Show marketing remark (1397 chars)
Harvest Creek, located in Scott, Louisiana, is an idyllic community offering the perfect blend of small-town charm and modern conveniences. It provides easy access to top-rated schools such as Acadiana High, Scott Middle School, Westside Elementary, and St. Peter & Paul Catholic Elementary. Nestled in a prime location just a few minute's drive from Lafayette. Harvest Creek offers a unique combination of tranquility and comfort. Discover the vibrant traditions of Cajun Culture at Acadiana Village, a family-friendly hub for learning and exploration, a short 15-minute drive from Harvest Creek. This family-oriented neighborhood is designed with community living in mind, featuring spacious homes, safe streets, and beautiful landscaping. Our energy star certified homes have a range of features which include low e-tilt windows, R-15 wall insolation and R-38 insolation in the attic, a tankless gas water heater, stainless steel appliances, 3cm granite countertops with undermount sinks, and a post-tension slab. Experience peace of mind with DSLD Homes' comprehensive warranty coverage one year on the entirety of the home, two years for home systems, and five years for structural integrity. Your dream home is protected every step of the way. With its welcoming atmosphere, Harvest Creek is perfect for those looking to enjoy a peaceful yet vibrant lifestyle in a well-connected area.
ⓘ Source: listings_history table (triggers on properties + properties_extension) + one-shot
backfill from property_details.listing_events for pre-trigger history.
Nearby sold comps map
Loading sold comps map…
Walkable amenities ~0.75 mi
Loading nearby amenities…
Taxation est. · year 1
- Rental income
- $27,426
- − Mortgage interest
- −$14,022
- − Property taxes
- −$3,755
- − Insurance
- −$1,252
- − Repairs & maintenance
- −$2,194
- − Management
- −$2,194
- − Depreciation
- −$7,282
- Taxable loss
- −$3,272
- Est. tax savings @ 24.0%
- +$785
- After-tax cash flow
- $1,693/yr
For passive investors: Depreciation is non-cash, so a rental often shows a tax loss while cash-flowing — sheltering income. Rental losses are passive: they offset passive income freely, and up to $25,000/yr can offset ordinary (W-2) income if you actively participate and your MAGI is under $100k (phasing out to $0 by $150k); unused losses carry forward. On sale, claimed depreciation is recaptured at up to 25%, and gains may owe capital-gains tax (a 1031 exchange can defer both). Figures are a year-1 estimate at your 24.0% rate — not tax advice; consult a CPA.
Condition & rehab AI · 3 photos
This home requires extensive repairs and maintenance, including new siding, roof, and landscaping. Significant improvements are needed to increase its resale and rental value.
Repairs flagged
- Major exterior siding — The siding is visibly damaged and in need of replacement.
- Major roof — The roof shows significant wear and potential structural issues.
- Major landscaping — The landscaping is overgrown and in need of maintenance.
Value-add opportunities
- Resale exterior siding replacement — A new exterior siding will significantly improve the home's curb appeal and increase its resale value.
- Resale roof repair/replacement — A new roof will address the structural issues and improve the home's overall condition, enhancing its resale value.
- Both landscaping — A well-maintained and aesthetically pleasing landscape will improve the home's curb appeal and increase both resale and rental value.
Renovation cost estimate screening
| Repair item | Severity | Est. cost |
|---|---|---|
| exterior siding · The siding is visibly damaged and in need of replacement. | Major | $15,000–50,000 |
| roof · The roof shows significant wear and potential structural issues. | Major | $15,000–50,000 |
| landscaping · The landscaping is overgrown and in need of maintenance. | Major | $15,000–50,000 |
| Total estimated repair cost · 3 items | $45,000–150,000 |
Value-add ROI direction
- Resale exterior siding replacement — A new exterior siding will significantly improve the home's curb appeal and increase its resale value. ↑
- Resale roof repair/replacement — A new roof will address the structural issues and improve the home's overall condition, enhancing its resale value. ↑
- Both landscaping — A well-maintained and aesthetically pleasing landscape will improve the home's curb appeal and increase both resale and rental value. ↑
ⓘ Cost ranges are severity-bucket heuristics (US national rule-of-thumb). Get contractor quotes + a written scope before underwriting a rehab budget.
Schools (NCES district)
- District
- Lafayette Parish
- NCES district ID
- 2200870
- Math proficiency
- 38% ▼ -32.00%
- Reading proficiency
- 46% ▼ -24.00%
- Median HH income
- $50,238
- Composite
- 36.15/100
- National rank
- #4741
- State rank
- #19 of 98 in LA
Livability — Scott
- Score
- 66/100
- State rank
- #116
- US rank
- #11265
Category grades
Schools grade is shown separately in the Schools card above.
Census & demographics
- Census place
- Scott, LA
- City population
- 8,670
- Population (ZIP)
- 8,670
Population outlook (Lafayette County) Hauer SSP2
- Today (2025)
- 280,930 people
- By 2030
- 301,092 · +7.2%
- By 2040
- 339,456 · +20.8%
- By 2050
- 375,156 · +33.5%
- By 2075
- 451,672 · +60.8%
- By 2100
- 497,203 · +77.0%
Race, ethnicity, and origin ACS 2023
- Neighborhood character
- Predominantly White (68%)
- Race & ethnicity
- White 68% Hispanic / Latino 16% Black 13% Two or more races 11%
- Hispanic origin (detail)
- Mexican 7% Cuban 2%
- Common ancestry
- Lithuanian 11% Slovak 3% Italian 1%
- Foreign-born
- 11% · Canada
- Languages at home
- 81% English-only · Spanish 12% French/Haitian/Cajun 7%
Political lean MEDSL · Lafayette
- 2024 margin
- Solid R (+31.4) · D 33.5% · R 64.8% · Other 1.7%
- 2008→2024 swing
- -0.1pp no change · 2008: -31.3pp · 2024: -31.4pp
- All cycles
- 2024: R+31.4 2020: R+28.7 2016: R+33.6 2012: R+33.7 2008: R+31.3
Not yet ingested
- Civics
- —
Market trends
- HPI YoY
- ▼ -84.03%
- Current HPI
- 132.4083
- Rent YoY
- —
- Metro
- —
- State GDP YoY
- ▲ 3.29%
- F500 in state
- 10
Industry mix (Fortune 500 HQ in LA)
| Industry | F500 HQs | Revenue |
|---|---|---|
| Telecommunications | 2 | $23B |
|
||
| Utilities | 1 | $12B |
|
||
| Wholesale / Distribution | 1 | $5B |
|
||
| Advertising | 1 | $2B |
|
||
Price history
1 event — show timeline
- 2025-04-16 Listed $232,990 Zillow
Cash-flow waterfall
monthlySold comps — $/sqft
last 12 mo · ≤1 miLoading sold comps…