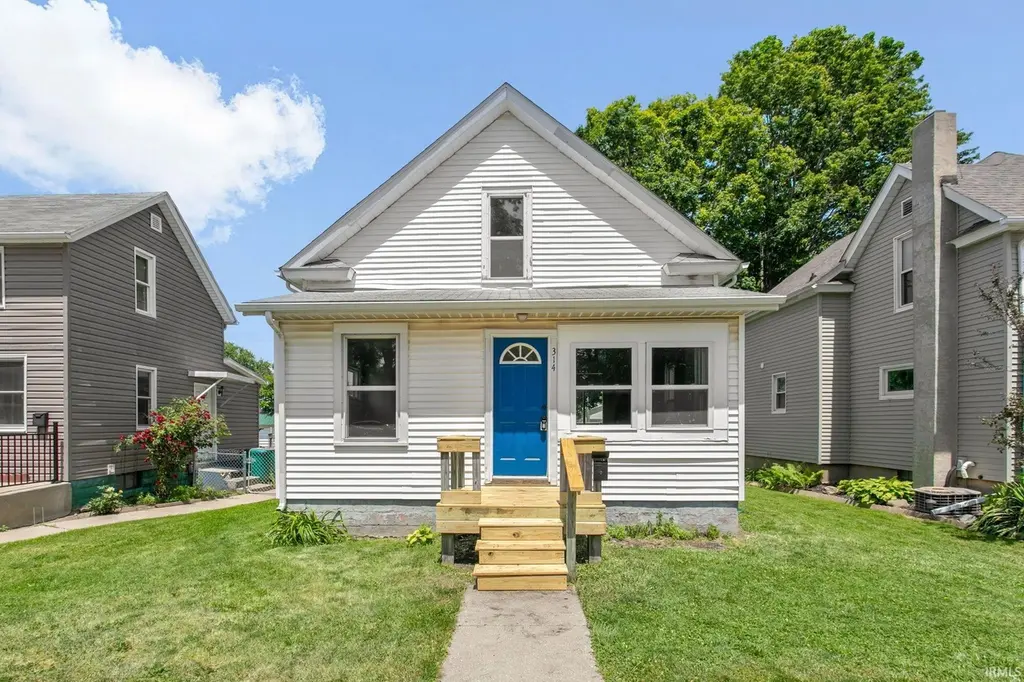
314 E 13th St · Mishawaka, IN
Flood risk 1/10 · Minimal
- FEMA flood zone
- X (unshaded)
- Chance of flooding over 30 yrs
- 0.0%
- Est. flood insurance / yr
- $473 – $860
Fire risk 1/10 · Minimal
- Est. fire insurance / yr
- $717 – $1,331
Heat risk 3/10 · Minor
- Hot days now (above 100°F)
- 7 days/yr
- Hot days in 30 yrs
- 16 days/yr
Wind risk 2/10 · Minimal
- Chance of severe wind over 30 yrs
- —
Air-quality risk 3/10 · Minor
- Unhealthy air days now
- 2 days/yr
- Unhealthy air days in 30 yrs
- 3 days/yr
Risk factors via First Street. Map © Google.
Why this score? — see what drove the C+ grade
The composite is a weighted blend of 9 inputs, each scored 0–100. Each bar is that input's sub-score; the figure is the points it added to the 100-point composite (weight × sub-score).
- Cash flow +22.9/30.0
- ARV discount +15.0/15.0
- DSCR +7.3/10.0
- 1% rule +5.4/10.0
- Rent growth +4.8/5.0
- Livability +3.8/5.0
- Condition / age +2.5/5.0
- Schools +2.2/10.0
- Appreciation +0.0/10.0
$159,900
🖨 Deal sheet 📄 Offer letter ✓ Due diligence
Listing remarks
Roomy one-and-a-half-story home in the desirable Mishawaka School District is move-in ready with fresh paint and a clean interior. This charming property offers plenty of kitchen cabinetry, generous dining space, and includes kitchen appliances. The functional floor plan features 4 spacious bedrooms, with one offering flexibility as a home office or guest room. Relax on the back porch this season and enjoy outdoor entertaining and barbeques in the private backyard. Conveniently located near schools, shopping, and local amenities. Additional highlights include a detached two-car garage, great curb appeal, and immediate possession opportunity. . Buyer to verify taxes, schools, room sizes (sq.
Key facts
- Kitchen cabinetry
- Kitchen appliances
- Private backyard
Tags
Property features AI
Exterior
- Parking: Detached 2-car garage
- Security: Smoke detectors; Carbon monoxide detectors
- Utilities: Public water; Public sewer
- Home design: Single-family residence; Site-built home; 1 story
- Construction: Vinyl siding; Block foundation; Asphalt shingle roof; Built as site-built construction
- Exterior features: Deck; Full wood fencing; Level lot
Interior
- Kitchen: Refrigerator; Gas oven; Gas range
- Flooring: Laminate flooring; Vinyl flooring
- Bathrooms: 1 full bathroom
- Heating & cooling: Natural gas heating; Central air conditioning; Ceiling fan(s) for cooling
- Interior features: Ceiling fans; Eat-in kitchen; Laminate countertops
- Laundry & utility: Washer and dryer (dryer listed); Laundry in basement; Gas water heater
Neighborhood map
What this means for you Summary
Snapshot
- This is a 4-bed/1.0-bath single-family listed at $160k.
Deal economics
- At list price, monthly cash flow is $280 ($3k/yr) — positive.
- The deal already cash-flows at list — no discount required.
- Meets the 1% rule at list price ($2k rent vs $160k).
- Cap rate 8.4% vs local median 5.3% in Mishawaka — top-decile yield for the area; either an underpriced asset or a hidden risk that comps aren't pricing in. Stress-test before assuming the spread holds.
Location & tenants
- Location reads 76/100 on livability (#53 in IN, #3,586 nationally) — a middle-class / working-renter tenant base. Strengths: cost of living A+, housing A+, health & safety B; Watch: amenities F, employment F.
- School City Of Mishawaka (urban): math 23% / reading 30% proficiency, ranked #260 of 301 in IN (top 86%) — low school quality limits family demand, transient renter base, plan for 1-2y turnover.
- Zoned schools: Emmons Elementary School (math 14% / reading 14%, grade F, #874 of 994 statewide, top 89%, 435 students, 87% FRL); John J Young Middle School (math 17% / reading 30%, grade F, #257 of 330 statewide, top 79%, 735 students, 74% FRL); Mishawaka High School (math 24% / reading 60%, grade F, #197 of 369 statewide, top 57%, 1,488 students, 65% FRL) — zoned schools average 75% FRL vs 54% district-wide (21 pts higher); higher-poverty schools than district average — tighter screening recommended.
- Market conditions: Rents rising fast (+9.1%/yr); 140 active listings in the ZIP; 5 comparable units currently listed for rent nearby; rentals leasing fast (median 13d on market — plan ~1-2 weeks tenant-placement turnaround); 754 units permitted in St. Joseph County in 2024 (460 in 5+ unit buildings).
- This rent runs 34% of the median local income ($59k/yr) — at the standard rent-burdened threshold; future hikes will face affordability resistance.
Forward outlook
- Local home prices are declining (-3.0%/yr); year-one equity from $1k of loan paydown is wiped out by about $5k of value loss. Plan a longer hold.
- At projected returns (-3.0% appreciation + 8.0% rent growth), your $45k cash investment doubles in ~9 years — after that, you're playing with house money.
Negotiation context
- Only 4 days on market — expect competitive offers; lowballing is unlikely to land.
Risks & watch-outs
- Watch-outs: built in 1900 — expect roof / HVAC / electrical / plumbing capex.
Questions for the listing agent
- Built in 1900 — when were the roof, HVAC, electrical panel, plumbing, and water heater last replaced?
- Is there a deadline driving the sale (1031 exchange, divorce, estate, relocation)? That informs how much negotiation room exists.
- What's the average days-on-market for RENTAL listings here right now (not sales)? A rising rental-DOM trend means longer vacancies and softer asking-rent achievability than the comps imply.
- What's the recent tenant-quality profile in this submarket — average credit score on applications, eviction rate, late-payment / NSF rate, and stable-employment percentage? A property-management company in the area should have these aggregated.
- How much new for-sale + rental construction is in the pipeline within 1–3 miles? Heavy new supply typically softens prices + rents 12–24 months out; constrained supply supports both.
Investment metrics
- 1% rule
- 1.04% ✓
- Cap rate
- 8.40%
- Cash-on-cash
- 7.52%
- DSCR
- 1.33
- GRM
- 8.0
CMA / ARV
- ARV (on-the-fly)
- $199,472
- Comps found
- 12
Show comp detail 12 sales within ~0.75 mi
| Address | Dist | Beds/Ba | Sqft | Sold | Price | $/sf | Match |
|---|---|---|---|---|---|---|---|
| 1417 Union St | 0.18mi | 4/1.0 | 1,412 (-3%) | 1mo | $90,200 | $64 | 86 |
| 131 E 6th St | 0.40mi | 3/2.0 (-1) | 1,460 (+0%) | 1mo | $217,500 | $149 | 71 |
| 615 E 15th St | 0.32mi | 3/1.0 (-1) | 1,506 (+3%) | 5mo | $175,000 | $116 | 70 |
| 304 E 8th St | 0.30mi | 4/1.0 | 1,672 (+15%) | 3mo | $181,000 | $108 | 59 |
| 402 W 7th St | 0.51mi | 4/2.0 | 1,342 (-8%) | 2mo | $200,850 | $150 | 57 |
| 820 Lovechio Dr | 0.59mi | 4/2.5 | 1,520 (+4%) | 5mo | $249,900 | $164 | 55 |
| 816 E 8th St | 0.58mi | 3/1.5 (-1) | 1,532 (+5%) | 6mo | $210,000 | $137 | 53 |
| 232 E 7th St | 0.36mi | 3/1.0 (-1) | 1,250 (-14%) | 3mo | $164,300 | $131 | 52 |
| 523 W 6th St | 0.62mi | 3/1.5 (-1) | 1,344 (-8%) | 2mo | $163,000 | $121 | 50 |
| 731 E 6th St | 0.57mi | 3/1.5 (-1) | 1,280 (-12%) | 5mo | $166,500 | $130 | 42 |
| 731 Steeplechase Dr | 0.65mi | 4/2.0 | 1,624 (+12%) | 6mo | $270,000 | $166 | 41 |
| 813 Lovechio Dr | 0.59mi | 3/2.0 (-1) | 1,620 (+11%) | 4mo | $255,000 | $157 | 41 |
Match score weights: distance 35% · size 25% · config 20% · recency 20%. Top-matched comps best support the ARV.
Projected returns pro-forma
-3.0% appreciation · 8.0% rent growth · sell at horizon
- IRR
- 0.4%
- Equity multiple
- 1.02×
- Total profit
- $717
- Equity at exit
- $23,842
- IRR
- 14.4%
- Equity multiple
- 2.42×
- Total profit
- $63,539
- Equity at exit
- $13,825
Cash invested: $44,772 (down + closing). Projections, not guarantees.
Landlord ↔ Tenant lean methodology
- Overall (STATE)
- 90 Strongly Landlord-Friendly
- State Indiana
- 90 Strongly Landlord-Friendly · R+11
- County
- — inherits STATE
- City
- — inherits STATE
ZIP-level market 46544
- Rents YoY
- 9.1%
- Active inventory
- 140
- Price-to-rent
- 8.0×
Monthly cashflow live
- Estimated rent
- $1,663 high interval (Pro) →
- Mortgage (P&I)
- −$839
- Tax from tax record
- −$128 /mo · $1,536/yr
- Insurance
- −$67
- HOA
- −$0
- Vacancy / Maint / Mgmt
- −$349
- Net cashflow
- $280
Break-even live
UW: 25.0% down · 7.5% · 30yr · 1.5% tax · 5.0% vac · 8.0% maint · 8.0% mgmt
Financing live
Cash to close
- Down payment
- $39,975
- Closing costs
- $4,797
- Reserves months
- —
- Total cash needed
- —
Loan-product check · same deal, 3 products live
Conventional
25% down · 7.5% · 30yr
- Down + closing
- —
- Monthly P&I
- —
- Monthly cashflow
- —
- DSCR
- —
- Eligible?
- —
Personal DTI + credit; lowest rate.
DSCR
20% down · 8.5% · 30yr
- Down + closing
- —
- Monthly P&I
- —
- Monthly cashflow
- —
- DSCR
- —
- Eligible?
- —
No personal income docs; deal must DSCR.
Hard money
10% down · 12.0% · 12mo
- Down + closing
- —
- Monthly P&I
- —
- Monthly cashflow
- —
- DSCR
- —
- Eligible?
- —
Short-term bridge; refi at stabilization.
Rent comps 5 comps
| Address | Beds | Baths | Sqft | Rent | $/sqft | DOM | Units | Dist |
|---|---|---|---|---|---|---|---|---|
| 642 E 11th St Mishawaka, IN | 3.0 | 1.0 | 1248 | $1,295 | $1.04 | 20d | 1 | 0.34mi |
| 211 Columbia St Mishawaka, IN | 4.0 | 2.5 | 1500 | $1,795 | $1.20 | 20d | 1 | 1.07mi |
| 116 W Mishawaka Ave Mishawaka, IN | 3.0 | 1.0–2.0 | 948 | $2,321 | $2.45 | 13d | 31 | 1.10mi |
| 232 E Grove St Mishawaka, IN | 3.0 | 1.0 | 1188 | $1,500 | $1.26 | 13d | 1 | 1.12mi |
| 1434 Fallcreek Dr Mishawaka, IN | 2.0–3.0 | 1.0–2.0 | 1176 | $1,529 | $1.30 | 13d | 1 | 1.34mi |
Listing history 5 events
-
2026-06-10status $159,900 Pending 4 DOM
-
2026-06-09days on market $159,900 Active 4 DOM
-
2026-06-08days on market $159,900 Active 3 DOM
-
2026-06-07remarks 699-char remark
-
2026-06-07$159,900 Active 2 DOM
ⓘ Source: listings_history table (triggers on properties + properties_extension) + one-shot
backfill from property_details.listing_events for pre-trigger history.
Tax reassessment forecast IN · Partial reset (capped growth)
- Current annual tax
- $1,536 · $128/mo
- Projected year-2 tax
- $1,536 · $128/mo
- Expected delta
- $0/yr ($0/mo · 0.0%)
ⓘ Screening estimate from a state-policy table — verify with the county assessor before closing.
Climate risk First Street
- Flood 1/10 Low FEMA zone X (unshaded) · 0% chance over 30 yrs
- Wildfire 1/10 Low
- Heat 3/10 Moderate 7 d/yr ≥100°F today · 16 d/yr by 30 yrs out
- Wind 2/10 Low
- Air quality 3/10 Moderate 2 unhealthy d/yr today · 3 by 30 yrs out
Nearby sold comps map
Loading sold comps map…
Walkable amenities ~0.75 mi
Loading nearby amenities…
Taxation est. · year 1
- Rental income
- $19,953
- − Mortgage interest
- −$8,957
- − Property taxes
- −$1,536
- − Insurance
- −$800
- − Repairs & maintenance
- −$1,596
- − Management
- −$1,596
- − Depreciation
- −$4,652
- Taxable income
- $816
- Est. tax owed @ 24.0%
- −$196
- After-tax cash flow
- $3,169/yr
For passive investors: Depreciation is non-cash, so a rental often shows a tax loss while cash-flowing — sheltering income. Rental losses are passive: they offset passive income freely, and up to $25,000/yr can offset ordinary (W-2) income if you actively participate and your MAGI is under $100k (phasing out to $0 by $150k); unused losses carry forward. On sale, claimed depreciation is recaptured at up to 25%, and gains may owe capital-gains tax (a 1031 exchange can defer both). Figures are a year-1 estimate at your 24.0% rate — not tax advice; consult a CPA.
Schools (NCES district)
- District
- School City Of Mishawaka
- NCES district ID
- 1806840
- Math proficiency
- 23% ▼ -9.00%
- Reading proficiency
- 30% ▼ -7.00%
- Median HH income
- $39,290
- Composite
- 22.26/100
- National rank
- #8143
- State rank
- #260 of 301 in IN
Livability — Mishawaka
- Score
- 76/100
- State rank
- #53
- US rank
- #3586
Category grades
Schools grade is shown separately in the Schools card above.
Census & demographics
- Census place
- Mishawaka, IN
- County
- Saint Joseph County · 189,048 people
- City population
- 57,683
- Metro
- South Bend-Mishawaka, IN-MI
- Population (ZIP)
- 31,077
- Household income
- $58,829
- Rent vs Own
- Severe rent burden
- 685.0
Population outlook (St. Joseph County) Hauer SSP2
- Today (2025)
- 273,186 people
- By 2030
- 273,594 · +0.1%
- By 2040
- 271,641 · -0.6%
- By 2050
- 269,187 · -1.5%
- By 2075
- 263,136 · -3.7%
- By 2100
- 245,659 · -10.1%
Race, ethnicity, and origin ACS 2023
- Neighborhood character
- Predominantly White (79%)
- Race & ethnicity
- White 79% Black 9% Two or more races 7% Hispanic / Latino 6% Asian 1%
- Hispanic origin (detail)
- Mexican 5%
- Common ancestry
- Romanian 7% English 3% Lithuanian 2%
- Foreign-born
- 4% · Canada, Vietnam
- Languages at home
- 94% English-only · Spanish 3%
Political lean MEDSL · St. Joseph
- 2024 margin
- Toss-up / Even · D 50.0% · R 48.5% · Other 1.5%
- 2008→2024 swing
- -15.6pp toward R · 2008: 17.1pp · 2024: 1.5pp
- All cycles
- 2024: D+1.5 2020: D+5.8 2016: D+0.2 2012: D+3.5 2008: D+17.1
Not yet ingested
- Civics
- —
Market trends
- HPI YoY
- ▼ -116.74%
- Current HPI
- 188.9996
- Rent YoY
- ▲ 9.10%
- Metro
- South Bend-Mishawaka, IN-MI
- State GDP YoY
- ▲ 2.90%
- F500 in state
- 18
Industry mix (Fortune 500 HQ in IN)
| Industry | F500 HQs | Revenue |
|---|---|---|
| Industrial Machinery | 2 | $37B |
|
||
| Healthcare | 1 | $177B |
|
||
| Pharmaceuticals | 1 | $45B |
|
||
| Metals / Steel | 1 | $18B |
|
||
| Agriculture | 1 | $17B |
|
||
| Packaging | 1 | $12B |
|
||
Price history
1 event — show timeline
- 2026-06-05 Listed $159,900 IRMLS
Property tax history
-5.8%/yrLatest (2024): $1,536 · -1.0% YoY. Source: county tax records.
Cash-flow waterfall
monthlySold comps — $/sqft
last 12 mo · ≤1 miLoading sold comps…