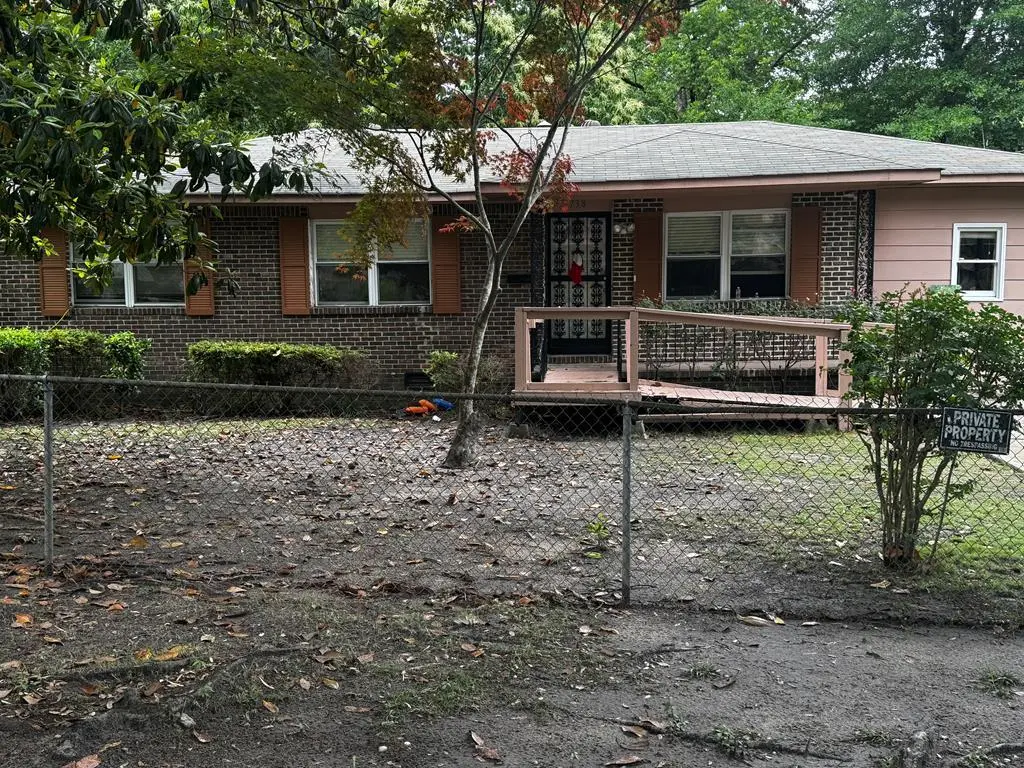
738 Asa Dr · Columbus, GA
Flood risk 6/10 · Moderate
- FEMA flood zone
- X (unshaded)
- Chance of flooding over 30 yrs
- 0.75%
- Est. flood insurance / yr
- $507 – $1,088
Fire risk 3/10 · Minor
- Est. fire insurance / yr
- $963 – $1,789
Heat risk 7/10 · Major
- Hot days now (above 107°F)
- 7 days/yr
- Hot days in 30 yrs
- 19 days/yr
Wind risk 6/10 · Moderate
- Chance of severe wind over 30 yrs
- 76.0%
Air-quality risk 4/10 · Minor
- Unhealthy air days now
- 5 days/yr
- Unhealthy air days in 30 yrs
- 6 days/yr
Risk factors via First Street. Map © Google.
Why this score? — see what drove the B+ grade
The composite is a weighted blend of 9 inputs, each scored 0–100. Each bar is that input's sub-score; the figure is the points it added to the 100-point composite (weight × sub-score).
- Cash flow +30.0/30.0
- ARV discount +15.0/15.0
- DSCR +10.0/10.0
- 1% rule +9.9/10.0
- Rent growth +3.7/5.0
- Livability +3.2/5.0
- Condition / age +2.5/5.0
- Schools +2.2/10.0
- Appreciation +0.0/10.0
$90,000
🖨 Deal sheet (PDF) 📄 Offer letter ✓ Due diligence
Listing remarks
Investor special or perfect opportunity for a buyer looking to add their personal touch! This 3 bedroom, 2 bathroom home at 738 Asa Dr in Columbus offers solid potential with a functional layout, spacious yard, and convenient location close to shopping, schools, and Fort Benning. The property is being sold AS IS and will need a little TLC, making it ideal for investors, flippers, or buyers wanting to build equity. With some updates and vision, this home could truly shine. Don't miss the chance to turn this property into something special!
Key facts
- Spacious yard
- Close to schools
- Convenient location
Tags
Property features AI
Finance
- Other: Listing broker: Coldwell Banker / Kennon, Parker, Duncan & Davis; Listing agent: Arrio Granum
Exterior
- Utilities: Public water; Public sewer
- Home design: Single-family residence; One-story
- Exterior features: Lot of about 0.23 acres
Interior
- Bathrooms: 1 full bathroom; 1 half bathroom
- Interior features: Located in the Pinewood subdivision; Directions: Turn off of Buena Vista Road onto Asa Drive; the house is on the left before Upland Way
Neighborhood map
What this means for you Summary
Snapshot
- This is a 3-bed/1.5-bath single-family listed at $90k.
Deal economics
- At list price, monthly cash flow is $436 ($5k/yr) — positive.
- The deal already cash-flows at list — no discount required.
- Meets the 1% rule at list price ($1k rent vs $90k).
- Recommended offer: $89k (1.5% below list) — sets the bar for market timing.
- Cap rate 12.1% vs local median 4.7% in Columbus — top-decile yield for the area; either an underpriced asset or a hidden risk that comps aren't pricing in. Stress-test before assuming the spread holds.
Location & tenants
- Location reads 64/100 on livability (#254 in GA) — a middle-class / working-renter tenant base. Strengths: cost of living A+, housing A+, health & safety B; Watch: amenities D+, schools F, crime F.
- Muscogee County (urban): math 21% / reading 30% proficiency, ranked #120 of 174 in GA (top 69%) — low school quality limits family demand, transient renter base, plan for 1-2y turnover; 61% free/reduced lunch — lower-income household profile, screen leases tightly.
- Market conditions: Rents rising fast (+4.8%/yr); 256 active listings in the ZIP; 27 comparable units currently listed for rent nearby; rentals at typical pace (median 22d on market — plan ~3-4 weeks tenant-placement turnaround); 44% of comp listings sitting > 30 days — soft ceiling on asking rent; 291 units permitted in Muscogee County in 2024 (30 in 5+ unit buildings).
Forward outlook
- Local home prices are declining (-3.0%/yr); year-one equity from $622 of loan paydown is wiped out by about $3k of value loss. Plan a longer hold.
- Muscogee County population projected at +15% by 2050 — modest demand growth; plan on rents tracking national, not racing it.
- At projected returns (-3.0% appreciation + 4.8% rent growth), your $25k cash investment doubles in ~6 years — after that, you're playing with house money.
Negotiation context
- It's been on market 16 days — a 2% lower offer ($89k) is reasonable based on typical stale-listing flexibility.
Risks & watch-outs
- Climate carrying-cost: major flood risk; major wind risk, 76% chance of damaging wind over 30y; extreme-heat days projected 7→19/yr by 2055 (HVAC capex compounding) — expect insurance premiums to compound above CPI over the hold.
Questions for the listing agent
- Built in 1971 — when were the roof, HVAC, electrical panel, plumbing, and water heater last replaced?
- Is there a deadline driving the sale (1031 exchange, divorce, estate, relocation)? That informs how much negotiation room exists.
- Schools are F-rated, which usually means shorter tenancies and higher turnover. Who's the typical renter profile here, and what's been the actual vacancy rate?
- Crime grade is F in this area — have there been break-ins, vandalism, or insurance claims at this property in the last 3 years? What carrier currently insures it and at what premium?
- What's the average days-on-market for RENTAL listings here right now (not sales)? A rising rental-DOM trend means longer vacancies and softer asking-rent achievability than the comps imply.
- What's the recent tenant-quality profile in this submarket — average credit score on applications, eviction rate, late-payment / NSF rate, and stable-employment percentage? A property-management company in the area should have these aggregated.
- How much new for-sale + rental construction is in the pipeline within 1–3 miles? Heavy new supply typically softens prices + rents 12–24 months out; constrained supply supports both.
Investment metrics
- 1% rule
- 1.49% ✓
- Cap rate
- 12.10%
- Cash-on-cash
- 20.76%
- DSCR
- 1.92
- GRM
- 5.6
CMA / ARV
- ARV (on-the-fly)
- $164,944
- Comps found
- 12
Show comp detail 12 sales within ~0.75 mi
| Address | Dist | Beds/Ba | Sqft | Sold | Price | $/sf | Match |
|---|---|---|---|---|---|---|---|
| 924 Vista Dr | 0.36mi | 3/2.0 | 1,353 (+0%) | 8mo | $165,000 | $122 | 75 |
| 719 Wilder Dr | 0.46mi | 3/2.0 | 1,302 (-4%) | 3mo | $235,000 | $180 | 68 |
| 727 Wilder Dr | 0.45mi | 3/2.0 | 1,302 (-4%) | 5mo | $250,000 | $192 | 66 |
| 803 Park Hill Dr | 0.29mi | 3/2.0 | 1,465 (+8%) | 8mo | $110,000 | $75 | 64 |
| 1014 Watson Dr | 0.59mi | 3/1.5 | 1,296 (-4%) | 3mo | $140,000 | $108 | 63 |
| 754 Red Oak Dr | 0.37mi | 3/2.0 | 1,489 (+10%) | 3mo | $185,000 | $124 | 61 |
| 803 Vista Dr | 0.37mi | 3/2.0 | 1,200 (-11%) | 2mo | $151,500 | $126 | 61 |
| 5825 Stafford Ln | 0.28mi | 4/2.0 (+1) | 1,528 (+13%) | 2mo | $150,000 | $98 | 57 |
| 5833 Bunche St | 0.56mi | 3/2.0 | 1,232 (-9%) | 6mo | $120,000 | $97 | 52 |
| 736 Belvedere Dr | 0.57mi | 4/2.0 (+1) | 1,465 (+8%) | 4mo | $169,900 | $116 | 49 |
| 5529 Pollman St | 0.63mi | 4/2.0 (+1) | 1,250 (-8%) | 5mo | $146,000 | $117 | 46 |
| 6416 Sandy Bottom Dr | 0.60mi | 3/2.0 | 1,525 (+13%) | 6mo | $245,000 | $161 | 43 |
Match score weights: distance 35% · size 25% · config 20% · recency 20%. Top-matched comps best support the ARV.
Projected returns pro-forma
-3.0% appreciation · 4.82% rent growth · sell at horizon
- IRR
- 15.2%
- Equity multiple
- 1.62×
- Total profit
- $15,695
- Equity at exit
- $13,419
- IRR
- 25.2%
- Equity multiple
- 3.39×
- Total profit
- $60,130
- Equity at exit
- $7,782
Cash invested: $25,200 (down + closing). Projections, not guarantees.
Landlord ↔ Tenant lean methodology
- Overall (STATE)
- 90 Strongly Landlord-Friendly
- State Georgia
- 90 Strongly Landlord-Friendly · R+3
- County
- — inherits STATE
- City
- — inherits STATE
ZIP-level market 31907
- Rents YoY
- 4.8%
- Active inventory
- 256
- Price-to-rent
- 5.6×
Monthly cashflow live
- Estimated rent
- $1,339 high interval (Pro) →
- Mortgage (P&I)
- −$472
- Tax from tax record
- −$113 /mo · $1,351/yr
- Insurance
- −$38
- HOA
- −$0
- Vacancy / Maint / Mgmt
- −$281
- Net cashflow
- $436
Break-even live
Sensitivity live
| Price | -10% $487 | -5% $461 | +0% $436 | +5% $410 | +10% $385 |
|---|---|---|---|---|---|
| Rent | -10% $330 | -5% $383 | +0% $436 | +5% $489 | +10% $542 |
| Rate | -1.0pp $481 | -0.5pp $459 | base $436 | +0.5pp $413 | +1.0pp $389 |
UW: 25.0% down · 7.5% · 30yr · 1.5% tax · 5.0% vac · 8.0% maint · 8.0% mgmt
Financing live
Cash to close
- Down payment
- $22,500
- Closing costs
- $2,700
- Reserves months
- —
- Total cash needed
- —
Loan-product check · same deal, 3 products live
Conventional
25% down · 7.5% · 30yr
- Down + closing
- —
- Monthly P&I
- —
- Monthly cashflow
- —
- DSCR
- —
- Eligible?
- —
Personal DTI + credit; lowest rate.
DSCR
20% down · 8.5% · 30yr
- Down + closing
- —
- Monthly P&I
- —
- Monthly cashflow
- —
- DSCR
- —
- Eligible?
- —
No personal income docs; deal must DSCR.
Hard money
10% down · 12.0% · 12mo
- Down + closing
- —
- Monthly P&I
- —
- Monthly cashflow
- —
- DSCR
- —
- Eligible?
- —
Short-term bridge; refi at stabilization.
Rent comps 27 comps
| Address | Beds | Baths | Sqft | Rent | $/sqft | DOM | Units | Dist |
|---|---|---|---|---|---|---|---|---|
| 845 Arlington Dr Columbus, GA | 3.0 | 2.0 | 1250 | $850 | $0.68 | 44d | 1 | 0.22mi |
| 879 Arlington Dr Columbus, GA | 4.0 | 2.0 | 1528 | $1,400 | $0.92 | 44d | 1 | 0.26mi |
| 5771 Spanish Oak Dr Columbus, GA | 3.0 | 2.0 | 1282 | $1,395 | $1.09 | 21d | 1 | 0.35mi |
| 5501 Ambervista Ct Columbus, GA | 3.0 | 2.0 | 1402 | $1,375 | $0.98 | 44d | 1 | 0.38mi |
| 1029 Amber Dr Columbus, GA | 3.0 | 1.5 | 1053 | $1,300 | $1.23 | 44d | 1 | 0.50mi |
| 6400 Sandy Bottom Dr Columbus, GA | 3.0 | 2.0 | 1455 | $1,850 | $1.27 | 14d | 1 | 0.57mi |
| 947 Belvedere Dr Columbus, GA | 3.0 | 2.0 | 1197 | $1,425 | $1.19 | 14d | 1 | 0.74mi |
| 5330 Buena Vista Rd Columbus, GA | 3.0 | 1.0 | 1100 | $995 | $0.90 | 44d | 1 | 0.75mi |
| 5850 Blueridge Dr Columbus, GA | 3.0 | 1.5 | 1120 | $1,200 | $1.07 | 44d | 1 | 0.87mi |
| 431 Camden Dr Columbus, GA | 3.0 | 2.0 | 1005 | $1,350 | $1.34 | 21d | 1 | 0.88mi |
| 410 Columbia Dr Unit 1 Columbus, GA | 3.0 | 1.5 | 925 | $950 | $1.03 | 21d | 1 | 0.89mi |
| 1417 Celeste Dr Columbus, GA | 4.0 | 2.0 | 1443 | $1,500 | $1.04 | 44d | 1 | 0.99mi |
| 4707 Marino St Columbus, GA | 3.0 | 1.0 | 1054 | $995 | $0.94 | 44d | 1 | 1.04mi |
| 6044 Cordova Rd Columbus, GA | 4.0 | 2.0 | 1381 | $1,700 | $1.23 | 44d | 1 | 1.06mi |
| 5421 Susan Ln Columbus, GA | 3.0 | 1.0 | 1368 | $1,100 | $0.80 | 21d | 1 | 1.06mi |
| 1423 Hagan Dr Columbus, GA | 3.0 | 1.0 | 1275 | $1,250 | $0.98 | 21d | 1 | 1.12mi |
| 419 Mount Pleasant Dr Columbus, GA | 3.0 | 1.5 | 1225 | $950 | $0.78 | 14d | 1 | 1.14mi |
| 407 Ocean Ave Columbus, GA | 3.0 | 2.0 | 1319 | $1,595 | $1.21 | 44d | 1 | 1.26mi |
| 1711 Floyd Rd Columbus, GA | 3.0 | 1.0 | 956 | $1,300 | $1.36 | 14d | 1 | 1.26mi |
| 7005 Hunter Hill Ct Columbus, GA | 4.0 | 2.0 | 1636 | $1,800 | $1.10 | 14d | 1 | 1.28mi |
| 5038 Wellborn Dr Columbus, GA | 3.0 | 1.0 | 1056 | $1,175 | $1.11 | 14d | 1 | 1.31mi |
| 5020 Shirley Ann Dr Columbus, GA | 4.0 | 2.5 | 1395 | $1,550 | $1.11 | 14d | 1 | 1.32mi |
| 4832 Wellborn Dr Columbus, GA | 3.0 | 2.0 | 1000 | $1,300 | $1.30 | 14d | 1 | 1.33mi |
| 1722 Emerson Ave Columbus, GA | 3.0 | 1.0 | 1075 | $1,150 | $1.07 | 21d | 1 | 1.39mi |
| 4970 Gardiner Dr Columbus, GA | 3.0 | 2.0 | 1412 | $1,400 | $0.99 | 44d | 1 | 1.42mi |
| 5530 Hunter Rd Columbus, GA | 3.0 | 2.0 | 1092 | $1,300 | $1.19 | 44d | 1 | 1.42mi |
| 527 Englewood Dr Columbus, GA | 3.0 | 2.0 | 1469 | $1,450 | $0.99 | 14d | 1 | 1.45mi |
Listing history 9 events
-
2026-06-18days on market $90,000 Active 16 DOM
-
2026-06-17days on market $90,000 Active 15 DOM
-
2026-06-16days on market $90,000 Active 14 DOM
-
2026-06-15days on market $90,000 Active 13 DOM
-
2026-06-14days on market $90,000 Active 11 DOM
-
2026-06-13days on market $90,000 Active 10 DOM
-
2026-06-10days on market $90,000 Active 8 DOM
-
2026-06-09status $90,000 Active 7 DOM
-
2026-05-14$90,000 Active
ⓘ Source: listings_history table (triggers on properties + properties_extension) + one-shot
backfill from property_details.listing_events for pre-trigger history.
Tax reassessment forecast GA · Resets to sale price
- Current annual tax
- $1,351 · $113/mo
- Projected year-2 tax
- $1,351 · $113/mo
- Expected delta
- $0/yr ($0/mo · 0.0%)
ⓘ Screening estimate from a state-policy table — verify with the county assessor before closing.
Climate risk First Street
- Flood 6/10 Major FEMA zone X (unshaded) · 75% chance over 30 yrs
- Wildfire 3/10 Moderate
- Heat 7/10 Severe 7 d/yr ≥107°F today · 19 d/yr by 30 yrs out
- Wind 6/10 Major 76% chance of damaging wind over 30 yrs
- Air quality 4/10 Moderate 5 unhealthy d/yr today · 6 by 30 yrs out
Nearby sold comps map
Loading sold comps map…
Walkable amenities ~0.75 mi
Loading nearby amenities…
Taxation est. · year 1
- Rental income
- $16,070
- − Mortgage interest
- −$5,041
- − Property taxes
- −$1,351
- − Insurance
- −$450
- − Repairs & maintenance
- −$1,286
- − Management
- −$1,286
- − Depreciation
- −$2,618
- Taxable income
- $4,038
- Est. tax owed @ 24.0%
- −$969
- After-tax cash flow
- $4,261/yr
For passive investors: Depreciation is non-cash, so a rental often shows a tax loss while cash-flowing — sheltering income. Rental losses are passive: they offset passive income freely, and up to $25,000/yr can offset ordinary (W-2) income if you actively participate and your MAGI is under $100k (phasing out to $0 by $150k); unused losses carry forward. On sale, claimed depreciation is recaptured at up to 25%, and gains may owe capital-gains tax (a 1031 exchange can defer both). Figures are a year-1 estimate at your 24.0% rate — not tax advice; consult a CPA.
Schools (NCES district)
- District
- Muscogee County
- NCES district ID
- 1303870
- Math proficiency
- 21% ▼ -11.00%
- Reading proficiency
- 30% ▼ -7.00%
- Median HH income
- $41,176
- Composite
- 21.6/100
- National rank
- #8297
- State rank
- #120 of 174 in GA
Livability — Columbus
- Score
- 64/100
- State rank
- #254
- US rank
- #14102
Category grades
Schools grade is shown separately in the Schools card above.
Census & demographics
- Census place
- Columbus, GA
- County
- Muscogee County · 180,764 people
- City population
- 180,764
- Metro
- Columbus, GA-AL
- Population (ZIP)
- 59,110
- Household income
- $54,453
- Rent vs Own
- Severe rent burden
- 2138.0
Population outlook (Muscogee County) Hauer SSP2
- Today (2025)
- 216,729 people
- By 2030
- 224,504 · +3.6%
- By 2040
- 238,318 · +10.0%
- By 2050
- 249,027 · +14.9%
- By 2075
- 264,862 · +22.2%
- By 2100
- 254,786 · +17.6%
Race, ethnicity, and origin ACS 2023
- Neighborhood character
- Majority Black (64%)
- Race & ethnicity
- Black 64% White 22% Two or more races 8% Hispanic / Latino 6% Asian 1%
- Hispanic origin (detail)
- Mexican 2% Puerto Rican 2%
- Common ancestry
- Italian 1% Slovak 1%
- Foreign-born
- 4% · Canada, South Korea
- Languages at home
- 95% English-only · Spanish 3%
Political lean MEDSL · Muscogee
- 2024 margin
- Strong D (+23.4) · D 61.4% · R 38.0%
- 2008→2024 swing
- +3.7pp toward D · 2008: 19.7pp · 2024: 23.4pp
- All cycles
- 2024: D+23.4 2020: D+24.0 2016: D+18.6 2012: D+21.3 2008: D+19.7
Not yet ingested
- Civics
- —
Market trends
- HPI YoY
- ▼ -125.88%
- Current HPI
- 151.74
- Rent YoY
- ▲ 4.82%
- Metro
- Columbus, GA-AL
- State GDP YoY
- ▲ 2.66%
- F500 in state
- 28
Industry mix (Fortune 500 HQ in GA)
| Industry | F500 HQs | Revenue |
|---|---|---|
| Paper / Packaging | 2 | $29B |
|
||
| Retail | 1 | $160B |
|
||
| Transportation / Logistics | 1 | $91B |
|
||
| Airlines | 1 | $62B |
|
||
| Consumer Goods | 1 | $47B |
|
||
| Utilities | 1 | $25B |
|
||
Price history
1 event — show timeline
- 2026-05-14 Listed $90,000 CBOR
Property tax history
+0.0%/yrLatest (2025): $1,351 · +0.0% YoY. Source: county tax records.
Cash-flow waterfall
monthlySold comps — $/sqft
last 12 mo · ≤1 miLoading sold comps…