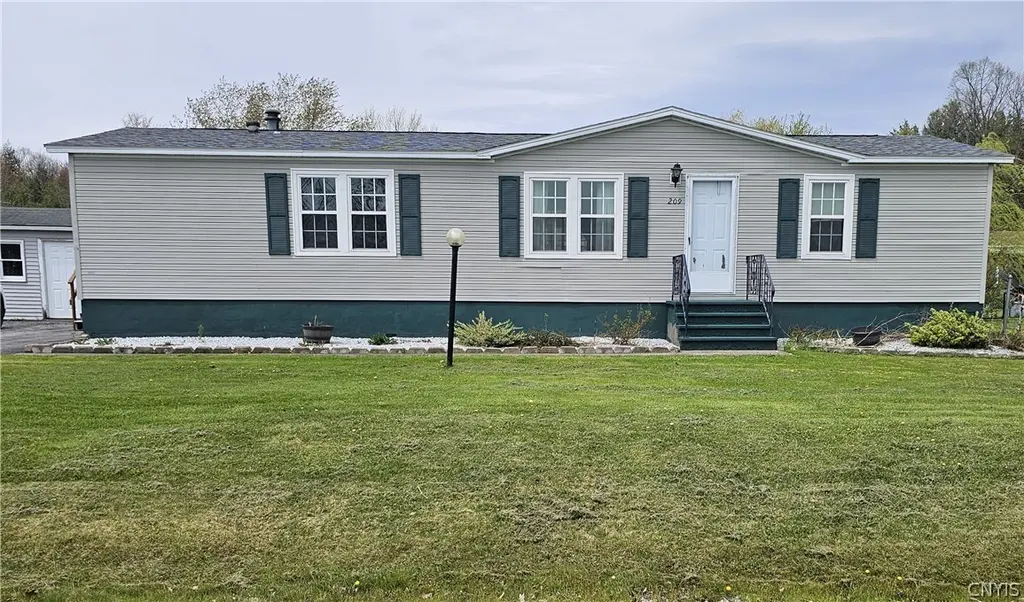
209 Abbe Blvd W Unit W97 · Rome, NY
Flood risk 1/10 · Minimal
- FEMA flood zone
- X (unshaded)
- Chance of flooding over 30 yrs
- 0.0%
- Est. flood insurance / yr
- $507 – $1,088
Fire risk 1/10 · Minimal
- Est. fire insurance / yr
- $691 – $1,283
Heat risk 3/10 · Minor
- Hot days now (above 94°F)
- 7 days/yr
- Hot days in 30 yrs
- 17 days/yr
Wind risk 1/10 · Minimal
- Chance of severe wind over 30 yrs
- —
Air-quality risk 2/10 · Minimal
- Unhealthy air days now
- 0 days/yr
- Unhealthy air days in 30 yrs
- 2 days/yr
Risk factors via First Street. Map © Google.
Why this score? — see what drove the B+ grade
The composite is a weighted blend of 9 inputs, each scored 0–100. Each bar is that input's sub-score; the figure is the points it added to the 100-point composite (weight × sub-score).
- Cash flow +30.0/30.0
- ARV discount +15.0/15.0
- 1% rule +10.0/10.0
- DSCR +10.0/10.0
- Schools +5.6/10.0
- Livability +3.2/5.0
- Rent growth +2.5/5.0
- Condition / age +2.5/5.0
- Appreciation +0.0/10.0
$89,900
🖨 Deal sheet 📄 Offer letter ✓ Due diligence
Listing remarks
Welcome to 209 Abbe Blvd W, located in the well-maintained Camelot Village community. This 3-bedroom, 2-bath mobile home offers 1,344 sq ft of comfortable living space with thoughtful updates throughout. Featuring an open-concept layout, the living room, dining area, and kitchen flow seamlessly together, highlighted by vaulted ceilings and a cozy fireplace that creates a warm and inviting atmosphere. Sliding glass doors lead to a private deck—perfect for relaxing or spending time outdoors—and a shed that provides additional storage Recent major updates provide peace of mind, including a roof, windows, and furnace—all replaced within the past 2 years. The secondary bathr
Key facts
- Private deck
- Recent major updates
- Cozy fireplace
Tags
Property features AI
Finance
- Financial info: Land lease amount (monthly)
- HOA & community: Association fee billed monthly; Land lease (monthly)
Exterior
- Parking: No garage
- Utilities: Cable available; High-speed internet available; Public water connected; Sewer connected; Circuit breaker electrical
- Home design: Single-story (1 story); Double wide mobile home; Resale property; City street frontage; Irregular residential lot (approx. 100 x 100)
- Construction: Vinyl siding; Copper plumbing; Asphalt roof; Crawl space foundation; Existing/previously built
- Exterior features: Blacktop driveway; Deck; Shed(s); Storage
Interior
- Kitchen: Dishwasher; Gas oven; Gas range
- Bedrooms: 3 bedrooms on the main level
- Flooring: Carpet; Laminate; Varies
- Bathrooms: 2 full bathrooms (both on the main level)
- Heating & cooling: Gas forced-air heating; Central air conditioning
- Interior features: Breakfast bar; Ceiling fans; Eat-in kitchen; Separate/formal living room; Country kitchen; Pantry; Sliding glass doors; Primary suite; Bedroom on main level; Main level primary
- Laundry & utility: Main level laundry; Gas water heater
Neighborhood map
What this means for you Summary
Snapshot
- This is a 3-bed/2.0-bath manufactured listed at $90k.
Deal economics
- At list price, monthly cash flow is $613 ($7k/yr) — positive.
- The deal already cash-flows at list — no discount required.
- Meets the 1% rule at list price ($2k rent vs $90k).
- Recommended offer: $87k (3.0% below list) — sets the bar for market timing.
- Cap rate 14.5% vs local median 5.6% in Rome — top-decile yield for the area; either an underpriced asset or a hidden risk that comps aren't pricing in. Stress-test before assuming the spread holds.
Location & tenants
- Location reads 64/100 on livability (#722 in NY) — a middle-class / working-renter tenant base. Strengths: cost of living A+, housing A+; Watch: health & safety C-, schools F, amenities F.
- Westmoreland Central School District (rural): math 61% / reading 68% proficiency, ranked #173 of 590 in NY (top 29%) — acceptable for families but not a draw, mixed tenant base, ~2y average lease.
- Market conditions: 272 active listings in the ZIP; 204 units permitted in Oneida County in 2024 (68 in 5+ unit buildings).
Forward outlook
- Local home prices are declining (-3.0%/yr); year-one equity from $622 of loan paydown is wiped out by about $3k of value loss. Plan a longer hold.
- Oneida County population projected at -12% by 2050 — secular population decline; favor cash flow + early exit over multi-decade hold.
- At projected returns (-3.0% appreciation + 3.0% rent growth), your $25k cash investment doubles in ~5 years — after that, you're playing with house money.
Negotiation context
- It's been on market 44 days — a 3% lower offer ($87k) is reasonable based on typical stale-listing flexibility.
Questions for the listing agent
- It's been on market 44 days. Have you received any prior offers? Is the seller open to a 3% concession, seller financing, or rate buy-down credit?
- Is there a deadline driving the sale (1031 exchange, divorce, estate, relocation)? That informs how much negotiation room exists.
- Schools are F-rated, which usually means shorter tenancies and higher turnover. Who's the typical renter profile here, and what's been the actual vacancy rate?
- What's the average days-on-market for RENTAL listings here right now (not sales)? A rising rental-DOM trend means longer vacancies and softer asking-rent achievability than the comps imply.
- What's the recent tenant-quality profile in this submarket — average credit score on applications, eviction rate, late-payment / NSF rate, and stable-employment percentage? A property-management company in the area should have these aggregated.
- How much new for-sale + rental construction is in the pipeline within 1–3 miles? Heavy new supply typically softens prices + rents 12–24 months out; constrained supply supports both.
Investment metrics
- 1% rule
- 1.77% ✓
- Cap rate
- 14.48%
- Cash-on-cash
- 29.22%
- DSCR
- 2.30
- GRM
- 4.7
CMA / ARV
- ARV (median comp)
- $130,832
- List price
- $89,900
- Delta
- -31.29%
- Verdict
- UNDERPRICED
- Comps
- 1 within 2.0 mi
Show comp detail 2 sales within ~0.75 mi
| Address | Dist | Beds/Ba | Sqft | Sold | Price | $/sf | Match |
|---|---|---|---|---|---|---|---|
| 126 Pazdur Blvd, S | 0.14mi | 3/2.0 | 1,456 (+8%) | 21mo | $81,000 | $56 | 62 |
| 119 Abbe Blvd S | 0.12mi | 3/2.0 | 1,150 (-14%) | 20mo | $50,000 | $43 | 54 |
Match score weights: distance 35% · size 25% · config 20% · recency 20%. Top-matched comps best support the ARV.
Projected returns pro-forma
-3.0% appreciation · 3.0% rent growth · sell at horizon
- IRR
- 23.7%
- Equity multiple
- 1.97×
- Total profit
- $24,515
- Equity at exit
- $13,404
- IRR
- 31.6%
- Equity multiple
- 3.85×
- Total profit
- $71,784
- Equity at exit
- $7,773
Cash invested: $25,172 (down + closing). Projections, not guarantees.
Landlord ↔ Tenant lean methodology
- Overall (STATE)
- 15 Strongly Tenant-Friendly
- State New York
- 15 Strongly Tenant-Friendly · D+10
- County
- — inherits STATE
- City
- — inherits STATE
ZIP-level market 13440
- Home prices YoY
- -8.0%
- Active inventory
- 272
- Price-to-rent
- 4.7×
Monthly cashflow live
- Estimated rent
- $1,595 medium interval (Pro) →
- Mortgage (P&I)
- −$471
- Tax from tax record
- −$139 /mo · $1,662/yr
- Insurance
- −$37
- HOA
- −$0
- Vacancy / Maint / Mgmt
- −$335
- Net cashflow
- $613
Break-even live
UW: 25.0% down · 7.5% · 30yr · 1.5% tax · 5.0% vac · 8.0% maint · 8.0% mgmt
Financing live
Cash to close
- Down payment
- $22,475
- Closing costs
- $2,697
- Reserves months
- —
- Total cash needed
- —
Loan-product check · same deal, 3 products live
Conventional
25% down · 7.5% · 30yr
- Down + closing
- —
- Monthly P&I
- —
- Monthly cashflow
- —
- DSCR
- —
- Eligible?
- —
Personal DTI + credit; lowest rate.
DSCR
20% down · 8.5% · 30yr
- Down + closing
- —
- Monthly P&I
- —
- Monthly cashflow
- —
- DSCR
- —
- Eligible?
- —
No personal income docs; deal must DSCR.
Hard money
10% down · 12.0% · 12mo
- Down + closing
- —
- Monthly P&I
- —
- Monthly cashflow
- —
- DSCR
- —
- Eligible?
- —
Short-term bridge; refi at stabilization.
Listing history 17 events
-
2026-06-19days on market $89,900 Active 44 DOM
-
2026-06-18days on market $89,900 Active 43 DOM
-
2026-06-17days on market $89,900 Active 42 DOM
-
2026-06-16days on market $89,900 Active 41 DOM
-
2026-06-15days on market $89,900 Active 40 DOM
-
2026-06-14days on market $89,900 Active 38 DOM
-
2026-06-13days on market $89,900 Active 37 DOM
-
2026-06-10days on market $89,900 Active 35 DOM
-
2026-06-09days on market $89,900 Active 34 DOM
-
2026-06-08days on market $89,900 Active 33 DOM
-
2026-06-07days on market $89,900 Active 32 DOM
-
2026-06-03days on market $89,900 Active 28 DOM
-
2026-06-02days on market $89,900 Active 27 DOM
-
2026-06-01days on market $89,900 Active 26 DOM
-
2026-05-31days on market $89,900 Active 25 DOM
-
2026-05-30days on market $89,900 Active 24 DOM
-
2026-05-06$99,900 Active 921-char remark
ⓘ Source: listings_history table (triggers on properties + properties_extension) + one-shot
backfill from property_details.listing_events for pre-trigger history.
Tax reassessment forecast NY · Partial reset (capped growth)
- Current annual tax
- $1,662 · $139/mo
- Projected year-2 tax
- $1,662 · $139/mo
- Expected delta
- $0/yr ($0/mo · -0.0%)
ⓘ Screening estimate from a state-policy table — verify with the county assessor before closing.
Climate risk First Street
- Flood 1/10 Low FEMA zone X (unshaded) · 0% chance over 30 yrs
- Wildfire 1/10 Low
- Heat 3/10 Moderate 7 d/yr ≥94°F today · 17 d/yr by 30 yrs out
- Wind 1/10 Low
- Air quality 2/10 Low 0 unhealthy d/yr today · 2 by 30 yrs out
Nearby sold comps map
Loading sold comps map…
Walkable amenities ~0.75 mi
Loading nearby amenities…
Taxation est. · year 1
- Rental income
- $19,146
- − Mortgage interest
- −$5,036
- − Property taxes
- −$1,662
- − Insurance
- −$450
- − Repairs & maintenance
- −$1,532
- − Management
- −$1,532
- − Depreciation
- −$2,615
- Taxable income
- $6,320
- Est. tax owed @ 24.0%
- −$1,517
- After-tax cash flow
- $5,839/yr
For passive investors: Depreciation is non-cash, so a rental often shows a tax loss while cash-flowing — sheltering income. Rental losses are passive: they offset passive income freely, and up to $25,000/yr can offset ordinary (W-2) income if you actively participate and your MAGI is under $100k (phasing out to $0 by $150k); unused losses carry forward. On sale, claimed depreciation is recaptured at up to 25%, and gains may owe capital-gains tax (a 1031 exchange can defer both). Figures are a year-1 estimate at your 24.0% rate — not tax advice; consult a CPA.
Schools (NCES district)
- District
- Westmoreland Central School District
- NCES district ID
- 3631050
- Math proficiency
- 61% ▼ -1.00%
- Reading proficiency
- 68% ▲ 7.00%
- Median HH income
- $64,671
- Composite
- 56.19/100
- National rank
- #1176
- State rank
- #173 of 590 in NY
Livability — Rome
- Score
- 64/100
- State rank
- #722
- US rank
- #13676
Category grades
Schools grade is shown separately in the Schools card above.
Census & demographics
- City population
- 41,418
- Population (ZIP)
- 41,273
Population outlook (Oneida County) Hauer SSP2
- Today (2025)
- 225,223 people
- By 2030
- 220,384 · -2.1%
- By 2040
- 209,071 · -7.2%
- By 2050
- 197,920 · -12.1%
- By 2075
- 175,541 · -22.1%
- By 2100
- 148,491 · -34.1%
Race, ethnicity, and origin ACS 2023
- Neighborhood character
- Predominantly White (82%)
- Race & ethnicity
- White 82% Hispanic / Latino 7% Two or more races 6% Black 4% Asian 1%
- Hispanic origin (detail)
- Mexican 1% Puerto Rican 4%
- Common ancestry
- Romanian 9% Lithuanian 4% Slovak 1%
- Foreign-born
- 3% · Canada, China
- Languages at home
- 94% English-only · Spanish 3% Other Indo-European 1%
Political lean MEDSL · Oneida
- 2024 margin
- Strong R (+21.3) · D 39.4% · R 60.6%
- 2008→2024 swing
- -15.2pp toward R · 2008: -6.1pp · 2024: -21.3pp
- All cycles
- 2024: R+21.3 2020: R+15.5 2016: R+21.1 2012: R+5.3 2008: R+6.1
Not yet ingested
- Civics
- —
Market trends
- HPI YoY
- ▼ -29.58%
- Current HPI
- 339.3589
- Rent YoY
- —
- Metro
- —
- State GDP YoY
- ▲ 2.60%
- F500 in state
- 92
Industry mix (Fortune 500 HQ in NY)
| Industry | F500 HQs | Revenue |
|---|---|---|
| Financial Services | 10 | $950B |
|
||
| Consumer Goods | 9 | $162B |
|
||
| Insurance | 4 | $225B |
|
||
| Telecommunications | 2 | $144B |
|
||
| Pharmaceuticals | 2 | $112B |
|
||
| Media / Entertainment | 2 | $69B |
|
||
Price history
-10.0% since first listed2 events — show timeline
- 2026-05-20 Price Changed $89,900 CNYIS
- 2026-05-06 Listed $99,900 CNYIS
Property tax history
+27.9%/yrLatest (2025): $1,662 · +5.2% YoY. Source: county tax records.
Cash-flow waterfall
monthlySold comps — $/sqft
last 12 mo · ≤1 miLoading sold comps…