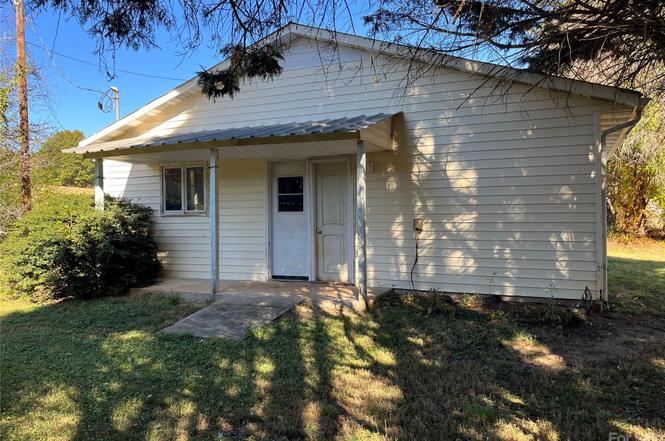
344 Piedmont Rd · Rutherfordton, NC
Flood risk 1/10 · Minimal
- FEMA flood zone
- X (unshaded)
- Chance of flooding over 30 yrs
- 0.0%
- Est. flood insurance / yr
- $507 – $1,088
Fire risk 3/10 · Minor
- Est. fire insurance / yr
- $906 – $1,684
Heat risk 6/10 · Moderate
- Hot days now (above 105°F)
- 7 days/yr
- Hot days in 30 yrs
- 17 days/yr
Wind risk 2/10 · Minimal
- Chance of severe wind over 30 yrs
- 1.0%
Air-quality risk 3/10 · Minor
- Unhealthy air days now
- 3 days/yr
- Unhealthy air days in 30 yrs
- 3 days/yr
Risk factors via First Street. Map © Google.
Why this score? — see what drove the C+ grade
The composite is a weighted blend of 9 inputs, each scored 0–100. Each bar is that input's sub-score; the figure is the points it added to the 100-point composite (weight × sub-score).
- Cash flow +27.1/30.0
- DSCR +9.4/10.0
- ARV discount +7.5/15.0
- 1% rule +6.2/10.0
- Livability +3.7/5.0
- Schools +3.6/10.0
- Rent growth +2.5/5.0
- Condition / age +2.5/5.0
- Appreciation +0.0/10.0
$160,000
🖨 Deal sheet 📄 Offer letter ✓ Due diligence
Listing remarks
Welcome to 344 Piedmont Rd, a beautifully remodeled home and excellent investment opportunity situated on a spacious 0.63-acre lot in the serene town of Rutherfordton. This charming property boasts a brand-new roof installed in June 2024, providing peace of mind for years to come. Inside, you’ll find stunning updates, including new laminated flooring throughout and luxurious marble tile flooring in the bathrooms. The home features 6 newly installed windows, ensuring plenty of natural light. Both bathrooms have been thoughtfully updated with new vanities, giving them a modern, fresh feel. The kitchen has been fully remodeled, featuring elegant butcher block countertops, perfect for mea
Key facts
- Marble tile flooring
- Spacious lot
- New roof
Tags
Property features AI
Finance
- HOA & community: No HOA
Exterior
- Parking: Shared driveway; No main-level garage
- Utilities: Public water; Septic system installed
- Home design: Single-family residence; One story; Site-built construction; Facing direction not specified
- Construction: Vinyl exterior; Composition roof; Slab foundation; Built on-site
- Exterior features: Patio; Cleared, level lot; Asphalt/paved public road access
Interior
- Kitchen: Electric range; Kitchen contains laundry area
- Bedrooms: 2 bedrooms (both on the main level)
- Flooring: Vinyl flooring
- Bathrooms: 1 full bathroom; 1 half bathroom
- Heating & cooling: Ductless heating (electric); Central air conditioning; Ductless cooling (electric)
- Interior features: 6 total rooms; Electric range; Vinyl flooring
- Laundry & utility: Laundry located in the kitchen
Neighborhood map
What this means for you Summary
Snapshot
- This is a 2-bed/1.5-bath other listed at $160k.
Deal economics
- At list price, monthly cash flow is $451 ($5k/yr) — positive.
- The deal already cash-flows at list — no discount required.
- Meets the 1% rule at list price ($2k rent vs $160k).
- Recommended offer: $141k (12.0% below list) — sets the bar for market timing.
- Cap rate 9.7% vs local median 3.0% in Rutherfordton — top-decile yield for the area; either an underpriced asset or a hidden risk that comps aren't pricing in. Stress-test before assuming the spread holds.
Location & tenants
- Location reads 73/100 on livability (#67 in NC) — a middle-class / working-renter tenant base. Strengths: cost of living A+, housing A+, health & safety A+; Watch: crime D, amenities F, commute F.
- Rutherford County Schools (rural): math 43% / reading 44% proficiency, ranked #98 of 178 in NC (top 55%) — families likely to look elsewhere, expect single-tenant / working-renter base with shorter leases; 60% free/reduced lunch — lower-income household profile, screen leases tightly.
- Zoned schools: Rutherfordton Elementary School (math 37% / reading 47%, grade F, #633 of 1,410 statewide, top 48%, 390 students, 99% FRL); R-S Central High School (math 62% / reading 42%, grade D+, #292 of 535 statewide, top 56%, 758 students, 100% FRL) — zoned schools average 99% FRL vs 60% district-wide (39 pts higher); higher-poverty schools than district average — tighter screening recommended.
- Market conditions: 312 active listings in the ZIP; 2 comparable units currently listed for rent nearby; 193 units permitted in Rutherford County in 2024 (0 in 5+ unit buildings).
Forward outlook
- Local home prices are declining (-3.0%/yr); year-one equity from $1k of loan paydown is wiped out by about $5k of value loss. Plan a longer hold.
- Rutherford County population projected at -17% by 2050 — secular population decline; favor cash flow + early exit over multi-decade hold.
- At projected returns (-3.0% appreciation + 3.0% rent growth), your $45k cash investment doubles in ~10 years — after that, you're playing with house money.
Negotiation context
- It's been on market 141 days — a 12% lower offer ($141k) is reasonable based on typical stale-listing flexibility.
- 7 sale attempts since 3y ago; this cycle's ask has dropped $15k (9%) from the opening price — seller is motivated, your offer sets the floor, not the list.
- Current owner paid $75k; list at $160k implies a 113% gain — meaningful room to come down on a strong offer.
Risks & watch-outs
- Climate carrying-cost: extreme-heat days projected 7→17/yr by 2055 (HVAC capex compounding) — expect insurance premiums to compound above CPI over the hold.
Questions for the listing agent
- It's been on market 141 days. Have you received any prior offers? Is the seller open to a 12% concession, seller financing, or rate buy-down credit?
- Why hasn't it sold? Are there any deal-killer items the seller is aware of (foundation, flood, title, zoning, code violations)?
- Is there a deadline driving the sale (1031 exchange, divorce, estate, relocation)? That informs how much negotiation room exists.
- Schools are D-rated, which usually means shorter tenancies and higher turnover. Who's the typical renter profile here, and what's been the actual vacancy rate?
- Crime grade is D in this area — have there been break-ins, vandalism, or insurance claims at this property in the last 3 years? What carrier currently insures it and at what premium?
- What's the average days-on-market for RENTAL listings here right now (not sales)? A rising rental-DOM trend means longer vacancies and softer asking-rent achievability than the comps imply.
- What's the recent tenant-quality profile in this submarket — average credit score on applications, eviction rate, late-payment / NSF rate, and stable-employment percentage? A property-management company in the area should have these aggregated.
- How much new for-sale + rental construction is in the pipeline within 1–3 miles? Heavy new supply typically softens prices + rents 12–24 months out; constrained supply supports both.
Investment metrics
- 1% rule
- 1.12% ✓
- Cap rate
- 9.68%
- Cash-on-cash
- 12.08%
- DSCR
- 1.54
- GRM
- 7.5
CMA / ARV
No comps found within radius.
Projected returns pro-forma
-3.0% appreciation · 3.0% rent growth · sell at horizon
- IRR
- 1.6%
- Equity multiple
- 1.06×
- Total profit
- $2,734
- Equity at exit
- $23,857
- IRR
- 11.2%
- Equity multiple
- 1.87×
- Total profit
- $39,112
- Equity at exit
- $13,834
Cash invested: $44,800 (down + closing). Projections, not guarantees.
Landlord ↔ Tenant lean methodology
- Overall (STATE)
- 85 Strongly Landlord-Friendly
- State North Carolina
- 85 Strongly Landlord-Friendly · R+3
- County
- — inherits STATE
- City
- — inherits STATE
ZIP-level market 28139
- Home prices YoY
- -21.6%
- Active inventory
- 312
- Price-to-rent
- 7.5×
Monthly cashflow live
- Estimated rent
- $1,785 medium interval (Pro) →
- Mortgage (P&I)
- −$839
- Tax from tax record
- −$54 /mo · $645/yr
- Insurance
- −$67
- HOA
- −$0
- Vacancy / Maint / Mgmt
- −$375
- Net cashflow
- $451
Break-even live
UW: 25.0% down · 7.5% · 30yr · 1.5% tax · 5.0% vac · 8.0% maint · 8.0% mgmt
Financing live
Cash to close
- Down payment
- $40,000
- Closing costs
- $4,800
- Reserves months
- —
- Total cash needed
- —
Loan-product check · same deal, 3 products live
Conventional
25% down · 7.5% · 30yr
- Down + closing
- —
- Monthly P&I
- —
- Monthly cashflow
- —
- DSCR
- —
- Eligible?
- —
Personal DTI + credit; lowest rate.
DSCR
20% down · 8.5% · 30yr
- Down + closing
- —
- Monthly P&I
- —
- Monthly cashflow
- —
- DSCR
- —
- Eligible?
- —
No personal income docs; deal must DSCR.
Hard money
10% down · 12.0% · 12mo
- Down + closing
- —
- Monthly P&I
- —
- Monthly cashflow
- —
- DSCR
- —
- Eligible?
- —
Short-term bridge; refi at stabilization.
Rent comps 2 comps
| Address | Beds | Baths | Sqft | Rent | $/sqft | DOM | Units | Dist |
|---|---|---|---|---|---|---|---|---|
| 125 Central St Rutherfordton, NC | 1.0 | 1.0 | 740 | $1,820 | $2.46 | 13d | 1 | 0.91mi |
| 128 Meadow Ln Rutherfordton, NC | 3.0 | 2.0 | 1250 | $1,750 | $1.40 | 13d | 1 | 1.45mi |
Listing history 25 events
-
2026-06-02days on market $160,000 Active 141 DOM
-
2026-06-01days on market $160,000 Active 140 DOM
-
2026-05-31days on market $160,000 Active 139 DOM
-
2026-05-30days on market $160,000 Active 138 DOM
-
2026-04-11status Active
-
2026-01-03price $160,000
-
2025-12-17$175,000 Active
-
2025-10-07price $159,900
-
2025-10-01price $172,900
-
2025-09-23price $177,900
-
2025-09-17price $184,900
-
2025-09-10price $191,500
-
2025-09-09price $185,000
-
2025-09-09price $189,900
-
2025-09-02$193,500 Active
-
2025-07-02price $210,000
-
2025-06-09$215,000 Active
-
2024-09-17$215,000 Active
-
2024-06-28soldstatus $75,000 Closed
-
2024-05-20historical Active Under Contract
-
2024-05-01status Active
-
2024-01-18historical Active Under Contract
-
2024-01-04price $85,000
-
2023-11-08price $90,000
-
2023-10-25$95,000 Active
ⓘ Source: listings_history table (triggers on properties + properties_extension) + one-shot
backfill from property_details.listing_events for pre-trigger history.
Tax reassessment forecast NC · Resets to sale price
- Current annual tax
- $645 · $54/mo
- Projected year-2 tax
- $1,312 · $109/mo
- Expected delta
- +$667/yr (+$56/mo · 103.3%)
ⓘ Screening estimate from a state-policy table — verify with the county assessor before closing.
Climate risk First Street
- Flood 1/10 Low FEMA zone X (unshaded) · 0% chance over 30 yrs
- Wildfire 3/10 Moderate
- Heat 6/10 Major 7 d/yr ≥105°F today · 17 d/yr by 30 yrs out
- Wind 2/10 Low 100% chance of damaging wind over 30 yrs
- Air quality 3/10 Moderate 3 unhealthy d/yr today · 3 by 30 yrs out
Nearby sold comps map
Loading sold comps map…
Walkable amenities ~0.75 mi
Loading nearby amenities…
Taxation est. · year 1
- Rental income
- $21,425
- − Mortgage interest
- −$8,962
- − Property taxes
- −$645
- − Insurance
- −$800
- − Repairs & maintenance
- −$1,714
- − Management
- −$1,714
- − Depreciation
- −$4,655
- Taxable income
- $2,935
- Est. tax owed @ 24.0%
- −$704
- After-tax cash flow
- $4,708/yr
For passive investors: Depreciation is non-cash, so a rental often shows a tax loss while cash-flowing — sheltering income. Rental losses are passive: they offset passive income freely, and up to $25,000/yr can offset ordinary (W-2) income if you actively participate and your MAGI is under $100k (phasing out to $0 by $150k); unused losses carry forward. On sale, claimed depreciation is recaptured at up to 25%, and gains may owe capital-gains tax (a 1031 exchange can defer both). Figures are a year-1 estimate at your 24.0% rate — not tax advice; consult a CPA.
Schools (NCES district)
- District
- Rutherford County Schools
- NCES district ID
- 3704080
- Math proficiency
- 43% ▼ -1.00%
- Reading proficiency
- 44% ▼ -2.00%
- Median HH income
- $36,490
- Composite
- 36.11/100
- National rank
- #4753
- State rank
- #98 of 178 in NC
Livability — Rutherfordton
- Score
- 73/100
- State rank
- #67
- US rank
- #5114
Category grades
Schools grade is shown separately in the Schools card above.
Census & demographics
- Population (ZIP)
- 18,887
Population outlook (Rutherford County) Hauer SSP2
- Today (2025)
- 63,695 people
- By 2030
- 61,670 · -3.2%
- By 2040
- 57,212 · -10.2%
- By 2050
- 52,763 · -17.2%
- By 2075
- 44,493 · -30.1%
- By 2100
- 38,127 · -40.1%
Race, ethnicity, and origin ACS 2023
- Neighborhood character
- Predominantly White (86%)
- Race & ethnicity
- White 86% Black 6% Two or more races 5% Hispanic / Latino 4%
- Common ancestry
- Serbian 3% Slovak 2% Lithuanian 1%
- Foreign-born
- 3% · Canada
- Languages at home
- 96% English-only · Spanish 3%
Political lean MEDSL · Rutherford
- 2024 margin
- Solid R (+47.8) · D 25.8% · R 73.6%
- 2008→2024 swing
- -16.0pp toward R · 2008: -31.8pp · 2024: -47.8pp
- All cycles
- 2024: R+47.8 2020: R+45.8 2016: R+47.9 2012: R+33.5 2008: R+31.8
Not yet ingested
- Civics
- —
Market trends
- HPI YoY
- ▼ -68.65%
- Current HPI
- 249.7007
- Rent YoY
- —
- Metro
- —
- State GDP YoY
- ▲ 3.28%
- F500 in state
- 26
Industry mix (Fortune 500 HQ in NC)
| Industry | F500 HQs | Revenue |
|---|---|---|
| Financial Services | 2 | $213B |
|
||
| Retail | 2 | $95B |
|
||
| Industrial Conglomerate | 1 | $38B |
|
||
| Metals / Steel | 1 | $35B |
|
||
| Utilities | 1 | $30B |
|
||
| Industrial Machinery | 1 | $19B |
|
||
Price history
+68.4% since first listed21 events — show timeline
- 2026-04-11 Relisted — CANOPYMLS as Distributed by MLS Grid
- 2026-01-03 Price Changed $160,000 CANOPYMLS as Distributed by MLS Grid
- 2025-12-17 Listed $175,000 CANOPYMLS as Distributed by MLS Grid
- 2025-10-07 Price Changed $159,900 CANOPYMLS as Distributed by MLS Grid
- 2025-10-01 Price Changed $172,900 CANOPYMLS as Distributed by MLS Grid
- 2025-09-23 Price Changed $177,900 CANOPYMLS as Distributed by MLS Grid
- 2025-09-17 Price Changed $184,900 CANOPYMLS as Distributed by MLS Grid
- 2025-09-10 Price Changed $191,500 CANOPYMLS as Distributed by MLS Grid
- 2025-09-09 Price Changed $185,000 CANOPYMLS as Distributed by MLS Grid
- 2025-09-09 Price Changed $189,900 CANOPYMLS as Distributed by MLS Grid
- 2025-09-02 Listed $193,500 CANOPYMLS as Distributed by MLS Grid
- 2025-07-02 Price Changed $210,000 CANOPYMLS as Distributed by MLS Grid
- 2025-06-09 Listed $215,000 CANOPYMLS as Distributed by MLS Grid
- 2024-09-17 Listed $215,000 CANOPYMLS as Distributed by MLS Grid
- 2024-06-28 Sold (MLS) $75,000 CANOPYMLS as Distributed by MLS Grid
- 2024-05-20 Contingent — CANOPYMLS as Distributed by MLS Grid
- 2024-05-01 Relisted — CANOPYMLS as Distributed by MLS Grid
- 2024-01-18 Contingent — CANOPYMLS as Distributed by MLS Grid
- 2024-01-04 Price Changed $85,000 CANOPYMLS as Distributed by MLS Grid
- 2023-11-08 Price Changed $90,000 CANOPYMLS as Distributed by MLS Grid
- 2023-10-25 Listed $95,000 CANOPYMLS as Distributed by MLS Grid
Property tax history
+20.1%/yrLatest (2025): $645 · +387.0% YoY. Source: county tax records.
Cash-flow waterfall
monthlySold comps — $/sqft
last 12 mo · ≤1 miLoading sold comps…