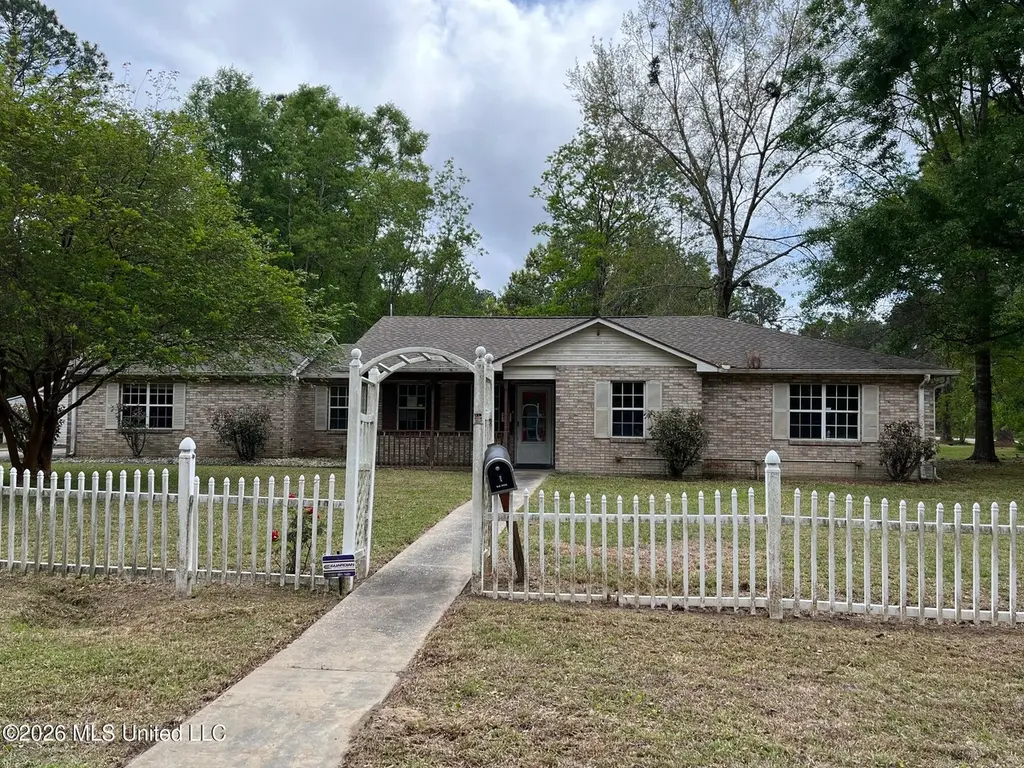
6173 W Adams St · Waveland, MS
Flood risk 6/10 · Moderate
- FEMA flood zone
- AE
- Chance of flooding over 30 yrs
- 0.64%
- Est. flood insurance / yr
- $1,737 – $8,500
Fire risk 6/10 · Moderate
- Est. fire insurance / yr
- $1,241 – $2,305
Heat risk 10/10 · Severe
- Hot days now (above 107°F)
- 7 days/yr
- Hot days in 30 yrs
- 21 days/yr
Wind risk 9/10 · Severe
- Chance of severe wind over 30 yrs
- 99.0%
Air-quality risk 1/10 · Minimal
- Unhealthy air days now
- 0 days/yr
- Unhealthy air days in 30 yrs
- 0 days/yr
Risk factors via First Street. Map © Google.
Why this score? — see what drove the B- grade
The composite is a weighted blend of 9 inputs, each scored 0–100. Each bar is that input's sub-score; the figure is the points it added to the 100-point composite (weight × sub-score).
- Cash flow +26.5/30.0
- ARV discount +12.6/15.0
- DSCR +9.1/10.0
- 1% rule +6.9/10.0
- Schools +3.9/10.0
- Livability +3.1/5.0
- Rent growth +2.5/5.0
- Condition / age +2.5/5.0
- Appreciation +0.0/10.0
$139,900
🖨 Deal sheet (PDF) 📄 Offer letter ✓ Due diligence
Listing remarks
Charming 3-Bedroom Brick Home in Bayside Park Welcome to this 3-bedroom, 2-bath brick home located in the Bayside Park community! Conveniently situated with easy access to the interstate, this property is perfect for commuters while still offering a peaceful neighborhood setting. Step inside to discover a spacious open floor plan with a desirable split-bedroom layout, providing both comfort and privacy. The inviting living area flows seamlessly into an eat-in kitchen, ideal for everyday living and entertaining. Situated on a large lot, this home offers plenty of outdoor space for relaxing, gardening, or hosting gatherings.
Key facts
- Open floor plan
- Split-bedroom layout
- Large lot
Tags
Neighborhood map
What this means for you Summary
Snapshot
- This is a 3-bed/2.0-bath single-family listed at $140k.
Deal economics
- At list price, monthly cash flow is $-55 ($-661/yr) — negative.
- To cash-flow at today's rent, offer at most $130k (7.0% below list).
- Meets the 1% rule at list price ($2k rent vs $140k).
- Recommended offer: $130k (7.0% below list) — sets the bar for cash-flow.
- Cap rate 9.5% vs local median 2.5% in Waveland — top-decile yield for the area; either an underpriced asset or a hidden risk that comps aren't pricing in. Stress-test before assuming the spread holds.
Location & tenants
- Location reads 61/100 on livability (#199 in MS) — a middle-class / working-renter tenant base. Strengths: cost of living A+, housing A+, health & safety A+; Watch: amenities F, commute F, employment D-.
- Hancock County School District (rural): math 47% / reading 44% proficiency, ranked #23 of 130 in MS (top 18%) — families likely to look elsewhere, expect single-tenant / working-renter base with shorter leases.
- Zoned schools: South Hancock Elementary School (math 34% / reading 32%, grade F, #168 of 375 statewide, top 45%, 535 students, 100% FRL); Hancock Middle School (math 48% / reading 44%, grade D+, #39 of 179 statewide, top 22%, 958 students, 100% FRL); Hancock High School (math 42% / reading 43%, grade F, #42 of 197 statewide, top 21%, 1,187 students, 100% FRL) — zoned schools average 100% FRL vs 58% district-wide (41 pts higher); higher-poverty schools than district average — tighter screening recommended.
- Market conditions: 622 active listings in the ZIP; 2 comparable units currently listed for rent nearby; 248 units permitted in Hancock County in 2024 (0 in 5+ unit buildings).
Forward outlook
- Local home prices are declining (-3.0%/yr); year-one equity from $967 of loan paydown is wiped out by about $4k of value loss. Plan a longer hold.
- Hancock County population projected at +20% by 2050 — long-run rental-demand tailwind backs the buy-and-hold thesis.
Negotiation context
- Only 12 days on market — expect competitive offers; lowballing is unlikely to land.
Risks & watch-outs
- Watch-outs: flood insurance adds $427/mo.
- Climate carrying-cost: in FEMA flood zone AE (mandatory federal flood insurance); severe wind risk, 99% chance of damaging wind over 30y; major wildfire risk; extreme-heat days projected 7→21/yr by 2055 (HVAC capex compounding) — expect insurance premiums to compound above CPI over the hold.
Questions for the listing agent
- What do current leases actually rent for vs. the listed asking? Can we see a recent rent roll and the last 12 months of T-12 income?
- What's the actual annual flood-insurance premium (NFIP or private), and is the property in a SFHA with mandatory coverage?
- Is there a deadline driving the sale (1031 exchange, divorce, estate, relocation)? That informs how much negotiation room exists.
- Schools are F-rated, which usually means shorter tenancies and higher turnover. Who's the typical renter profile here, and what's been the actual vacancy rate?
- What's the average days-on-market for RENTAL listings here right now (not sales)? A rising rental-DOM trend means longer vacancies and softer asking-rent achievability than the comps imply.
- What's the recent tenant-quality profile in this submarket — average credit score on applications, eviction rate, late-payment / NSF rate, and stable-employment percentage? A property-management company in the area should have these aggregated.
- How much new for-sale + rental construction is in the pipeline within 1–3 miles? Heavy new supply typically softens prices + rents 12–24 months out; constrained supply supports both.
Investment metrics
- 1% rule
- 1.19% ✓
- Cap rate
- 9.48%
- Cash-on-cash
- 11.38%
- DSCR
- 1.51
- GRM
- 7.0
CMA / ARV
- ARV (on-the-fly)
- $157,896
- Comps found
- 3
Show comp detail 3 sales within ~0.75 mi
| Address | Dist | Beds/Ba | Sqft | Sold | Price | $/sf | Match |
|---|---|---|---|---|---|---|---|
| 6173 W Adams St | 0.00mi | 3/2.0 | 1,836 (0%) | 1mo | $139,900 | $76 | 99 |
| 8470 Jeff Davis Dr | 0.65mi | 3/2.0 | 1,860 (+1%) | 21mo | $160,000 | $86 | 50 |
| 8015 Dazure St | 0.55mi | 2/1.0 (-1) | 1,595 (-13%) | 15mo | $168,000 | $105 | 31 |
Match score weights: distance 35% · size 25% · config 20% · recency 20%. Top-matched comps best support the ARV.
Projected returns pro-forma
-3.0% appreciation · 3.0% rent growth · sell at horizon
- IRR
- -18.8%
- Equity multiple
- 0.34×
- Total profit
- $-25,901
- Equity at exit
- $20,860
- IRR
- -10.9%
- Equity multiple
- 0.34×
- Total profit
- $-25,949
- Equity at exit
- $12,096
Cash invested: $39,172 (down + closing). Projections, not guarantees.
Landlord ↔ Tenant lean methodology
- Overall (STATE)
- 90 Strongly Landlord-Friendly
- State Mississippi
- 90 Strongly Landlord-Friendly · R+11
- County
- — inherits STATE
- City
- — inherits STATE
ZIP-level market 39520
- Active inventory
- 622
- Price-to-rent
- 7.0×
Monthly cashflow live
- Estimated rent
- $1,671 medium interval (Pro) →
- Mortgage (P&I)
- −$734
- Tax from tax record
- −$157 /mo · $1,880/yr
- Insurance
- −$58
- Flood insurance flood zone
- −$427 /mo · $5,118/yr
- HOA
- −$0
- Vacancy / Maint / Mgmt
- −$351
- Net cashflow
- $-55
Break-even live
Sensitivity live
| Price | -10% $24 | -5% $-15 | +0% $-55 | +5% $-95 | +10% $-134 |
|---|---|---|---|---|---|
| Rent | -10% $-187 | -5% $-121 | +0% $-55 | +5% $11 | +10% $77 |
| Rate | -1.0pp $15 | -0.5pp $-19 | base $-55 | +0.5pp $-91 | +1.0pp $-128 |
UW: 25.0% down · 7.5% · 30yr · 1.5% tax · 5.0% vac · 8.0% maint · 8.0% mgmt
Financing live
Cash to close
- Down payment
- $34,975
- Closing costs
- $4,197
- Reserves months
- —
- Total cash needed
- —
Loan-product check · same deal, 3 products live
Conventional
25% down · 7.5% · 30yr
- Down + closing
- —
- Monthly P&I
- —
- Monthly cashflow
- —
- DSCR
- —
- Eligible?
- —
Personal DTI + credit; lowest rate.
DSCR
20% down · 8.5% · 30yr
- Down + closing
- —
- Monthly P&I
- —
- Monthly cashflow
- —
- DSCR
- —
- Eligible?
- —
No personal income docs; deal must DSCR.
Hard money
10% down · 12.0% · 12mo
- Down + closing
- —
- Monthly P&I
- —
- Monthly cashflow
- —
- DSCR
- —
- Eligible?
- —
Short-term bridge; refi at stabilization.
Rent comps 2 comps
| Address | Beds | Baths | Sqft | Rent | $/sqft | DOM | Units | Dist |
|---|---|---|---|---|---|---|---|---|
| 6095 E Lamar St Bay Saint Louis, MS | 3.0 | 2.0 | 1392 | $1,645 | $1.18 | 45d | 1 | 0.69mi |
| 6004 E Jackson St Bay Saint Louis, MS | 3.0 | 2.0 | 1329 | $1,700 | $1.28 | 45d | 1 | 0.74mi |
Listing history 3 events
-
2026-04-16status Pending
-
2026-04-02$139,900 Active
-
2002-01-15soldstatus
ⓘ Source: listings_history table (triggers on properties + properties_extension) + one-shot
backfill from property_details.listing_events for pre-trigger history.
Tax reassessment forecast MS · Resets to sale price
- Current annual tax
- $1,880 · $157/mo
- Projected year-2 tax
- $1,880 · $157/mo
- Expected delta
- $0/yr ($0/mo · 0.0%)
ⓘ Screening estimate from a state-policy table — verify with the county assessor before closing.
Climate risk First Street
- Flood 6/10 Major FEMA zone AE · 64% chance over 30 yrs
- Wildfire 6/10 Major
- Heat 10/10 Extreme 7 d/yr ≥107°F today · 21 d/yr by 30 yrs out
- Wind 9/10 Extreme 99% chance of damaging wind over 30 yrs
- Air quality 1/10 Low 0 unhealthy d/yr today · 0 by 30 yrs out
Nearby sold comps map
Loading sold comps map…
Walkable amenities ~0.75 mi
Loading nearby amenities…
Taxation est. · year 1
- Rental income
- $20,052
- − Mortgage interest
- −$7,837
- − Property taxes
- −$1,880
- − Insurance
- −$5,818
- − Repairs & maintenance
- −$1,604
- − Management
- −$1,604
- − Depreciation
- −$4,070
- Taxable loss
- −$2,761
- Est. tax savings @ 24.0%
- +$663
- After-tax cash flow
- $2/yr
For passive investors: Depreciation is non-cash, so a rental often shows a tax loss while cash-flowing — sheltering income. Rental losses are passive: they offset passive income freely, and up to $25,000/yr can offset ordinary (W-2) income if you actively participate and your MAGI is under $100k (phasing out to $0 by $150k); unused losses carry forward. On sale, claimed depreciation is recaptured at up to 25%, and gains may owe capital-gains tax (a 1031 exchange can defer both). Figures are a year-1 estimate at your 24.0% rate — not tax advice; consult a CPA.
Schools (NCES district)
- District
- Hancock County School District
- NCES district ID
- 2801740
- Math proficiency
- 47% ▼ -11.00%
- Reading proficiency
- 44% ▼ -9.00%
- Median HH income
- $47,971
- Composite
- 38.88/100
- National rank
- #4099
- State rank
- #23 of 130 in MS
Livability — Waveland
- Score
- 61/100
- State rank
- #199
- US rank
- #18110
Category grades
Schools grade is shown separately in the Schools card above.
Census & demographics
- City population
- 6,249
- Population (ZIP)
- 15,471
Population outlook (Hancock County) Hauer SSP2
- Today (2025)
- 52,161 people
- By 2030
- 54,753 · +5.0%
- By 2040
- 59,242 · +13.6%
- By 2050
- 62,417 · +19.7%
- By 2075
- 68,168 · +30.7%
- By 2100
- 69,212 · +32.7%
Race, ethnicity, and origin ACS 2023
- Neighborhood character
- Predominantly White (80%)
- Race & ethnicity
- White 80% Black 11% Two or more races 6% Hispanic / Latino 3% Asian 1%
- Common ancestry
- Lithuanian 15% Romanian 2% Serbian 2%
- Foreign-born
- 3% · Canada, China
- Languages at home
- 96% English-only · Spanish 2% Chinese 1%
Political lean MEDSL · Hancock
- 2024 margin
- Solid R (+58.7) · D 20.1% · R 78.8% · Other 1.1%
- 2008→2024 swing
- -4.4pp toward R · 2008: -54.2pp · 2024: -58.7pp
- All cycles
- 2024: R+58.7 2020: R+55.5 2016: R+59.4 2012: R+52.8 2008: R+54.2
Not yet ingested
- Civics
- —
Market trends
- HPI YoY
- ▼ -169.80%
- Current HPI
- 227.2103
- Rent YoY
- —
- Metro
- —
- State GDP YoY
- —
- F500 in state
- 0
Price history
3 events — show timeline
- 2026-04-16 Pending — MLSU
- 2026-04-02 Listed $139,900 MLSU
- 2002-01-15 Sold (Public Records) — Public Records
Property tax history
+17.8%/yrLatest (2025): $1,880 · +0.0% YoY. Source: county tax records.
Cash-flow waterfall
monthlySold comps — $/sqft
last 12 mo · ≤1 miLoading sold comps…