 Duplex
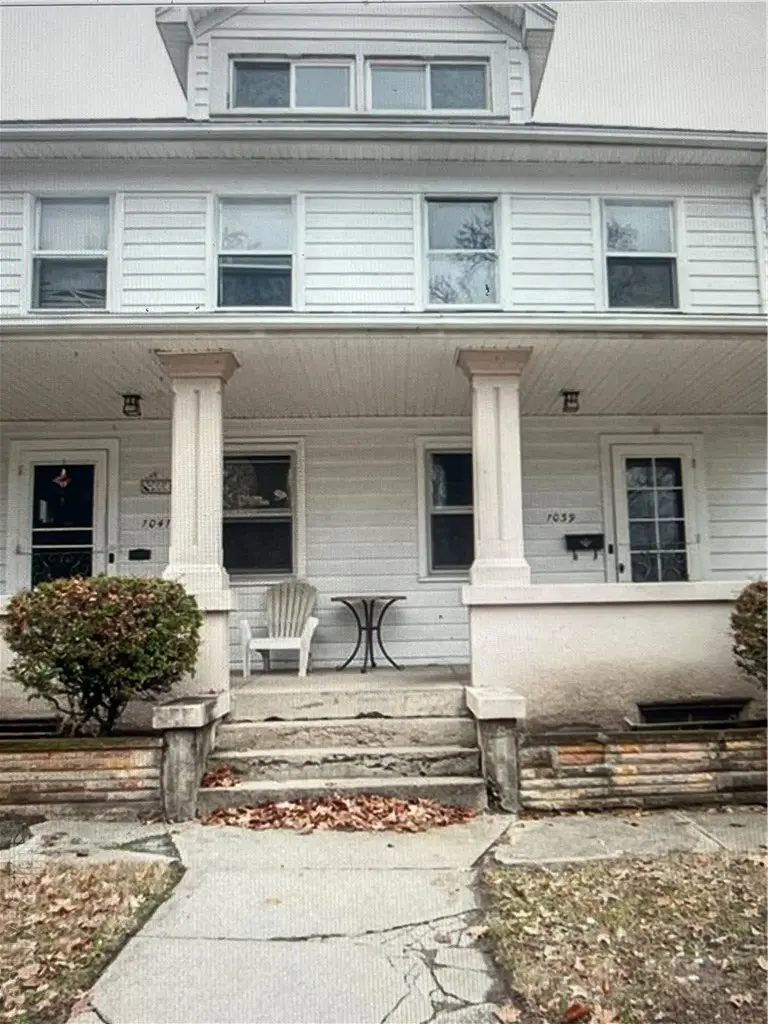
1039 - 1041 Highland Ave · Dayton, OH
Flood risk 1/10 · Minimal
- FEMA flood zone
- X (unshaded)
- Chance of flooding over 30 yrs
- 0.0%
- Est. flood insurance / yr
- $473 – $860
Fire risk 1/10 · Minimal
- Est. fire insurance / yr
- $713 – $1,323
Heat risk 4/10 · Minor
- Hot days now (above 101°F)
- 7 days/yr
- Hot days in 30 yrs
- 18 days/yr
Wind risk 2/10 · Minimal
- Chance of severe wind over 30 yrs
- 0.0%
Air-quality risk 3/10 · Minor
- Unhealthy air days now
- 3 days/yr
- Unhealthy air days in 30 yrs
- 5 days/yr
Risk factors via First Street. Map © Google.
Why this score? — see what drove the C grade
The composite is a weighted blend of 9 inputs, each scored 0–100. Each bar is that input's sub-score; the figure is the points it added to the 100-point composite (weight × sub-score).
- Cash flow +27.7/30.0
- DSCR +9.8/10.0
- 1% rule +7.2/10.0
- Rent growth +5.0/5.0
- Livability +3.2/5.0
- Condition / age +2.5/5.0
- Schools +1.3/10.0
- ARV discount +0.0/15.0
- Appreciation +0.0/10.0
$208,000
🖨 Deal sheet 📄 Offer letter ✓ Due diligence
Multi-family units
County records classify this as Multi-Family (2-4 Unit). Listing-text estimate: 2 units. confirmed
Listing remarks
Welcome to 1039-1041 Highland Ave. A fully rented duplex with current month to month tenants. Each side has 3 bedrooms and 1 bath. When you walk in, you enter into a large living room that flows right into the formal dining room. The kitchen rounds out the first floor. Upstairs is where the nicely sized bedrooms and bath are located. Both units have access to a divided unfinished basement. The 1039 side has access to a fully finished attic space that has been plumbed for an addtional bathroom. There is a 3 car detached garage with a full 2nd story for extra storage. Please allow 24 hours notice for all showings. 1039 is viewable. 1041 can be viewed once a contract has been accepted. Some up
Key facts
- Formal dining room
- Fully rented duplex
- Large living room
Tags
Property features AI
Finance
- Other: Two-unit multifamily property in one building
- Financial info: Offered for sale
- HOA & community: No HOA details provided
Exterior
- Parking: Detached garage; 3 garage spaces
- Security: No security details provided
- Utilities: Natural gas available; Public water; Sewer available
- Home design: Two-story building; Wood siding exterior
- Construction: Wood siding construction; Foundation details not provided; Year built not provided
- Exterior features: Residential zoning; Lot dimensions approximately 43 x 137
Interior
- Kitchen: No specific appliance details provided
- Bedrooms: Two-bedroom units (2 total units)
- Flooring: No flooring details provided
- Bathrooms: Two full bathrooms (total)
- Heating & cooling: Forced air heating with natural gas; Central air conditioning
- Interior features: Full unfinished basement
- Laundry & utility: No specific laundry details provided
Neighborhood map
What this means for you Summary
Snapshot
- This is a 2 × 3-bed/1.0-bath units multifamily listed at $208k.
Deal economics
- At list price, monthly cash flow is $629 ($8k/yr) — positive. Per door: $315/mo.
- The deal already cash-flows at list — no discount required.
- Meets the 1% rule at list price ($3k rent vs $208k).
- Recommended offer: $202k (3.0% below list) — sets the bar for market timing.
- Cap rate 9.9% vs local median 7.4% in Dayton — top-decile yield for the area; either an underpriced asset or a hidden risk that comps aren't pricing in. Stress-test before assuming the spread holds.
Location & tenants
- Location reads 65/100 on livability (#716 in OH) — a middle-class / working-renter tenant base. Strengths: cost of living A+, housing A+, health & safety A; Watch: schools C-, amenities C-, crime F.
- Dayton City (urban): math 12% / reading 21% proficiency, ranked #641 of 656 in OH (top 98%) — low school quality limits family demand, transient renter base, plan for 1-2y turnover; 74% free/reduced lunch — lower-income household profile, screen leases tightly.
- Market conditions: Rents rising fast (+11.4%/yr); 92 active listings in the ZIP; 1 comparable units currently listed for rent nearby; 907 units permitted in Montgomery County in 2024 (416 in 5+ unit buildings).
- At $2,537/mo this rent would consume 65% of the median local household income ($47k/yr) (locally 961% of renters already pay >50% of income on rent) — very limited rent-growth headroom before tenants either downsize or default.
Forward outlook
- Local home prices are declining (-3.0%/yr); year-one equity from $1k of loan paydown is wiped out by about $6k of value loss. Plan a longer hold.
- Montgomery County population projected at -10% by 2050 — secular population decline; favor cash flow + early exit over multi-decade hold.
- At projected returns (-3.0% appreciation + 8.0% rent growth), your $58k cash investment doubles in ~7 years — after that, you're playing with house money.
Negotiation context
- It's been on market 33 days — a 3% lower offer ($202k) is reasonable based on typical stale-listing flexibility.
- Current owner paid $115k; list at $208k implies a 80% gain — meaningful room to come down on a strong offer.
Risks & watch-outs
- Watch-outs: built in 1916 — expect roof / HVAC / electrical / plumbing capex.
Questions for the listing agent
- It's been on market 33 days. Have you received any prior offers? Is the seller open to a 3% concession, seller financing, or rate buy-down credit?
- Can we see the unit-by-unit rent roll, current vacancy, and any below-market leases? What's the average tenancy length?
- What capital expenditures (roof, boiler, parking lot, exteriors) have been made in the last 5 years, and what's planned in the next 2?
- Built in 1916 — when were the roof, HVAC, electrical panel, plumbing, and water heater last replaced?
- Is there a deadline driving the sale (1031 exchange, divorce, estate, relocation)? That informs how much negotiation room exists.
- Crime grade is F in this area — have there been break-ins, vandalism, or insurance claims at this property in the last 3 years? What carrier currently insures it and at what premium?
- What's the average days-on-market for RENTAL listings here right now (not sales)? A rising rental-DOM trend means longer vacancies and softer asking-rent achievability than the comps imply.
- What's the recent tenant-quality profile in this submarket — average credit score on applications, eviction rate, late-payment / NSF rate, and stable-employment percentage? A property-management company in the area should have these aggregated.
- How much new apartment / multifamily construction is in the pipeline within 1–3 miles? Heavy new supply (>2% of stock underway) typically softens rents 12–24 months out; light construction supports rent growth.
Investment metrics
- 1% rule
- 1.22% ✓
- Cap rate
- 9.92%
- Cash-on-cash
- 12.96%
- DSCR
- 1.58
- GRM
- 6.8
CMA / ARV
- ARV (median comp)
- $161,730
- List price
- $208,000
- Delta
- 28.61%
- Verdict
- OVERPRICED
- Comps
- 20 within 1.0 mi
Show comp detail 12 sales within ~0.75 mi
| Address | Dist | Beds/Ba | Sqft | Sold | Price | $/sf | Match |
|---|---|---|---|---|---|---|---|
| 1053 Highland Ave #1051 | 0.02mi | 6/2.0 | 2,520 (-5%) | 8mo | $155,000 | $62 | 83 |
| 1355 Epworth Ave #1353 | 0.37mi | 6/2.0 | 2,664 (+0%) | 8mo | $145,000 | $54 | 76 |
| 332 Gunckel Ave | 0.35mi | 6/2.0 | 2,718 (+2%) | 8mo | $145,000 | $53 | 74 |
| 821 Carlisle Ave | 0.40mi | 6/2.5 | 2,538 (-5%) | 3mo | $158,000 | $62 | 70 |
| 1056 Pritz Ave #1054 | 0.10mi | 6/2.0 | 2,422 (-9%) | 16mo | $197,000 | $81 | 68 |
| 1044 Pritz Ave #1042 | 0.09mi | 6/2.0 | 2,402 (-10%) | 15mo | $160,000 | $67 | 67 |
| 2105-2107 Wyoming St | 0.32mi | 6/2.0 | 2,964 (+11%) | 5mo | $180,000 | $61 | 62 |
| 636, 638 Saint Joseph Ave | 0.19mi | 6/2.0 | 2,364 (-11%) | 15mo | $128,000 | $54 | 60 |
| 1300-1302 Carlisle Ave | 0.45mi | 6/2.0 | 2,368 (-11%) | 8mo | $172,000 | $73 | 54 |
| 1428 Xenia Ave #1426 | 0.51mi | 6/2.0 | 2,848 (+7%) | 22mo | $179,900 | $63 | 46 |
| 526 Pierce St #524 | 0.47mi | 6/2.0 | 2,292 (-14%) | 20mo | $65,000 | $28 | 39 |
| 2510 Saint Charles Ave #2508 | 0.69mi | 6/2.0 | 2,464 (-7%) | 22mo | $127,000 | $52 | 37 |
Match score weights: distance 35% · size 25% · config 20% · recency 20%. Top-matched comps best support the ARV.
Projected returns pro-forma
-3.0% appreciation · 8.0% rent growth · sell at horizon
- IRR
- 8.2%
- Equity multiple
- 1.34×
- Total profit
- $19,770
- Equity at exit
- $31,013
- IRR
- 21.3%
- Equity multiple
- 3.23×
- Total profit
- $129,832
- Equity at exit
- $17,984
Cash invested: $58,240 (down + closing). Projections, not guarantees.
Landlord ↔ Tenant lean methodology
- Overall (STATE)
- 73 Landlord-Friendly
- State Ohio
- 73 Landlord-Friendly · R+6
- County
- — inherits STATE
- City
- — inherits STATE
ZIP-level market 45410
- Home prices YoY
- -21.4%
- Rents YoY
- 11.4%
- Active inventory
- 92
- Price-to-rent
- 13.7×
Monthly cashflow live
- Estimated rent
- $2,537 high interval (Pro) →
- Mortgage (P&I)
- −$1,091
- Tax from tax record
- −$198 /mo · $2,372/yr
- Insurance
- −$87
- HOA
- −$0
- Vacancy / Maint / Mgmt
- −$533
- Net cashflow
- $629
Break-even live
2-unit breakdown (identical units grouped — click to expand)
| Units | Beds | Baths | Est. rent |
|---|---|---|---|
| 2× units | 3 | 1 | $2,538 |
| #1 | 3 | 1 | $1,269 |
| #2 | 3 | 1 | $1,269 |
| Total (2 units) | $2,537 | ||
UW: 25.0% down · 7.5% · 30yr · 1.5% tax · 5.0% vac · 8.0% maint · 8.0% mgmt
Financing live
Cash to close
- Down payment
- $52,000
- Closing costs
- $6,240
- Reserves months
- —
- Total cash needed
- —
Loan-product check · same deal, 3 products live
Conventional
25% down · 7.5% · 30yr
- Down + closing
- —
- Monthly P&I
- —
- Monthly cashflow
- —
- DSCR
- —
- Eligible?
- —
Personal DTI + credit; lowest rate.
DSCR
20% down · 8.5% · 30yr
- Down + closing
- —
- Monthly P&I
- —
- Monthly cashflow
- —
- DSCR
- —
- Eligible?
- —
No personal income docs; deal must DSCR.
Hard money
10% down · 12.0% · 12mo
- Down + closing
- —
- Monthly P&I
- —
- Monthly cashflow
- —
- DSCR
- —
- Eligible?
- —
Short-term bridge; refi at stabilization.
Rent comps 1 comps
| Address | Beds | Baths | Sqft | Rent | $/sqft | DOM | Units | Dist |
|---|---|---|---|---|---|---|---|---|
| 1422 E 3rd St Dayton, OH | 6.0 | 3.0 | 3327 | $1,800 | $0.54 | 14d | 1 | 1.33mi |
Listing history 5 events
-
2026-05-03historical ActiveUnderContract 881-char remark
-
2026-04-24$208,000 Active 881-char remark
-
2020-02-11soldstatus $115,333
-
1984-04-26soldstatus $38,500
-
1984-04-26soldstatus $38,500
ⓘ Source: listings_history table (triggers on properties + properties_extension) + one-shot
backfill from property_details.listing_events for pre-trigger history.
Tax reassessment forecast OH · Partial reset (capped growth)
- Current annual tax
- $2,372 · $198/mo
- Projected year-2 tax
- $2,809 · $234/mo
- Expected delta
- +$436/yr (+$36/mo · 18.4%)
ⓘ Screening estimate from a state-policy table — verify with the county assessor before closing.
Climate risk First Street
- Flood 1/10 Low FEMA zone X (unshaded) · 0% chance over 30 yrs
- Wildfire 1/10 Low
- Heat 4/10 Moderate 7 d/yr ≥101°F today · 18 d/yr by 30 yrs out
- Wind 2/10 Low 0% chance of damaging wind over 30 yrs
- Air quality 3/10 Moderate 3 unhealthy d/yr today · 5 by 30 yrs out
Nearby sold comps map
Loading sold comps map…
Walkable amenities ~0.75 mi
Loading nearby amenities…
Taxation est. · year 1
- Rental income
- $30,444
- − Mortgage interest
- −$11,651
- − Property taxes
- −$2,372
- − Insurance
- −$1,040
- − Repairs & maintenance
- −$2,436
- − Management
- −$2,436
- − Depreciation
- −$6,051
- Taxable income
- $4,459
- Est. tax owed @ 24.0%
- −$1,070
- After-tax cash flow
- $6,479/yr
For passive investors: Depreciation is non-cash, so a rental often shows a tax loss while cash-flowing — sheltering income. Rental losses are passive: they offset passive income freely, and up to $25,000/yr can offset ordinary (W-2) income if you actively participate and your MAGI is under $100k (phasing out to $0 by $150k); unused losses carry forward. On sale, claimed depreciation is recaptured at up to 25%, and gains may owe capital-gains tax (a 1031 exchange can defer both). Figures are a year-1 estimate at your 24.0% rate — not tax advice; consult a CPA.
Schools (NCES district)
- District
- Dayton City
- NCES district ID
- 3904384
- Math proficiency
- 12% ▼ -12.00%
- Reading proficiency
- 21% ▼ -11.00%
- Median HH income
- $28,688
- Composite
- 12.94/100
- National rank
- #9579
- State rank
- #641 of 656 in OH
Livability — Dayton
- Score
- 65/100
- State rank
- #716
- US rank
- #12895
Category grades
Schools grade is shown separately in the Schools card above.
Census & demographics
- Census place
- Dayton, OH
- County
- Montgomery County · 459,541 people
- City population
- 164,387
- Metro
- Dayton-Kettering, OH
- Population (ZIP)
- 14,694
- Household income
- $46,651
- Rent vs Own
- Severe rent burden
- 961.0
Population outlook (Montgomery County) Hauer SSP2
- Today (2025)
- 523,241 people
- By 2030
- 514,948 · -1.6%
- By 2040
- 493,378 · -5.7%
- By 2050
- 469,639 · -10.2%
- By 2075
- 418,360 · -20.0%
- By 2100
- 353,315 · -32.5%
Race, ethnicity, and origin ACS 2023
- Neighborhood character
- Predominantly White (71%)
- Race & ethnicity
- White 71% Black 15% Hispanic / Latino 7% Two or more races 6% Asian 1%
- Hispanic origin (detail)
- Mexican 3%
- Common ancestry
- Lithuanian 2% Iranian 2% Slovak 2%
- Foreign-born
- 5% · Canada, United Kingdom
- Languages at home
- 91% English-only · Spanish 6% Tagalog/Filipino 1% Other Asian/Pacific 1%
Political lean MEDSL · Montgomery
- 2024 margin
- Toss-up / Even · D 49.8% · R 49.3%
- 2008→2024 swing
- -5.8pp toward R · 2008: 6.2pp · 2024: 0.5pp
- All cycles
- 2024: D+0.5 2020: D+2.2 2016: R+1.2 2012: D+3.1 2008: D+6.2
Not yet ingested
- Civics
- —
Market trends
- HPI YoY
- ▼ -100.61%
- Current HPI
- 369.3938
- Rent YoY
- ▲ 11.37%
- Metro
- Dayton-Kettering, OH
- State GDP YoY
- ▲ 1.98%
- F500 in state
- 48
Industry mix (Fortune 500 HQ in OH)
| Industry | F500 HQs | Revenue |
|---|---|---|
| Insurance | 3 | $145B |
|
||
| Industrial Machinery | 3 | $49B |
|
||
| Financial Services | 3 | $24B |
|
||
| Consumer Goods | 2 | $93B |
|
||
| Aerospace / Defense | 2 | $47B |
|
||
| Utilities | 2 | $33B |
|
||
Price history
+440.3% since first listed6 events — show timeline
- 2026-05-28 Pending — Dayton MLS
- 2026-05-03 Contingent — Dayton MLS
- 2026-04-24 Listed $208,000 Dayton MLS
- 2020-02-11 Sold (Public Records) $115,333 Public Records
- 1984-04-26 Sold (Public Records) $38,500 Public Records
- 1984-04-26 Sold (Public Records) $38,500 Public Records
Property tax history
+2.5%/yrLatest (2025): $2,372 · -0.2% YoY. Source: county tax records.
Cash-flow waterfall
monthlySold comps — $/sqft
last 12 mo · ≤1 miLoading sold comps…