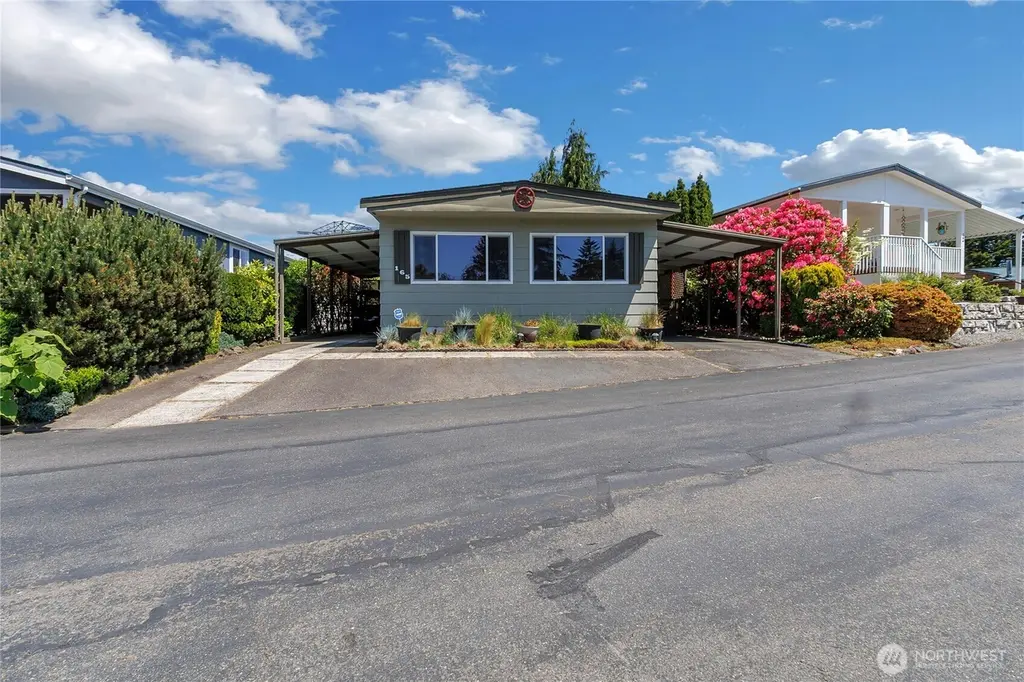
2101 S 324th St #165 · Federal Way, WA
Flood risk 1/10 · Minimal
- FEMA flood zone
- X (unshaded)
- Chance of flooding over 30 yrs
- 0.0%
- Est. flood insurance / yr
- $473 – $860
Fire risk 1/10 · Minimal
- Est. fire insurance / yr
- $604 – $1,122
Heat risk 3/10 · Minor
- Hot days now (above 87°F)
- 7 days/yr
- Hot days in 30 yrs
- 15 days/yr
Wind risk 1/10 · Minimal
- Chance of severe wind over 30 yrs
- —
Air-quality risk 7/10 · Major
- Unhealthy air days now
- 10 days/yr
- Unhealthy air days in 30 yrs
- 11 days/yr
Risk factors via First Street. Map © Google.
Why this score? — see what drove the B grade
The composite is a weighted blend of 9 inputs, each scored 0–100. Each bar is that input's sub-score; the figure is the points it added to the 100-point composite (weight × sub-score).
- Cash flow +30.0/30.0
- 1% rule +10.0/10.0
- DSCR +10.0/10.0
- ARV discount +7.5/15.0
- Schools +3.9/10.0
- Livability +3.6/5.0
- Rent growth +3.1/5.0
- Condition / age +2.5/5.0
- Appreciation +0.0/10.0
$125,000
🖨 Deal sheet (PDF) 📄 Offer letter ✓ Due diligence
Listing remarks
Experience resort-style living in the highly popular Belmor Park 55+ gated community! This beautifully maintained 2-bedroom, 1.75-bath home is ideally situated just beyond the front gate, overlooking the green of the 1st hole. It offers peaceful golf course views and a serene setting you’ll love coming home to. This home offers 1,320 sq ft of comfortable living space and has been carefully maintained. It features updated kitchen cabinets and garbage disposal, freshly painted interior, and a professionally serviced heat pump with A/C for reliable comfort. Includes washer and dryer. Outside, enjoy the covered deck or unwind in your lovely park-like herb garden. There is also parking ava
Key facts
- Gated community
- Covered deck
- Herb garden
Tags
Property features AI
Finance
- Other: Buyer to verify school assignments; Bus line nearby
- Financial info: Land lease amount: $1,391; Listing terms: Cash or Conventional
- HOA & community: Belmor Mobile Home Park with 336 homes; Senior community (senior community designation); Pets allowed (cats and dogs); Park amenities: BBQs, clubhouse, common area, exercise room, golf, high-speed internet available, pool, recreational area, RV parking, security gate, spa/hot tub
Exterior
- Parking: Carport; Uncovered parking; RV parking (park amenity)
- Security: Security gate
- Utilities: Electric energy source; Public water; Public sewer; Power provided by PSE; Water heater is electric
- Home design: Manufactured home (double wide); One level; Cambridge 55/24 model; Metal skirt; Good condition; Mobile home remains
- Construction: Wood construction; Composition roof; Tie down foundation; Manufactured after 6/15/1976
- Exterior features: Wood exterior; Wood products; Awnings; Landscaped; Patio/Porch/Deck; Has view; Spa/Hot Tub
Interior
- Kitchen: Dishwasher; Garbage disposal; Refrigerator; Stove/Range
- Bedrooms: 2 bedrooms
- Flooring: Vinyl; Carpet
- Bathrooms: 1 full bathroom; 1 three-quarter bathroom; 1 bathtub; 2 showers
- Heating & cooling: Heat pump for heating and cooling
- Interior features: Water heater (located in outside closet); Tie down foundation
- Laundry & utility: Washer; Dryer; Utility room
Neighborhood map
What this means for you Summary
Snapshot
- This is a 2-bed/2.0-bath manufactured listed at $125k.
Deal economics
- At list price, monthly cash flow is $909 ($11k/yr) — positive.
- The deal already cash-flows at list — no discount required.
- Meets the 1% rule at list price ($2k rent vs $125k).
- Recommended offer: $123k (1.5% below list) — sets the bar for market timing.
- Cap rate 15.0% vs local median 2.7% in Federal Way — top-decile yield for the area; either an underpriced asset or a hidden risk that comps aren't pricing in. Stress-test before assuming the spread holds.
Location & tenants
- Location reads 71/100 on livability (#221 in WA) — a middle-class / working-renter tenant base. Strengths: commute A+, housing A+, health & safety A+; Watch: schools C-, crime F, cost of living F.
- Federal Way School District (suburban): math 35% / reading 47% proficiency, ranked #207 of 291 in WA (top 71%) — families likely to look elsewhere, expect single-tenant / working-renter base with shorter leases.
- Market conditions: Rents rising (+2.3%/yr); 233 active listings in the ZIP; 23 comparable units currently listed for rent nearby; rentals leasing fast (median 7d on market — plan ~1-2 weeks tenant-placement turnaround); solid renter incomes; 10,555 units permitted in King County in 2024 (7,119 in 5+ unit buildings).
- This rent runs 36% of the median local income ($75k/yr) — at the standard rent-burdened threshold; future hikes will face affordability resistance.
Forward outlook
- Local home prices are declining (-3.0%/yr); year-one equity from $864 of loan paydown is wiped out by about $4k of value loss. Plan a longer hold.
- King County population projected at +44% by 2050 — long-run rental-demand tailwind backs the buy-and-hold thesis.
- At projected returns (-3.0% appreciation + 2.3% rent growth), your $35k cash investment doubles in ~4 years — after that, you're playing with house money.
Negotiation context
- It's been on market 23 days — a 2% lower offer ($123k) is reasonable based on typical stale-listing flexibility.
- 4 sale attempts since 18y ago with the ask held roughly flat each time — persistent listings suggest the price (not the market) is what's stuck; bring a comps-based counter.
- Current owner paid $36k; list at $125k implies a 242% gain — meaningful room to come down on a strong offer.
Questions for the listing agent
- Built in 1968 — when were the roof, HVAC, electrical panel, plumbing, and water heater last replaced?
- Is there a deadline driving the sale (1031 exchange, divorce, estate, relocation)? That informs how much negotiation room exists.
- Crime grade is F in this area — have there been break-ins, vandalism, or insurance claims at this property in the last 3 years? What carrier currently insures it and at what premium?
- What's the average days-on-market for RENTAL listings here right now (not sales)? A rising rental-DOM trend means longer vacancies and softer asking-rent achievability than the comps imply.
- What's the recent tenant-quality profile in this submarket — average credit score on applications, eviction rate, late-payment / NSF rate, and stable-employment percentage? A property-management company in the area should have these aggregated.
- How much new for-sale + rental construction is in the pipeline within 1–3 miles? Heavy new supply typically softens prices + rents 12–24 months out; constrained supply supports both.
Investment metrics
- 1% rule
- 1.79% ✓
- Cap rate
- 15.02%
- Cash-on-cash
- 31.16%
- DSCR
- 2.39
- GRM
- 4.6
CMA / ARV
- ARV (on-the-fly)
- $282,480
- Comps found
- 12
Show comp detail 12 sales within ~0.75 mi
| Address | Dist | Beds/Ba | Sqft | Sold | Price | $/sf | Match |
|---|---|---|---|---|---|---|---|
| 2101 S 324th St #102 | 0.00mi | 2/2.0 | 1,344 (+2%) | 10mo | $249,900 | $186 | 88 |
| 2101 S 324th St #107 | 0.00mi | 2/2.0 | 1,248 (-6%) | 7mo | $152,500 | $122 | 85 |
| 32820 20th Ave S #35 | 0.17mi | 2/2.0 | 1,344 (+2%) | 7mo | $315,000 | $234 | 83 |
| 32820 20th Ave S #18 | 0.17mi | 3/2.0 (+1) | 1,296 (-2%) | 3mo | $327,500 | $253 | 81 |
| 2101 S 324th St #109 | 0.00mi | 2/2.0 | 1,250 (-5%) | 12mo | $90,000 | $72 | 81 |
| 2101 S 324th St #232 | 0.00mi | 2/2.0 | 1,392 (+6%) | 12mo | $199,000 | $143 | 81 |
| 2101 S 324th St #164 | 0.00mi | 3/2.0 (+1) | 1,404 (+6%) | 4mo | $300,000 | $214 | 81 |
| 2101 S 324th St #185 | 0.00mi | 2/2.0 | 1,231 (-7%) | 10mo | $229,950 | $187 | 80 |
| 32820 20th Ave S #24 | 0.17mi | 2/2.0 | 1,400 (+6%) | 3mo | $360,000 | $257 | 79 |
| 2101 S 324th St #193 | 0.00mi | 2/2.0 | 1,176 (-11%) | 11mo | $279,000 | $237 | 73 |
| 2101 S 324TH #215 | 0.00mi | 2/2.0 | 1,152 (-13%) | 12mo | $172,500 | $150 | 69 |
| 2101 S 324th St #163 | 0.00mi | 3/2.0 (+1) | 1,458 (+10%) | 11mo | $319,000 | $219 | 69 |
Match score weights: distance 35% · size 25% · config 20% · recency 20%. Top-matched comps best support the ARV.
Projected returns pro-forma
-3.0% appreciation · 2.33% rent growth · sell at horizon
- IRR
- 25.2%
- Equity multiple
- 2.03×
- Total profit
- $36,152
- Equity at exit
- $18,638
- IRR
- 32.6%
- Equity multiple
- 3.86×
- Total profit
- $100,060
- Equity at exit
- $10,808
Cash invested: $35,000 (down + closing). Projections, not guarantees.
Landlord ↔ Tenant lean methodology
- Overall (STATE)
- 28 Tenant-Leaning
- State Washington
- 28 Tenant-Leaning · D+8
- County
- — inherits STATE
- City
- — inherits STATE
ZIP-level market 98003
- Rents YoY
- 2.3%
- Active inventory
- 233
- Price-to-rent
- 4.6×
Monthly cashflow live
- Estimated rent
- $2,244 high interval (Pro) →
- Mortgage (P&I)
- −$656
- Tax est. 1.5%
- −$156 /mo · $1,875/yr
- Insurance
- −$52
- HOA
- −$0
- Vacancy / Maint / Mgmt
- −$471
- Net cashflow
- $909
Break-even live
Sensitivity live
| Price | -10% $995 | -5% $952 | +0% $909 | +5% $866 | +10% $822 |
|---|---|---|---|---|---|
| Rent | -10% $731 | -5% $820 | +0% $909 | +5% $997 | +10% $1,086 |
| Rate | -1.0pp $972 | -0.5pp $941 | base $909 | +0.5pp $876 | +1.0pp $843 |
UW: 25.0% down · 7.5% · 30yr · 1.5% tax · 5.0% vac · 8.0% maint · 8.0% mgmt
Financing live
Cash to close
- Down payment
- $31,250
- Closing costs
- $3,750
- Reserves months
- —
- Total cash needed
- —
Loan-product check · same deal, 3 products live
Conventional
25% down · 7.5% · 30yr
- Down + closing
- —
- Monthly P&I
- —
- Monthly cashflow
- —
- DSCR
- —
- Eligible?
- —
Personal DTI + credit; lowest rate.
DSCR
20% down · 8.5% · 30yr
- Down + closing
- —
- Monthly P&I
- —
- Monthly cashflow
- —
- DSCR
- —
- Eligible?
- —
No personal income docs; deal must DSCR.
Hard money
10% down · 12.0% · 12mo
- Down + closing
- —
- Monthly P&I
- —
- Monthly cashflow
- —
- DSCR
- —
- Eligible?
- —
Short-term bridge; refi at stabilization.
Rent comps 23 comps
| Address | Beds | Baths | Sqft | Rent | $/sqft | DOM | Units | Dist |
|---|---|---|---|---|---|---|---|---|
| 32905 19th Pl S Federal Way, WA | 1.0–3.0 | 1.0–2.0 | 937 | $2,104 | $2.24 | 0d | 16 | 0.19mi |
| 33016 17th Pl S Unit B302 Federal Way, WA | 2.0 | 1.0 | 886 | $1,785 | $2.01 | 12d | 1 | 0.41mi |
| 2100 S 336th St Unit P5 Federal Way, WA | 2.0 | 2.5 | 918 | $2,500 | $2.72 | 4d | 1 | 0.49mi |
| 2100 S 336th St Unit C1 Federal Way, WA | 3.0 | 2.5 | 1460 | $4,000 | $2.74 | 45d | 1 | 0.49mi |
| 33311 18th Ln S Federal Way, WA | 1.0–3.0 | 1.0–2.0 | 950 | $1,812 | $1.91 | 3d | 7 | 0.55mi |
| 31701 Pete Von Reichbauer Way S Federal Way, WA | 2.0 | 1.0 | 721 | $2,142 | $2.97 | 6d | 1 | 0.63mi |
| 2517 S 316th Ln Federal Way, WA | 1.0–2.0 | 1.0–2.0 | 825 | $2,010 | $2.44 | 0d | 4 | 0.71mi |
| 31408 28th Ave S Federal Way, WA | 3.0 | 2.5–3.5 | 1864 | $2,900 | $1.56 | 4d | 5 | 0.82mi |
| 1066 S 320th St Federal Way, WA | 1.0–3.0 | 1.0–2.0 | 1088 | $2,016 | $1.85 | 3d | 7 | 0.84mi |
| 32305 10th Pl S Federal Way, WA | 3.0 | 1.5 | 1320 | $3,200 | $2.42 | 45d | 1 | 0.86mi |
| 3634 S 334th St Federal Way, WA | 3.0 | 1.0 | 1540 | $2,900 | $1.88 | 45d | 1 | 0.88mi |
| 1201 S 336th St Federal Way, WA | 1.0–4.0 | 1.0–2.0 | 1094 | $2,016 | $1.84 | 0d | 10 | 0.96mi |
| 31655 Military Rd S Auburn, WA | 1.0–4.0 | 1.0–2.0 | 1032 | $2,016 | $1.95 | 0d | 8 | 1.02mi |
| 31750 7th Pl S Federal Way, WA | 3.0 | 1.0 | 1280 | $2,600 | $2.03 | 45d | 1 | 1.09mi |
| 30813 19th Pl S Federal Way, WA | 2.0 | 1.0 | 900 | $2,195 | $2.44 | 3d | 1 | 1.16mi |
| 1916 S 308th St Federal Way, WA | 3.0 | 1.0 | 1040 | $2,395 | $2.30 | 45d | 1 | 1.21mi |
| 32836 3rd Pl S Federal Way, WA | 2.0 | 2.0 | 1080 | $2,150 | $1.99 | 12d | 1 | 1.21mi |
| 1650 S 308th St Federal Way, WA | 1.0–2.0 | 1.0 | 850 | $1,495 | $1.76 | 6d | 3 | 1.27mi |
| 30602 Pacific Hwy S Federal Way, WA | 1.0–2.0 | 1.0–1.5 | 950 | $1,695 | $1.78 | 0d | 15 | 1.32mi |
| 1737 S 305th Pl Unit 4 Federal Way, WA | 2.0 | 1.0 | 950 | $2,000 | $2.11 | 45d | 1 | 1.36mi |
| 117 S 330th St Federal Way, WA | 2.0 | 1.0–2.0 | 1050 | $1,695 | $1.61 | 6d | 1 | 1.42mi |
| 33131 1st Ave SW Federal Way, WA | 1.0–2.0 | 1.0–2.0 | 818 | $2,215 | $2.71 | 0d | 13 | 1.46mi |
| 32420 1st Ln SW Federal Way, WA | 2.0 | 1.0 | 980 | $2,050 | $2.09 | 21d | 1 | 1.48mi |
Listing history 14 events
-
2026-06-21days on market $125,000 Active 23 DOM
-
2026-06-18days on market $125,000 Active 20 DOM
-
2026-06-17days on market $125,000 Active 19 DOM
-
2026-06-16days on market $125,000 Active 18 DOM
-
2026-06-15days on market $125,000 Active 17 DOM
-
2026-06-13days on market $125,000 Active 15 DOM
-
2026-06-09days on market $125,000 Active 11 DOM
-
2026-06-08days on market $125,000 Active 10 DOM
-
2026-06-07days on market $125,000 Active 9 DOM
-
2026-06-04days on market $125,000 Active 6 DOM
-
2026-06-03days on market $125,000 Active 5 DOM
-
2026-06-02days on market $125,000 Active 4 DOM
-
2026-06-01days on market $125,000 Active 3 DOM
-
2026-05-31days on market $125,000 Active 2 DOM
ⓘ Source: listings_history table (triggers on properties + properties_extension) + one-shot
backfill from property_details.listing_events for pre-trigger history.
Climate risk First Street
- Flood 1/10 Low FEMA zone X (unshaded) · 0% chance over 30 yrs
- Wildfire 1/10 Low
- Heat 3/10 Moderate 7 d/yr ≥87°F today · 15 d/yr by 30 yrs out
- Wind 1/10 Low
- Air quality 7/10 Severe 10 unhealthy d/yr today · 11 by 30 yrs out
Nearby sold comps map
Loading sold comps map…
Walkable amenities ~0.75 mi
Loading nearby amenities…
Taxation est. · year 1
- Rental income
- $26,925
- − Mortgage interest
- −$7,002
- − Property taxes
- −$1,875
- − Insurance
- −$625
- − Repairs & maintenance
- −$2,154
- − Management
- −$2,154
- − Depreciation
- −$3,636
- Taxable income
- $9,479
- Est. tax owed @ 24.0%
- −$2,275
- After-tax cash flow
- $8,630/yr
For passive investors: Depreciation is non-cash, so a rental often shows a tax loss while cash-flowing — sheltering income. Rental losses are passive: they offset passive income freely, and up to $25,000/yr can offset ordinary (W-2) income if you actively participate and your MAGI is under $100k (phasing out to $0 by $150k); unused losses carry forward. On sale, claimed depreciation is recaptured at up to 25%, and gains may owe capital-gains tax (a 1031 exchange can defer both). Figures are a year-1 estimate at your 24.0% rate — not tax advice; consult a CPA.
Schools (NCES district)
- District
- Federal Way School District
- NCES district ID
- 5302820
- Math proficiency
- 35% ▬ 0.00%
- Reading proficiency
- 47% ▬ 0.00%
- Median HH income
- $61,594
- Composite
- 38.79/100
- National rank
- #8361
- State rank
- #207 of 291 in WA
Livability — Federal Way
- Score
- 71/100
- State rank
- #221
- US rank
- #6403
Category grades
Schools grade is shown separately in the Schools card above.
Census & demographics
- Census place
- Federal Way, WA
- County
- King County · 2,251,916 people
- City population
- 102,067
- Metro
- Seattle-Tacoma-Bellevue, WA
- Population (ZIP)
- 51,619
- Household income
- $75,319
- Rent vs Own
- Severe rent burden
- 2895.0
Population outlook (King County) Hauer SSP2
- Today (2025)
- 2,576,485 people
- By 2030
- 2,803,316 · +8.8%
- By 2040
- 3,255,921 · +26.4%
- By 2050
- 3,706,444 · +43.9%
- By 2075
- 4,746,063 · +84.2%
- By 2100
- 5,407,730 · +109.9%
Race, ethnicity, and origin ACS 2023
- Neighborhood character
- Highly diverse neighborhood (Simpson 0.79)
- Race & ethnicity
- White 32% Hispanic / Latino 23% Black 19% Two or more races 16% Asian 13% Pacific Islander 2%
- Hispanic origin (detail)
- Mexican 18%
- Common ancestry
- Portuguese 3% Lithuanian 2% Swedish 2%
- Foreign-born
- 32% · Canada, South Korea, Vietnam
- Languages at home
- 57% English-only · Spanish 18% Other Indo-European 3% Russian/Polish/Slavic 3%
Political lean MEDSL · King
- 2024 margin
- Solid D (+51.7) · D 74.2% · R 22.5% · Other 3.4%
- 2008→2024 swing
- +9.6pp toward D · 2008: 42.1pp · 2024: 51.7pp
- All cycles
- 2024: D+51.7 2020: D+52.7 2016: D+50.4 2012: D+39.9 2008: D+42.1
Not yet ingested
- Civics
- —
Market trends
- HPI YoY
- ▼ -623.87%
- Current HPI
- 327.5371
- Rent YoY
- ▲ 2.33%
- Metro
- Seattle-Tacoma-Bellevue, WA
- State GDP YoY
- ▲ 4.65%
- F500 in state
- 22
Industry mix (Fortune 500 HQ in WA)
| Industry | F500 HQs | Revenue |
|---|---|---|
| Retail | 2 | $269B |
|
||
| Technology / Retail | 1 | $638B |
|
||
| Technology | 1 | $245B |
|
||
| Telecommunications | 1 | $38B |
|
||
| Food / Beverage | 1 | $36B |
|
||
| Automotive / Trucks | 1 | $34B |
|
||
Price history
+112.2% since first listed12 events — show timeline
- 2026-05-29 Listed $125,000 NWMLS as Distributed by MLS Grid
- 2016-03-15 Sold (MLS) $36,500 NWMLS as Distributed by MLS Grid
- 2016-02-27 Pending — NWMLS as Distributed by MLS Grid
- 2016-01-29 Listed $36,500 NWMLS as Distributed by MLS Grid
- 2011-10-03 Sold (MLS) $33,000 NWMLS as Distributed by MLS Grid
- 2011-08-30 Pending — NWMLS as Distributed by MLS Grid
- 2011-08-17 Pending — NWMLS as Distributed by MLS Grid
- 2011-07-15 Price Changed $36,500 NWMLS as Distributed by MLS Grid
- 2011-06-09 Listed $42,500 NWMLS as Distributed by MLS Grid
- 2008-12-22 Sold (MLS) $50,000 NWMLS as Distributed by MLS Grid
- 2008-10-20 Delisted — NWMLS as Distributed by MLS Grid
- 2008-09-08 Listed $58,900 NWMLS as Distributed by MLS Grid
Cash-flow waterfall
monthlySold comps — $/sqft
last 12 mo · ≤1 miLoading sold comps…