3233 NE 34th St · Fort Lauderdale, FL
Flood risk 5/10 · Moderate
- FEMA flood zone
- AE
- Chance of flooding over 30 yrs
- 0.24%
- Est. flood insurance / yr
- $1,737 – $8,500
Fire risk 1/10 · Minimal
- Est. fire insurance / yr
- $947 – $1,759
Heat risk 10/10 · Severe
- Hot days now (above 105°F)
- 7 days/yr
- Hot days in 30 yrs
- 26 days/yr
Wind risk 10/10 · Severe
- Chance of severe wind over 30 yrs
- 99.0%
Air-quality risk 2/10 · Minimal
- Unhealthy air days now
- 1 days/yr
- Unhealthy air days in 30 yrs
- 2 days/yr
Risk factors via First Street. Map © Google.
Why this score? — see what drove the D+ grade
The composite is a weighted blend of 9 inputs, each scored 0–100. Each bar is that input's sub-score; the figure is the points it added to the 100-point composite (weight × sub-score).
- Cash flow +15.4/30.0
- ARV discount +7.5/15.0
- 1% rule +7.0/10.0
- DSCR +4.7/10.0
- Schools +4.1/10.0
- Livability +4.1/5.0
- Rent growth +3.4/5.0
- Condition / age +2.5/5.0
- Appreciation +0.0/10.0
$329,900
🖨 Deal sheet 📄 Offer letter ✓ Due diligence
Listing remarks MLS
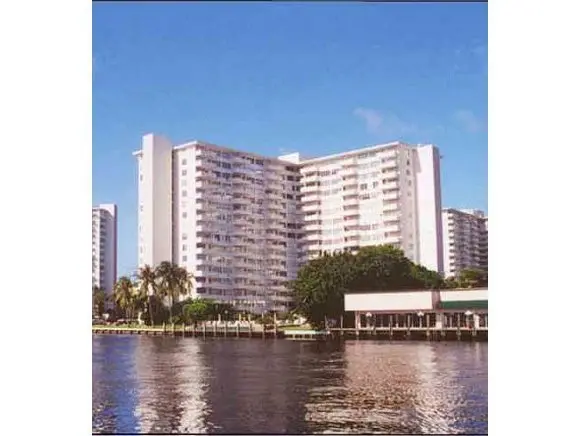
Wow! TOP FLOOR OCEAN VIEWS EXQUISITILY FURNISHED AND FULLY EQUIPPED SECURE BUILDING. Looking for a condo on the intercoastal waterways with ocean views? Your search is over. This stunning one bedroom penthouse unit is beautifally appointed and ready to move right in. Must see!owner is florida real estate agent '||chr(10)||'Addendum - Well managed secure building. Over 55 but openings for under 55.
Key facts
- $725 HOA
- Parking
- Community pool
Property features AI
Finance
- Other: Senior community; Pets not allowed
- Financial info: Not a land lease
- HOA & community: Association: Galt Mile Apartments, Inc.; Monthly association fee; Association amenities include elevator(s), fitness center, pool (heated), laundry, parking, storage, manager on site, security, lobby, community room, library, putting green, shuffleboard court, car wash area, trash chute, internet included; Association fee covers cable TV, internet, grounds maintenance, pest control, security, sewer, trash, water, reserve funds, and pool service
Exterior
- Parking: Assigned parking; Asphalt parking; 1 open parking space (1 total)
- Security: Fire alarm; Smoke detector(s); Security guard; Key card entry; Lobby attended
- Utilities: Public water; Public sewer; Cable available; Sewer connected; Water connected
- Home design: Stock cooperative; One level; Resale unit; Faces west; Corner two-bedroom deluxe model; Building: Coral Ridge Towers Original (17 stories)
- Construction: Pre-cast concrete construction; Concrete/composition flat roof; Pillar/post/pier foundation; Built as part of a 17-story building
- Exterior features: Intracoastal waterfront; Heated in-ground private pool; City street frontage; Road surface: asphalt and paved; Publicly maintained road
Interior
- Kitchen: Dishwasher; Microwave; Refrigerator; Electric cooktop
- Bedrooms: 2 bedrooms on the main level
- Flooring: Carpet; Tile; Wood; Engineered wood
- Bathrooms: 2 full bathrooms on the main level
- Heating & cooling: Central heating (electric, individual controls); Central air conditioning; Ceiling fan(s); Electric cooling
- Interior features: Entrance foyer; Walk-in closet(s); Bedroom layout: stacked
- Laundry & utility: Laundry room with multiple locations; Common area laundry; In-hall laundry access; Inside unit laundry available
Neighborhood map
What this means for you Summary
Snapshot
- This is a 2-bed/2.0-bath single-family listed at $330k.
Deal economics
- At list price, monthly cash flow is $-299 ($-4k/yr) — negative.
- To cash-flow at today's rent, offer at most $287k (13.1% below list).
- Meets the 1% rule at list price ($4k rent vs $330k).
- Recommended offer: $287k (13.1% below list) — sets the bar for cash-flow.
- Cap rate 6.8% vs local median 2.2% in Fort Lauderdale — top-decile yield for the area; either an underpriced asset or a hidden risk that comps aren't pricing in. Stress-test before assuming the spread holds.
Location & tenants
- Location reads 82/100 on livability (#78 in FL, #1,293 nationally) — a professional / high-income tenant draw. Strengths: crime A+, amenities A+, health & safety A+; Watch: cost of living D-.
- Broward (suburban): math 42% / reading 53% proficiency, ranked #46 of 73 in FL (top 63%) — families likely to look elsewhere, expect single-tenant / working-renter base with shorter leases.
- Zoned schools: Bayview Elementary School (math 79% / reading 85%, grade A+, #79 of 2,144 statewide, top 4%, 552 students, 23% FRL); Sunrise Middle School (math 50% / reading 52%, grade C, #237 of 571 statewide, top 43%, 1,242 students, 64% FRL); Fort Lauderdale High School (math 38% / reading 67%, grade C-, #154 of 667 statewide, top 24%, 2,228 students, 57% FRL) — zoned schools at 48% FRL track the district average.
- Zoned-school proficiency averages 62% at this address vs 48% district-wide (+14 pts) — the actual schools serving this property are materially stronger than the Broward average implies; a family-tenant draw the district grade alone would hide.
- Market conditions: Rents rising (+3.6%/yr); 739 active listings in the ZIP; 40 comparable units currently listed for rent nearby; rentals at typical pace (median 15d on market — plan ~3-4 weeks tenant-placement turnaround); solid renter incomes; 2,111 units permitted in Broward County in 2024 (1,265 in 5+ unit buildings).
- At $3,965/mo this rent would consume 51% of the median local household income ($94k/yr) (locally 912% of renters already pay >50% of income on rent) — very limited rent-growth headroom before tenants either downsize or default.
Forward outlook
- Local home prices are declining (-3.0%/yr); year-one equity from $2k of loan paydown is wiped out by about $10k of value loss. Plan a longer hold.
- Broward County population projected at +34% by 2050 — long-run rental-demand tailwind backs the buy-and-hold thesis.
Negotiation context
- Only 1 days on market — expect competitive offers; lowballing is unlikely to land.
- 2 sale attempts since 18y ago; this cycle's ask is 129% above the opening price — seller raised mid-cycle; expect resistance to lowballs.
Risks & watch-outs
- Watch-outs: flood insurance adds $427/mo.
- Climate carrying-cost: in FEMA flood zone AE (mandatory federal flood insurance); severe wind risk, 99% chance of damaging wind over 30y; extreme-heat days projected 7→26/yr by 2055 (HVAC capex compounding) — expect insurance premiums to compound above CPI over the hold.
Questions for the listing agent
- What do current leases actually rent for vs. the listed asking? Can we see a recent rent roll and the last 12 months of T-12 income?
- Built in 1962 — when were the roof, HVAC, electrical panel, plumbing, and water heater last replaced?
- What's the actual annual flood-insurance premium (NFIP or private), and is the property in a SFHA with mandatory coverage?
- What does the HOA fee cover, when was the last increase, and are there any pending special assessments or reserve-fund shortfalls?
- Is there a deadline driving the sale (1031 exchange, divorce, estate, relocation)? That informs how much negotiation room exists.
- Schools are B-rated — typically a magnet for longer-tenancy family renters. What's the average tenant stay here, and is there a school-zone premium baked into asking?
- The area grade is low — what's the realistic commute time and amenity access for the typical tenant pool here? Any planned neighborhood developments (good or bad) we should know about?
- What's the average days-on-market for RENTAL listings here right now (not sales)? A rising rental-DOM trend means longer vacancies and softer asking-rent achievability than the comps imply.
- What's the recent tenant-quality profile in this submarket — average credit score on applications, eviction rate, late-payment / NSF rate, and stable-employment percentage? A property-management company in the area should have these aggregated.
- How much new for-sale + rental construction is in the pipeline within 1–3 miles? Heavy new supply typically softens prices + rents 12–24 months out; constrained supply supports both.
Investment metrics
- 1% rule
- 1.20% ✓
- Cap rate
- 6.76%
- Cash-on-cash
- 1.66%
- DSCR
- 1.07
- GRM
- 6.9
CMA / ARV
No comps found within radius.
Projected returns pro-forma
-3.0% appreciation · 3.63% rent growth · sell at horizon
- IRR
- -21.4%
- Equity multiple
- 0.25×
- Total profit
- $-69,193
- Equity at exit
- $49,189
- IRR
- -12.4%
- Equity multiple
- 0.23×
- Total profit
- $-71,129
- Equity at exit
- $28,524
Cash invested: $92,372 (down + closing). Projections, not guarantees.
Landlord ↔ Tenant lean methodology
- Overall (STATE)
- 87 Strongly Landlord-Friendly
- State Florida
- 87 Strongly Landlord-Friendly · R+3
- County
- — inherits STATE
- City
- — inherits STATE
ZIP-level market 33308
- Rents YoY
- 3.6%
- Active inventory
- 739
- Price-to-rent
- 6.9×
Monthly cashflow live
- Estimated rent
- $3,965 high interval (Pro) →
- Mortgage (P&I)
- −$1,730
- Tax est. 1.5%
- −$412 /mo · $4,948/yr
- Insurance
- −$137
- Flood insurance flood zone
- −$427 /mo · $5,118/yr
- HOA
- −$725
- Vacancy / Maint / Mgmt
- −$833
- Net cashflow
- $-299
Break-even live
UW: 25.0% down · 7.5% · 30yr · 1.5% tax · 5.0% vac · 8.0% maint · 8.0% mgmt
Financing live
Cash to close
- Down payment
- $82,475
- Closing costs
- $9,897
- Reserves months
- —
- Total cash needed
- —
Loan-product check · same deal, 3 products live
Conventional
25% down · 7.5% · 30yr
- Down + closing
- —
- Monthly P&I
- —
- Monthly cashflow
- —
- DSCR
- —
- Eligible?
- —
Personal DTI + credit; lowest rate.
DSCR
20% down · 8.5% · 30yr
- Down + closing
- —
- Monthly P&I
- —
- Monthly cashflow
- —
- DSCR
- —
- Eligible?
- —
No personal income docs; deal must DSCR.
Hard money
10% down · 12.0% · 12mo
- Down + closing
- —
- Monthly P&I
- —
- Monthly cashflow
- —
- DSCR
- —
- Eligible?
- —
Short-term bridge; refi at stabilization.
Rent comps 40 comps
| Address | Beds | Baths | Sqft | Rent | $/sqft | DOM | Units | Dist |
|---|---|---|---|---|---|---|---|---|
| 3605 NE 32nd Ave Unit 209A Fort Lauderdale, FL | 2.0 | 2.0 | 1000 | $3,300 | $3.30 | 20d | 1 | 0.21mi |
| 3605 NE 32nd Ave Unit 209A Fort Lauderdale, FL | 2.0 | 2.0 | 1000 | $3,300 | $3.30 | 1d | 1 | 0.21mi |
| 3031 N Ocean Blvd Fort Lauderdale, FL | 2.0–3.0 | 2.0 | 1325 | $3,475 | $2.62 | 17d | 3 | 0.24mi |
| 3031 N Ocean Blvd Fort Lauderdale, FL | 2.0–3.0 | 2.0 | 1290 | $3,400 | $2.63 | 7d | 3 | 0.24mi |
| 3031 N Ocean Blvd Fort Lauderdale, FL | 2.0–3.0 | 2.0 | 1290 | $3,200 | $2.48 | 4d | 4 | 0.24mi |
| 3020 NE 32nd Ave Fort Lauderdale, FL | 1.0–2.0 | 1.0–2.0 | 920 | $4,300 | $4.67 | 4d | 4 | 0.27mi |
| 3020 NE 32nd Ave Fort Lauderdale, FL | 2.0 | 2.0 | 1185 | $3,875 | $3.27 | 7d | 3 | 0.27mi |
| 3430 Galt Ocean Dr Fort Lauderdale, FL | 1.0–4.0 | 1.5–4.5 | 2873 | $6,320 | $2.20 | 7d | 4 | 0.29mi |
| 3430 Galt Ocean Dr Fort Lauderdale, FL | 1.0–2.0 | 1.5–2.0 | 1343 | $4,980 | $3.71 | 15d | 4 | 0.29mi |
| 2900 NE 30th St Unit H6 Fort Lauderdale, FL | 2.0 | 2.0 | 1040 | $3,200 | $3.08 | 24d | 1 | 0.30mi |
| 3500 Galt Ocean Dr #2314 Fort Lauderdale, FL | 1.0 | 1.5 | 1088 | $4,500 | $4.14 | 4d | 1 | 0.32mi |
| 3500 Galt Ocean Dr #2314 Fort Lauderdale, FL | 1.0 | 1.5 | 1088 | $4,500 | $4.14 | 24d | 1 | 0.32mi |
| 3600 Galt Ocean Dr Unit 9C Fort Lauderdale, FL | 2.0 | 2.0 | 1155 | $4,000 | $3.46 | 24d | 1 | 0.39mi |
| 3700 Galt Ocean Dr Fort Lauderdale, FL | 1.0–2.0 | 1.5–2.0 | 1025 | $3,790 | $3.70 | 24d | 2 | 0.40mi |
| 2841 N Ocean Blvd Fort Lauderdale, FL | 2.0 | 2.0 | 1150 | $3,700 | $3.22 | 15d | 3 | 0.40mi |
| 3750 Galt Ocean Dr #209 Fort Lauderdale, FL | 1.0 | 1.5 | 1187 | $4,000 | $3.37 | 24d | 1 | 0.41mi |
| 2831 N Ocean Blvd Unit 702N Fort Lauderdale, FL | 2.0 | 2.0 | 1274 | $5,200 | $4.08 | 24d | 1 | 0.44mi |
| 2831 N Ocean Blvd Unit 702N Fort Lauderdale, FL | 2.0 | 2.0 | 1274 | $5,200 | $4.08 | 3d | 1 | 0.44mi |
| 2831 N Ocean Blvd Unit 801N Fort Lauderdale, FL | 2.0 | 2.0 | 1468 | $6,000 | $4.09 | 24d | 1 | 0.44mi |
| 3800 Galt Ocean Dr Fort Lauderdale, FL | 1.0–2.0 | 1.5–2.0 | 1071 | $4,500 | $4.20 | 4d | 6 | 0.45mi |
| 3800 Galt Ocean Dr Fort Lauderdale, FL | 1.0–2.0 | 1.5–2.0 | 1071 | $4,500 | $4.20 | 15d | 6 | 0.45mi |
| 3800 Galt Ocean Dr Fort Lauderdale, FL | 1.0–2.0 | 1.5–2.0 | 1071 | $4,250 | $3.97 | 2d | 7 | 0.45mi |
| 2821 N Ocean Blvd Unit 401S Fort Lauderdale, FL | 2.0 | 2.0 | 1468 | $5,750 | $3.92 | 24d | 1 | 0.46mi |
| 2821 N Ocean Blvd Unit 401S Fort Lauderdale, FL | 2.0 | 2.0 | 1468 | $5,500 | $3.75 | 10d | 1 | 0.46mi |
| 2821 N Ocean Blvd Unit 806S Fort Lauderdale, FL | 2.0 | 2.0 | 1274 | $5,900 | $4.63 | 18d | 1 | 0.46mi |
| 2821 N Ocean Blvd Unit 1102S Fort Lauderdale, FL | 2.0 | 2.0 | 1274 | $4,500 | $3.53 | 24d | 1 | 0.46mi |
| 3850 Galt Ocean Dr #1003 Fort Lauderdale, FL | 1.0 | 1.5 | 1050 | $3,300 | $3.14 | 24d | 1 | 0.48mi |
| 3900 Galt Ocean Dr Fort Lauderdale, FL | 2.0 | 1.5–2.0 | 1429 | $4,675 | $3.27 | 16d | 3 | 0.52mi |
| 3900 Galt Ocean Dr Fort Lauderdale, FL | 1.0–2.0 | 1.5–2.0 | 1429 | $5,600 | $3.92 | 17d | 4 | 0.52mi |
| 2715 N Ocean Blvd Unit 10C Fort Lauderdale, FL | 2.0 | 2.0 | 1200 | $4,500 | $3.75 | 7d | 1 | 0.52mi |
| 2701 N Ocean Blvd Unit 2B Fort Lauderdale, FL | 2.0 | 2.0 | 1200 | $3,100 | $2.58 | 19d | 1 | 0.55mi |
| 4010 Galt Ocean Dr #802 Fort Lauderdale, FL | 2.0 | 2.0 | 1190 | $5,000 | $4.20 | 15d | 1 | 0.57mi |
| 4010 Galt Ocean Dr Fort Lauderdale, FL | 2.0–3.0 | 2.0 | 810 | $5,000 | $6.17 | 5d | 2 | 0.58mi |
| 4010 Galt Ocean Dr Fort Lauderdale, FL | 2.0–3.0 | 2.0 | 1355 | $5,000 | $3.69 | 14d | 2 | 0.58mi |
| 4010 Galt Ocean Dr Fort Lauderdale, FL | 2.0 | 2.0 | 1190 | $3,150 | $2.65 | 20d | 2 | 0.58mi |
| 4010 Galt Ocean Dr Fort Lauderdale, FL | 2.0–3.0 | 2.0 | 810 | $3,200 | $3.95 | 4d | 3 | 0.58mi |
| 2613-2615 NE 33rd Ave Fort Lauderdale, FL | 2.0 | 3.0 | 1200 | $10,000 | $8.33 | 2d | 1 | 0.60mi |
| 4020 Galt Ocean Dr Fort Lauderdale, FL | 1.0–2.0 | 1.0–2.0 | 1536 | $8,750 | $5.69 | 4d | 7 | 0.62mi |
| 4020 Galt Ocean Dr Fort Lauderdale, FL | 1.0–2.0 | 1.0–2.0 | 1553 | $8,750 | $5.63 | 4d | 6 | 0.62mi |
| 4250 Galt Ocean Dr Fort Lauderdale, FL | 2.0 | 2.0 | 1350 | $3,650 | $2.70 | 2d | 2 | 0.78mi |
HOA detail
- Monthly dues
- $725 · $8,700/yr
- Likely covers
- water
Listing history 2 events
-
2026-06-13remarks 486-char remark
-
2026-06-13$329,900 Active 1 DOM
ⓘ Source: listings_history table (triggers on properties + properties_extension) + one-shot
backfill from property_details.listing_events for pre-trigger history.
Climate risk First Street
- Flood 5/10 Major FEMA zone AE · 24% chance over 30 yrs
- Wildfire 1/10 Low
- Heat 10/10 Extreme 7 d/yr ≥105°F today · 26 d/yr by 30 yrs out
- Wind 10/10 Extreme 99% chance of damaging wind over 30 yrs
- Air quality 2/10 Low 1 unhealthy d/yr today · 2 by 30 yrs out
Nearby sold comps map
Loading sold comps map…
Walkable amenities ~0.75 mi
Loading nearby amenities…
Taxation est. · year 1
- Rental income
- $47,584
- − Mortgage interest
- −$18,480
- − Property taxes
- −$4,948
- − Insurance
- −$6,768
- − Repairs & maintenance
- −$3,807
- − Management
- −$3,807
- − HOA
- −$8,700
- − Depreciation
- −$9,597
- Taxable loss
- −$8,523
- Est. tax savings @ 24.0%
- +$2,045
- After-tax cash flow
- $-1,540/yr
For passive investors: Depreciation is non-cash, so a rental often shows a tax loss while cash-flowing — sheltering income. Rental losses are passive: they offset passive income freely, and up to $25,000/yr can offset ordinary (W-2) income if you actively participate and your MAGI is under $100k (phasing out to $0 by $150k); unused losses carry forward. On sale, claimed depreciation is recaptured at up to 25%, and gains may owe capital-gains tax (a 1031 exchange can defer both). Figures are a year-1 estimate at your 24.0% rate — not tax advice; consult a CPA.
Schools (NCES district)
- District
- Broward
- NCES district ID
- 1200180
- Math proficiency
- 42% ▼ -18.00%
- Reading proficiency
- 53% ▼ -5.00%
- Median HH income
- $52,139
- Composite
- 40.88/100
- National rank
- #3621
- State rank
- #46 of 73 in FL
Livability — Fort Lauderdale
- Score
- 82/100
- State rank
- #78
- US rank
- #1293
Category grades
Schools grade is shown separately in the Schools card above.
Census & demographics
- Census place
- Fort Lauderdale, FL
- County
- Broward County · 1,963,430 people
- City population
- 235,769
- Metro
- Miami-Fort Lauderdale-Pompano Beach, FL
- Population (ZIP)
- 27,935
- Household income
- $93,879
- Rent vs Own
- Severe rent burden
- 912.0
Population outlook (Broward County) Hauer SSP2
- Today (2025)
- 2,207,033 people
- By 2030
- 2,360,704 · +7.0%
- By 2040
- 2,661,208 · +20.6%
- By 2050
- 2,946,698 · +33.5%
- By 2075
- 3,602,273 · +63.2%
- By 2100
- 3,970,984 · +79.9%
Race, ethnicity, and origin ACS 2023
- Neighborhood character
- Predominantly White (75%)
- Race & ethnicity
- White 75% Hispanic / Latino 16% Two or more races 14% Asian 3% Black 2%
- Hispanic origin (detail)
- Puerto Rican 2% Cuban 3%
- Common ancestry
- Romanian 4% Lithuanian 3% Scotch-Irish 3%
- Foreign-born
- 24% · Canada, Jamaica, Dominican Republic
- Languages at home
- 75% English-only · Spanish 14% Other Indo-European 5% Russian/Polish/Slavic 2%
Political lean MEDSL · Broward
- 2024 margin
- D (+17.0) · D 58.0% · R 41.0%
- 2008→2024 swing
- -17.8pp toward R · 2008: 34.7pp · 2024: 17.0pp
- All cycles
- 2024: D+17.0 2020: D+29.8 2016: D+35.0 2012: D+34.9 2008: D+34.7
Not yet ingested
- Civics
- —
Market trends
- HPI YoY
- ▼ -417.95%
- Current HPI
- 325.3902
- Rent YoY
- ▲ 3.63%
- Metro
- Miami-Fort Lauderdale-Pompano Beach, FL
- State GDP YoY
- ▲ 3.28%
- F500 in state
- 36
Industry mix (Fortune 500 HQ in FL)
| Industry | F500 HQs | Revenue |
|---|---|---|
| Industrial Technology | 2 | $29B |
|
||
| Insurance | 2 | $17B |
|
||
| Retail | 1 | $60B |
|
||
| Technology Distribution | 1 | $58B |
|
||
| Homebuilding | 1 | $35B |
|
||
| Technology Manufacturing | 1 | $35B |
|
||
Price history
-52.8% since first listed4 events — show timeline
- 2017-09-28 Listed $143,900 MARMLS
- 2017-09-28 Listing Removed — MARMLS
- 2016-08-16 Listing Removed — SCMLS
- 2008-10-16 Listed $305,000 SCMLS
Cash-flow waterfall
monthlySold comps — $/sqft
last 12 mo · ≤1 miLoading sold comps…