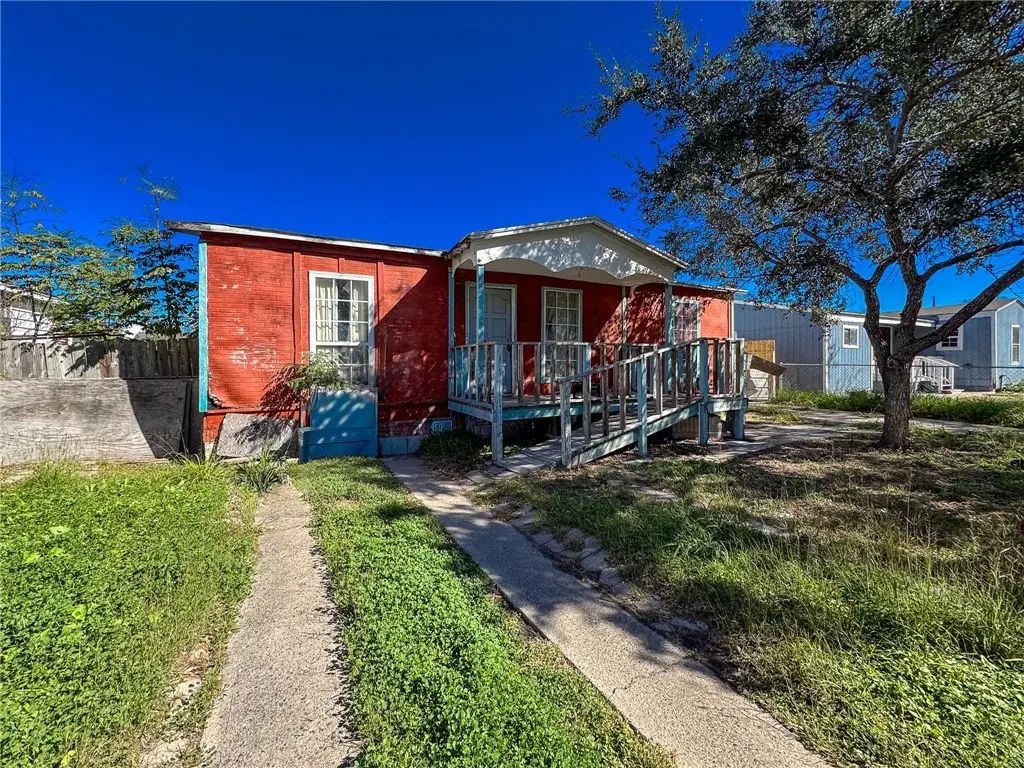
1714 Tarlton St · Corpus Christi, TX
Flood risk 1/10 · Minimal
- FEMA flood zone
- X (unshaded)
- Chance of flooding over 30 yrs
- 0.0%
- Est. flood insurance / yr
- $507 – $1,088
Fire risk 1/10 · Minimal
- Est. fire insurance / yr
- $1,222 – $2,270
Heat risk 10/10 · Severe
- Hot days now (above 107°F)
- 7 days/yr
- Hot days in 30 yrs
- 26 days/yr
Wind risk 9/10 · Severe
- Chance of severe wind over 30 yrs
- 99.0%
Air-quality risk 1/10 · Minimal
- Unhealthy air days now
- 0 days/yr
- Unhealthy air days in 30 yrs
- 0 days/yr
Risk factors via First Street. Map © Google.
Why this score? — see what drove the B+ grade
The composite is a weighted blend of 9 inputs, each scored 0–100. Each bar is that input's sub-score; the figure is the points it added to the 100-point composite (weight × sub-score).
- Cash flow +30.0/30.0
- ARV discount +15.0/15.0
- 1% rule +10.0/10.0
- DSCR +10.0/10.0
- Livability +3.9/5.0
- Rent growth +3.1/5.0
- Schools +2.8/10.0
- Condition / age +2.5/5.0
- Appreciation +0.0/10.0
$54,500
🖨 Deal sheet (PDF) 📄 Offer letter ✓ Due diligence
Listing remarks MLS
Charming 3-bedroom, 1-bath home in Corpus Christi offering 1,064 square feet of opportunity and potential. This property features a spacious layout with great natural light and a large backyard perfect for entertaining, pets, or future additions. Whether you’re looking for your next investment or a place to truly make your own, this home is ready for your personal touch. Conveniently located and full of possibilities, it’s waiting for you to turn it into something special.
Key facts
- Great natural light
- Large backyard
- Spacious layout
Tags
Neighborhood map
What this means for you Summary
Snapshot
- This is a 3-bed/1.0-bath single-family listed at $54k.
Deal economics
- At list price, monthly cash flow is $668 ($8k/yr) — positive.
- The deal already cash-flows at list — no discount required.
- Meets the 1% rule at list price ($2k rent vs $54k).
- Recommended offer: $50k (9.0% below list) — sets the bar for market timing.
- Cap rate 21.0% vs local median 3.6% in Corpus Christi — top-decile yield for the area; either an underpriced asset or a hidden risk that comps aren't pricing in. Stress-test before assuming the spread holds.
Location & tenants
- Location reads 78/100 on livability (#66 in TX, #2,404 nationally) — a middle-class / working-renter tenant base. Strengths: commute A+, cost of living A+, housing A+; Watch: crime F.
- Corpus Christi ISD (urban): math 31% / reading 35% proficiency, ranked #562 of 826 in TX (top 68%) — families likely to look elsewhere, expect single-tenant / working-renter base with shorter leases; 63% free/reduced lunch — lower-income household profile, screen leases tightly.
- Zoned schools: Windsor Park G/T (math 85% / reading 90%, grade A+, #6 of 4,322 statewide, top 0%, 609 students, 29% FRL); Adkins Middle (math 40% / reading 39%, grade F, #660 of 1,662 statewide, top 41%, 956 students, 48% FRL); Moody H S (math 33% / reading 26%, grade F, #1,112 of 1,632 statewide, top 70%, 1,382 students, 84% FRL).
- Zoned-school proficiency averages 52% at this address vs 33% district-wide (+19 pts) — the actual schools serving this property are materially stronger than the Corpus Christi ISD average implies; a family-tenant draw the district grade alone would hide.
- Market conditions: Rents rising (+2.3%/yr); 434 active listings in the ZIP; 32 comparable units currently listed for rent nearby; rentals lingering (median 46d on market — plan ~5-8 weeks vacancy on turnover, expect pricing pressure); 53% of comp listings sitting > 30 days — soft ceiling on asking rent; 1,397 units permitted in Nueces County in 2024 (47 in 5+ unit buildings).
Forward outlook
- Local home prices are declining (-3.0%/yr); year-one equity from $377 of loan paydown is wiped out by about $2k of value loss. Plan a longer hold.
- Nueces County population projected at +36% by 2050 — long-run rental-demand tailwind backs the buy-and-hold thesis.
- At projected returns (-3.0% appreciation + 2.3% rent growth), your $15k cash investment doubles in ~3 years — after that, you're playing with house money.
Negotiation context
- It's been on market 101 days — a 9% lower offer ($50k) is reasonable based on typical stale-listing flexibility.
- 2 sale attempts; this cycle's ask has dropped $26k (32%) from the opening price — seller is motivated, your offer sets the floor, not the list.
Risks & watch-outs
- Watch-outs: property tax is 4.8% of price; built in 1941 — expect roof / HVAC / electrical / plumbing capex.
- Climate carrying-cost: severe wind risk, 99% chance of damaging wind over 30y; extreme-heat days projected 7→26/yr by 2055 (HVAC capex compounding) — expect insurance premiums to compound above CPI over the hold.
Questions for the listing agent
- It's been on market 101 days. Have you received any prior offers? Is the seller open to a 9% concession, seller financing, or rate buy-down credit?
- Built in 1941 — when were the roof, HVAC, electrical panel, plumbing, and water heater last replaced?
- Property tax is high relative to price — has the assessment been appealed recently, and will the sale trigger a re-assessment?
- Why hasn't it sold? Are there any deal-killer items the seller is aware of (foundation, flood, title, zoning, code violations)?
- Is there a deadline driving the sale (1031 exchange, divorce, estate, relocation)? That informs how much negotiation room exists.
- Crime grade is F in this area — have there been break-ins, vandalism, or insurance claims at this property in the last 3 years? What carrier currently insures it and at what premium?
- What's the average days-on-market for RENTAL listings here right now (not sales)? A rising rental-DOM trend means longer vacancies and softer asking-rent achievability than the comps imply.
- What's the recent tenant-quality profile in this submarket — average credit score on applications, eviction rate, late-payment / NSF rate, and stable-employment percentage? A property-management company in the area should have these aggregated.
- How much new for-sale + rental construction is in the pipeline within 1–3 miles? Heavy new supply typically softens prices + rents 12–24 months out; constrained supply supports both.
Investment metrics
- 1% rule
- 2.77% ✓
- Cap rate
- 21.01%
- Cash-on-cash
- 52.56%
- DSCR
- 3.34
- GRM
- 3.0
CMA / ARV
- ARV (median comp)
- $95,982
- List price
- $54,500
- Delta
- -43.22%
- Verdict
- UNDERPRICED
- Comps
- 20 within 1.0 mi
Show comp detail 12 sales within ~0.75 mi
| Address | Dist | Beds/Ba | Sqft | Sold | Price | $/sf | Match |
|---|---|---|---|---|---|---|---|
| 2705 Elizabeth St | 0.42mi | 3/1.0 | 1,026 (-4%) | 3mo | $165,000 | $161 | 72 |
| 139 Edwards St | 0.43mi | 2/1.0 (-1) | 1,016 (-4%) | 8mo | $45,000 | $44 | 60 |
| 2530 Dunbar St | 0.54mi | 3/2.0 | 992 (-7%) | 2mo | $79,900 | $81 | 58 |
| 3037 Macarthur St | 0.46mi | 2/1.0 (-1) | 960 (-10%) | 1mo | $50,000 | $52 | 57 |
| 2630 Lynch St | 0.53mi | 2/1.0 (-1) | 1,096 (+3%) | 12mo | $135,000 | $123 | 55 |
| 2838 Greenwood Dr | 0.71mi | 2/2.0 (-1) | 1,058 (-1%) | 3mo | $158,000 | $149 | 54 |
| 1329 Logan Ave | 0.68mi | 2/2.0 (-1) | 1,065 (+0%) | 6mo | $174,500 | $164 | 54 |
| 2513 Terrace St | 0.65mi | 2/2.0 (-1) | 1,094 (+3%) | 3mo | $60,000 | $55 | 53 |
| 2407 David St | 0.75mi | 3/1.0 | 1,010 (-5%) | 11mo | $56,000 | $55 | 48 |
| 2225 Presa St | 0.40mi | 2/1.0 (-1) | 924 (-13%) | 8mo | $53,500 | $58 | 48 |
| 1302 York Ave | 0.63mi | 3/2.0 | 1,169 (+10%) | 4mo | $99,999 | $86 | 47 |
| 1522 Clodah Dr | 0.33mi | 2/1.5 (-1) | 1,203 (+13%) | 10mo | $128,200 | $107 | 47 |
Match score weights: distance 35% · size 25% · config 20% · recency 20%. Top-matched comps best support the ARV.
Projected returns pro-forma
-3.0% appreciation · 2.32% rent growth · sell at horizon
- IRR
- 49.8%
- Equity multiple
- 3.15×
- Total profit
- $32,829
- Equity at exit
- $8,126
- IRR
- 55.0%
- Equity multiple
- 6.22×
- Total profit
- $79,715
- Equity at exit
- $4,712
Cash invested: $15,260 (down + closing). Projections, not guarantees.
Landlord ↔ Tenant lean methodology
- Overall (STATE)
- 87 Strongly Landlord-Friendly
- State Texas
- 87 Strongly Landlord-Friendly · R+5
- County
- — inherits STATE
- City
- — inherits STATE
ZIP-level market 78415
- Rents YoY
- 2.3%
- Active inventory
- 434
- Price-to-rent
- 3.0×
Monthly cashflow live
- Estimated rent
- $1,510 high interval (Pro) →
- Mortgage (P&I)
- −$286
- Tax from tax record
- −$216 /mo · $2,594/yr
- Insurance
- −$23
- HOA
- −$0
- Vacancy / Maint / Mgmt
- −$317
- Net cashflow
- $668
Break-even live
Sensitivity live
| Price | -10% $854 | -5% $835 | +0% $668 | +5% $653 | +10% $638 |
|---|---|---|---|---|---|
| Rent | -10% $549 | -5% $609 | +0% $668 | +5% $728 | +10% $788 |
| Rate | -1.0pp $696 | -0.5pp $682 | base $668 | +0.5pp $654 | +1.0pp $640 |
UW: 25.0% down · 7.5% · 30yr · 1.5% tax · 5.0% vac · 8.0% maint · 8.0% mgmt
Financing live
Cash to close
- Down payment
- $13,625
- Closing costs
- $1,635
- Reserves months
- —
- Total cash needed
- —
Loan-product check · same deal, 3 products live
Conventional
25% down · 7.5% · 30yr
- Down + closing
- —
- Monthly P&I
- —
- Monthly cashflow
- —
- DSCR
- —
- Eligible?
- —
Personal DTI + credit; lowest rate.
DSCR
20% down · 8.5% · 30yr
- Down + closing
- —
- Monthly P&I
- —
- Monthly cashflow
- —
- DSCR
- —
- Eligible?
- —
No personal income docs; deal must DSCR.
Hard money
10% down · 12.0% · 12mo
- Down + closing
- —
- Monthly P&I
- —
- Monthly cashflow
- —
- DSCR
- —
- Eligible?
- —
Short-term bridge; refi at stabilization.
Rent comps 32 comps
| Address | Beds | Baths | Sqft | Rent | $/sqft | DOM | Units | Dist |
|---|---|---|---|---|---|---|---|---|
| 1722 Trenton Dr Corpus Christi, TX | 4.0 | 2.0 | 1432 | $2,100 | $1.47 | 15d | 1 | 0.19mi |
| 200 Clemmer St Unit A Corpus Christi, TX | 3.0 | 1.0 | 950 | $1,199 | $1.26 | 45d | 1 | 0.50mi |
| 225 Watson St Corpus Christi, TX | 3.0 | 1.0 | 1472 | $1,295 | $0.88 | 45d | 1 | 0.59mi |
| 1201 York Ave Corpus Christi, TX | 3.0 | 1.0 | 888 | $1,550 | $1.75 | 23d | 1 | 0.61mi |
| 1525 S 19th St Unit B Corpus Christi, TX | 3.0 | 2.0 | 1062 | $2,100 | $1.98 | 15d | 1 | 0.70mi |
| 2522 Cleo St Corpus Christi, TX | 3.0 | 1.0 | 992 | $1,350 | $1.36 | 15d | 1 | 0.70mi |
| 1628 18th St Corpus Christi, TX | 2.0 | 1.0 | 1112 | $1,000 | $0.90 | 45d | 1 | 0.72mi |
| 2333 Riggan St Corpus Christi, TX | 2.0 | 1.0 | 856 | $1,250 | $1.46 | 45d | 1 | 0.72mi |
| 2402 Segrest St Corpus Christi, TX | 2.0 | 1.0 | 1120 | $825 | $0.74 | 23d | 1 | 0.84mi |
| 1837 Horne Rd Corpus Christi, TX | 3.0 | 2.0 | 1226 | $1,800 | $1.47 | 45d | 1 | 0.86mi |
| 815 Ohio Ave Unit 3 Corpus Christi, TX | 2.0 | 1.0 | 748 | $985 | $1.32 | 45d | 1 | 0.92mi |
| 1634 14th St Corpus Christi, TX | 2.0 | 1.5 | 980 | $1,090 | $1.11 | 45d | 1 | 0.96mi |
| 1446 Annapolis Dr Corpus Christi, TX | 3.0 | 2.0 | 1500 | $1,700 | $1.13 | 45d | 1 | 0.96mi |
| 2106 Harvard St Corpus Christi, TX | 3.0 | 1.0 | 912 | $1,225 | $1.34 | 45d | 1 | 0.98mi |
| 2122 Harvard St Corpus Christi, TX | 2.0 | 1.0 | 858 | $1,250 | $1.46 | 15d | 1 | 0.98mi |
| 2041 Harvard St Corpus Christi, TX | 3.0 | 2.0 | 1230 | $1,400 | $1.14 | 15d | 1 | 1.01mi |
| 1522 Cambridge Dr Corpus Christi, TX | 3.0 | 1.5 | 1278 | $1,600 | $1.25 | 45d | 1 | 1.07mi |
| 1802 Morgan Ave Unit 1802 Corpus Christi, TX | 2.0 | 1.0 | 850 | $1,250 | $1.47 | 23d | 1 | 1.08mi |
| 4326 Vestal St Corpus Christi, TX | 3.0 | 1.0 | 984 | $1,125 | $1.14 | 15d | 1 | 1.11mi |
| 1114 25th St Corpus Christi, TX | 1.0–2.0 | 1.0 | 712 | $1,050 | $1.47 | 15d | 6 | 1.13mi |
| 1433 12th St Corpus Christi, TX | 2.0 | 1.0 | 768 | $1,050 | $1.37 | 45d | 1 | 1.13mi |
| 1534 Lazy Ln Corpus Christi, TX | 3.0 | 1.0 | 800 | $1,195 | $1.49 | 23d | 1 | 1.24mi |
| 4005 Green Grove Dr Corpus Christi, TX | 3.0 | 2.0 | 1406 | $1,695 | $1.21 | 45d | 1 | 1.24mi |
| 1521 7th St Corpus Christi, TX | 2.0 | 2.0 | 850 | $1,250 | $1.47 | 15d | 1 | 1.27mi |
| 443 Indiana Ave Corpus Christi, TX | 2.0 | 1.0 | 968 | $1,650 | $1.70 | 45d | 1 | 1.31mi |
| 1124 Morgan Ave Unit 1268437P Corpus Christi, TX | 2.0 | 1.0 | 721 | $2,081 | $2.89 | 45d | 1 | 1.31mi |
| 4241 Green Grove Dr Corpus Christi, TX | 3.0 | 2.0 | 1345 | $1,700 | $1.26 | 45d | 1 | 1.40mi |
| 1318 6th St Corpus Christi, TX | 2.0 | 1.0 | 900 | $900 | $1.00 | 15d | 1 | 1.42mi |
| 330 Texas Ave Corpus Christi, TX | 2.0 | 1.0 | 806 | $1,300 | $1.61 | 45d | 1 | 1.45mi |
| 2833 Lawnview St Corpus Christi, TX | 2.0 | 1.0 | 850 | $1,000 | $1.18 | 15d | 1 | 1.46mi |
| 616 16th St Unit A Corpus Christi, TX | 3.0 | 1.0 | 1040 | $1,050 | $1.01 | 45d | 1 | 1.47mi |
| 332 Rosebud Ave Corpus Christi, TX | 2.0 | 1.0 | 942 | $1,150 | $1.22 | 23d | 1 | 1.48mi |
Listing history 21 events
-
2026-06-21days on market $54,500 Active 101 DOM
-
2026-06-18days on market $54,500 Active 98 DOM
-
2026-06-17days on market $54,500 Active 97 DOM
-
2026-06-16days on market $54,500 Active 96 DOM
-
2026-06-15days on market $54,500 Active 95 DOM
-
2026-06-14days on market $54,500 Active 93 DOM
-
2026-06-10days on market $54,500 Active 90 DOM
-
2026-06-09days on market $54,500 Active 89 DOM
-
2026-06-08days on market $54,500 Active 88 DOM
-
2026-06-07pricedays on market $54,500 Active 87 DOM
-
2026-06-05days on market $59,500 Active 84 DOM
-
2026-06-03days on market $59,500 Active 83 DOM
-
2026-06-02days on market $59,500 Active 82 DOM
-
2026-06-01days on market $59,500 Active 81 DOM
-
2026-05-31days on market $59,500 Active 80 DOM
-
2026-05-30days on market $59,500 Active 79 DOM
-
2026-05-14price $59,500 489-char remark
Show marketing remark (489 chars)
Charming 3-bedroom, 1-bath home in Corpus Christi offering 1,064 square feet of opportunity and potential. This property features a spacious layout with great natural light and a large backyard perfect for entertaining, pets, or future additions. Whether you’re looking for your next investment or a place to truly make your own, this home is ready for your personal touch. Conveniently located and full of possibilities, it’s waiting for you to turn it into something special.
-
2026-05-11price $69,000 489-char remark
Show marketing remark (489 chars)
Charming 3-bedroom, 1-bath home in Corpus Christi offering 1,064 square feet of opportunity and potential. This property features a spacious layout with great natural light and a large backyard perfect for entertaining, pets, or future additions. Whether you’re looking for your next investment or a place to truly make your own, this home is ready for your personal touch. Conveniently located and full of possibilities, it’s waiting for you to turn it into something special.
-
2026-03-24price $75,000 489-char remark
Show marketing remark (489 chars)
Charming 3-bedroom, 1-bath home in Corpus Christi offering 1,064 square feet of opportunity and potential. This property features a spacious layout with great natural light and a large backyard perfect for entertaining, pets, or future additions. Whether you’re looking for your next investment or a place to truly make your own, this home is ready for your personal touch. Conveniently located and full of possibilities, it’s waiting for you to turn it into something special.
-
2026-03-12$80,000 Active 489-char remark
Show marketing remark (489 chars)
Charming 3-bedroom, 1-bath home in Corpus Christi offering 1,064 square feet of opportunity and potential. This property features a spacious layout with great natural light and a large backyard perfect for entertaining, pets, or future additions. Whether you’re looking for your next investment or a place to truly make your own, this home is ready for your personal touch. Conveniently located and full of possibilities, it’s waiting for you to turn it into something special.
-
2026-02-11$80,000 Active
ⓘ Source: listings_history table (triggers on properties + properties_extension) + one-shot
backfill from property_details.listing_events for pre-trigger history.
Tax reassessment forecast TX · Resets to sale price
- Current annual tax
- $2,594 · $216/mo
- Projected year-2 tax
- $2,594 · $216/mo
- Expected delta
- $0/yr ($0/mo · 0.0%)
ⓘ Screening estimate from a state-policy table — verify with the county assessor before closing.
Climate risk First Street
- Flood 1/10 Low FEMA zone X (unshaded) · 0% chance over 30 yrs
- Wildfire 1/10 Low
- Heat 10/10 Extreme 7 d/yr ≥107°F today · 26 d/yr by 30 yrs out
- Wind 9/10 Extreme 99% chance of damaging wind over 30 yrs
- Air quality 1/10 Low 0 unhealthy d/yr today · 0 by 30 yrs out
Nearby sold comps map
Loading sold comps map…
Walkable amenities ~0.75 mi
Loading nearby amenities…
Taxation est. · year 1
- Rental income
- $18,123
- − Mortgage interest
- −$3,053
- − Property taxes
- −$2,594
- − Insurance
- −$272
- − Repairs & maintenance
- −$1,450
- − Management
- −$1,450
- − Depreciation
- −$1,585
- Taxable income
- $7,719
- Est. tax owed @ 24.0%
- −$1,853
- After-tax cash flow
- $6,169/yr
For passive investors: Depreciation is non-cash, so a rental often shows a tax loss while cash-flowing — sheltering income. Rental losses are passive: they offset passive income freely, and up to $25,000/yr can offset ordinary (W-2) income if you actively participate and your MAGI is under $100k (phasing out to $0 by $150k); unused losses carry forward. On sale, claimed depreciation is recaptured at up to 25%, and gains may owe capital-gains tax (a 1031 exchange can defer both). Figures are a year-1 estimate at your 24.0% rate — not tax advice; consult a CPA.
Schools (NCES district)
- District
- Corpus Christi ISD
- NCES district ID
- 4815270
- Math proficiency
- 31% ▼ -18.00%
- Reading proficiency
- 35% ▼ -7.00%
- Median HH income
- $45,672
- Composite
- 28.27/100
- National rank
- #6793
- State rank
- #562 of 826 in TX
Livability — Corpus Christi
- Score
- 78/100
- State rank
- #66
- US rank
- #2404
Category grades
Schools grade is shown separately in the Schools card above.
Census & demographics
- Census place
- Corpus Christi, TX
- County
- Nueces County · 296,836 people
- City population
- 296,836
- Metro
- Corpus Christi, TX
- Population (ZIP)
- 43,080
- Household income
- $54,990
- Rent vs Own
- Severe rent burden
- 1730.0
Population outlook (Nueces County) Hauer SSP2
- Today (2025)
- 418,037 people
- By 2030
- 447,123 · +7.0%
- By 2040
- 505,911 · +21.0%
- By 2050
- 567,522 · +35.8%
- By 2075
- 729,686 · +74.6%
- By 2100
- 847,087 · +102.6%
Race, ethnicity, and origin ACS 2023
- Neighborhood character
- Predominantly Hispanic (83%)
- Race & ethnicity
- Hispanic / Latino 83% Two or more races 41% White 12% Black 3%
- Hispanic origin (detail)
- Mexican 75%
- Foreign-born
- 9% · Canada
- Languages at home
- 59% English-only · Spanish 40%
Political lean MEDSL · Nueces
- 2024 margin
- R (+11.5) · D 43.8% · R 55.3%
- 2008→2024 swing
- -7.1pp toward R · 2008: -4.4pp · 2024: -11.5pp
- All cycles
- 2024: R+11.5 2020: R+2.9 2016: R+1.5 2012: R+3.2 2008: R+4.4
Not yet ingested
- Civics
- —
Market trends
- HPI YoY
- ▼ -173.20%
- Current HPI
- 158.011
- Rent YoY
- ▲ 2.32%
- Metro
- Corpus Christi, TX
- State GDP YoY
- ▲ 3.95%
- F500 in state
- 110
Industry mix (Fortune 500 HQ in TX)
| Industry | F500 HQs | Revenue |
|---|---|---|
| Energy | 16 | $1,198B |
|
||
| Technology | 5 | $198B |
|
||
| Engineering / Construction | 4 | $72B |
|
||
| Energy Services | 3 | $60B |
|
||
| Utilities | 3 | $41B |
|
||
| Healthcare | 2 | $330B |
|
||
Price history
-25.6% since first listed5 events — show timeline
- 2026-05-14 Price Changed $59,500 CBMLS
- 2026-05-11 Price Changed $69,000 CBMLS
- 2026-03-24 Price Changed $75,000 CBMLS
- 2026-03-12 Listed $80,000 CBMLS
- 2026-02-11 Listed $80,000 CBMLS
Property tax history
+5.9%/yrLatest (2025): $2,594 · +22.1% YoY. Source: county tax records.
Cash-flow waterfall
monthlySold comps — $/sqft
last 12 mo · ≤1 miLoading sold comps…