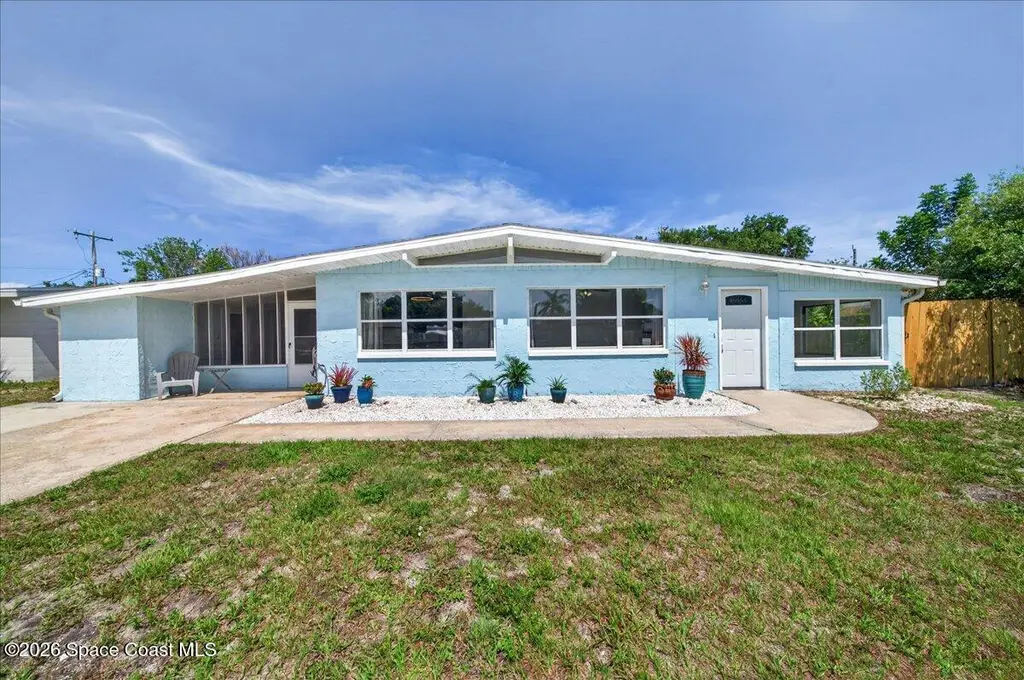
808 7th St · Merritt Island, FL
Flood risk 9/10 · Severe
- FEMA flood zone
- X (shaded)
- Chance of flooding over 30 yrs
- 0.99%
- Est. flood insurance / yr
- $507 – $1,088
Fire risk 3/10 · Minor
- Est. fire insurance / yr
- $947 – $1,759
Heat risk 10/10 · Severe
- Hot days now (above 106°F)
- 7 days/yr
- Hot days in 30 yrs
- 23 days/yr
Wind risk 10/10 · Severe
- Chance of severe wind over 30 yrs
- 99.0%
Air-quality risk 1/10 · Minimal
- Unhealthy air days now
- 0 days/yr
- Unhealthy air days in 30 yrs
- 0 days/yr
Risk factors via First Street. Map © Google.
Why this score? — see what drove the F grade
The composite is a weighted blend of 9 inputs, each scored 0–100. Each bar is that input's sub-score; the figure is the points it added to the 100-point composite (weight × sub-score).
- Cash flow +8.4/30.0
- ARV discount +7.5/15.0
- Schools +4.7/10.0
- Livability +3.5/5.0
- Rent growth +3.0/5.0
- Condition / age +2.5/5.0
- DSCR +2.3/10.0
- 1% rule +1.9/10.0
- Appreciation +0.0/10.0
$349,000
🖨 Deal sheet 📄 Offer letter ✓ Due diligence
Listing remarks MLS
This charming 4 bedroom, 3 bathroom home is located perfectly in the center of Merritt Island with great proximity to beaches, shopping, and schools. LVP flooring throughout main house and tile in Mother-in-Law suite. Freshly painted interior. Roof less than 6 years old, AC and water heater 4 years old. Lots of potential with mother-in-law suite being attached to main house as well. Could easily be rented out and has its own separate entrance with a shared screened in porch.
Key facts
- Oversized yard
- Attached en suite
- No hoa restrictions
Tags
Property features AI
Exterior
- Parking: Off-street parking
- Utilities: Public sewer; Electricity connected; Water connected; Sewer connected
- Home design: Single family residence; One-story entry; Faces west
- Construction: Block construction
- Exterior features: Covered screened porch; Fenced backyard; Lot features: Other
Interior
- Kitchen: Dishwasher; Electric range; Refrigerator
- Bedrooms: 4 bedrooms
- Flooring: Laminate flooring; Tile flooring
- Bathrooms: 3 full bathrooms
- Heating & cooling: Central heating; Electric cooling
- Interior features: Unfurnished; Covered, screened porch
- Laundry & utility: Utilities: electricity, water and sewer connected
Neighborhood map
What this means for you Summary
Snapshot
- This is a 3-bed/2.0-bath single-family listed at $349k.
Deal economics
- At list price, monthly cash flow is $-382 ($-5k/yr) — negative.
- To cash-flow at today's rent, offer at most $281k (19.4% below list).
- To meet the 1% rule (rent ≥ 1% of price), the offer needs to be $242k (30.7% below list).
- Recommended offer: $242k (30.7% below list) — sets the bar for 1% rule.
Location & tenants
- Location reads 70/100 on livability (#441 in FL) — a middle-class / working-renter tenant base. Strengths: crime A+, housing A+, employment A-; Watch: amenities F, commute F, health & safety D-.
- Brevard (suburban): math 53% / reading 57% proficiency, ranked #19 of 73 in FL (top 26%) — acceptable for families but not a draw, mixed tenant base, ~2y average lease.
- Zoned schools: Mila Elementary School (math 37% / reading 46%, grade F, #1,437 of 2,144 statewide, top 68%, 433 students, 70% FRL); Thomas Jefferson Middle School (math 63% / reading 55%, grade B, #144 of 571 statewide, top 26%, 608 students, 43% FRL); Merritt Island High School (math 32% / reading 55%, grade F, #248 of 667 statewide, top 38%, 1,546 students, 35% FRL).
- Market conditions: Rents rising (+2.1%/yr); 219 active listings in the ZIP; 21 comparable units currently listed for rent nearby; rentals at typical pace (median 24d on market — plan ~3-4 weeks tenant-placement turnaround); solid renter incomes; 4,602 units permitted in Brevard County in 2024 (702 in 5+ unit buildings).
- This rent runs 33% of the median local income ($87k/yr) — at the standard rent-burdened threshold; future hikes will face affordability resistance.
Forward outlook
- Local home prices are declining (-3.0%/yr); year-one equity from $2k of loan paydown is wiped out by about $10k of value loss. Plan a longer hold.
- Brevard County population projected at +15% by 2050 — modest demand growth; plan on rents tracking national, not racing it.
Negotiation context
- It's been on market 24 days — a 2% lower offer ($344k) is reasonable based on typical stale-listing flexibility.
- 5 sale attempts since 6y ago with the ask held roughly flat each time — persistent listings suggest the price (not the market) is what's stuck; bring a comps-based counter.
- Current owner paid $265k; 32% above their basis — modest negotiation headroom, anchor on the comps not their cost.
Risks & watch-outs
- Watch-outs: flood insurance adds $66/mo.
- Climate carrying-cost: severe flood risk; severe wind risk, 99% chance of damaging wind over 30y; extreme-heat days projected 7→23/yr by 2055 (HVAC capex compounding) — expect insurance premiums to compound above CPI over the hold.
Questions for the listing agent
- What do current leases actually rent for vs. the listed asking? Can we see a recent rent roll and the last 12 months of T-12 income?
- Built in 1961 — when were the roof, HVAC, electrical panel, plumbing, and water heater last replaced?
- What's the actual annual flood-insurance premium (NFIP or private), and is the property in a SFHA with mandatory coverage?
- Is there a deadline driving the sale (1031 exchange, divorce, estate, relocation)? That informs how much negotiation room exists.
- Schools are B-rated — typically a magnet for longer-tenancy family renters. What's the average tenant stay here, and is there a school-zone premium baked into asking?
- The area grade is low — what's the realistic commute time and amenity access for the typical tenant pool here? Any planned neighborhood developments (good or bad) we should know about?
- What's the average days-on-market for RENTAL listings here right now (not sales)? A rising rental-DOM trend means longer vacancies and softer asking-rent achievability than the comps imply.
- What's the recent tenant-quality profile in this submarket — average credit score on applications, eviction rate, late-payment / NSF rate, and stable-employment percentage? A property-management company in the area should have these aggregated.
- How much new for-sale + rental construction is in the pipeline within 1–3 miles? Heavy new supply typically softens prices + rents 12–24 months out; constrained supply supports both.
Investment metrics
- 1% rule
- 0.69% ✗
- Cap rate
- 5.21%
- Cash-on-cash
- -3.88%
- DSCR
- 0.83
- GRM
- 12.0
CMA / ARV
No comps found within radius.
Projected returns pro-forma
-3.0% appreciation · 2.12% rent growth · sell at horizon
- IRR
- -25.2%
- Equity multiple
- 0.15×
- Total profit
- $-83,061
- Equity at exit
- $52,037
- IRR
- -24.0%
- Equity multiple
- -0.15×
- Total profit
- $-112,390
- Equity at exit
- $30,175
Cash invested: $97,720 (down + closing). Projections, not guarantees.
Landlord ↔ Tenant lean methodology
- Overall (STATE)
- 87 Strongly Landlord-Friendly
- State Florida
- 87 Strongly Landlord-Friendly · R+3
- County
- — inherits STATE
- City
- — inherits STATE
ZIP-level market 32953
- Home prices YoY
- -34.5%
- Rents YoY
- 2.1%
- Active inventory
- 219
- Price-to-rent
- 12.0×
Monthly cashflow live
- Estimated rent
- $2,420 high interval (Pro) →
- Mortgage (P&I)
- −$1,830
- Tax from tax record
- −$252 /mo · $3,022/yr
- Insurance
- −$145
- Flood insurance flood zone
- −$66 /mo · $798/yr
- HOA
- −$0
- Vacancy / Maint / Mgmt
- −$508
- Net cashflow
- $-382
Break-even live
UW: 25.0% down · 7.5% · 30yr · 1.5% tax · 5.0% vac · 8.0% maint · 8.0% mgmt
Financing live
Cash to close
- Down payment
- $87,250
- Closing costs
- $10,470
- Reserves months
- —
- Total cash needed
- —
Loan-product check · same deal, 3 products live
Conventional
25% down · 7.5% · 30yr
- Down + closing
- —
- Monthly P&I
- —
- Monthly cashflow
- —
- DSCR
- —
- Eligible?
- —
Personal DTI + credit; lowest rate.
DSCR
20% down · 8.5% · 30yr
- Down + closing
- —
- Monthly P&I
- —
- Monthly cashflow
- —
- DSCR
- —
- Eligible?
- —
No personal income docs; deal must DSCR.
Hard money
10% down · 12.0% · 12mo
- Down + closing
- —
- Monthly P&I
- —
- Monthly cashflow
- —
- DSCR
- —
- Eligible?
- —
Short-term bridge; refi at stabilization.
Rent comps 21 comps
| Address | Beds | Baths | Sqft | Rent | $/sqft | DOM | Units | Dist |
|---|---|---|---|---|---|---|---|---|
| 205 Palmetto Ave Merritt Island, FL | 2.0 | 2.0 | 1033 | $1,625 | $1.57 | 23d | 2 | 0.35mi |
| 145 Needle Blvd Merritt Island, FL | 4.0 | 2.0 | 1314 | $3,250 | $2.47 | 23d | 1 | 0.40mi |
| 215 Richland Ave Unit 1044313P Merritt Island, FL | 3.0 | 2.0 | 1184 | $4,648 | $3.93 | 14d | 1 | 0.50mi |
| 55 Needle Blvd Merritt Island, FL | 2.0 | 1.5 | 900 | $1,545 | $1.72 | 14d | 2 | 0.53mi |
| 55 Needle Blvd Merritt Island, FL | 2.0 | 1.5 | 900 | $1,525 | $1.69 | 23d | 2 | 0.53mi |
| 50 Needle Blvd #28 Merritt Island, FL | 2.0 | 1.5 | 900 | $1,550 | $1.72 | 23d | 1 | 0.55mi |
| 140 McLeod St Unit 1513829P Merritt Island, FL | 3.0 | 2.0 | 1323 | $3,291 | $2.49 | 19d | 1 | 0.68mi |
| 200 S Sykes Creek Pkwy #702 Merritt Island, FL | 2.0 | 2.0 | 1307 | $2,390 | $1.83 | 23d | 1 | 0.76mi |
| 140 Minna Ln Merritt Island, FL | 2.0 | 1.0 | 775 | $1,250 | $1.61 | 14d | 1 | 0.79mi |
| 388 Hibiscus Ave Merritt Island, FL | 2.0 | 1.0 | 720 | $1,650 | $2.29 | 23d | 1 | 0.90mi |
| 480 Nancie Ave Merritt Island, FL | 3.0 | 2.0 | 888 | $2,100 | $2.36 | 23d | 1 | 1.08mi |
| 225 S Tropical Trl Merritt Island, FL | 1.0–2.0 | 1.0–2.0 | 779 | $2,800 | $3.59 | 14d | 4 | 1.10mi |
| 225 S Tropical Trl Merritt Island, FL | 1.0–2.0 | 1.0–2.0 | 779 | $2,800 | $3.59 | 23d | 4 | 1.10mi |
| 489 Seacrest Ave Unit 1325661P Merritt Island, FL | 3.0 | 2.0 | 1173 | $4,320 | $3.68 | 14d | 1 | 1.16mi |
| 735 Pilot Ln #503 Merritt Island, FL | 2.0 | 2.0 | 1334 | $2,700 | $2.02 | 23d | 1 | 1.20mi |
| 701 Pilot Ln Unit 1499904P Merritt Island, FL | 2.0 | 2.0 | 1323 | $3,978 | $3.01 | 21d | 1 | 1.21mi |
| 735 Pilot Ln #1009 Merritt Island, FL | 2.0 | 2.0 | 1334 | $2,850 | $2.14 | 23d | 1 | 1.23mi |
| 225 Ligustrum Ln Merritt Island, FL | 1.0–2.0 | 1.0 | 640 | $1,275 | $1.99 | 19d | 1 | 1.23mi |
| 1155 N Courtenay Pkwy Merritt Island, FL | 2.0 | 1.0 | 750 | $1,434 | $1.91 | 23d | 1 | 1.28mi |
| 1525 Polaris St Merritt Island, FL | 3.0 | 2.0 | 1462 | $2,400 | $1.64 | 14d | 1 | 1.46mi |
| 1315 Lester Ct Merritt Island, FL | 3.0 | 2.0 | 1462 | $2,350 | $1.61 | 23d | 1 | 1.47mi |
Listing history 28 events
-
2026-06-18days on market $349,000 Active 24 DOM
-
2026-06-17days on market $349,000 Active 23 DOM
-
2026-06-16days on market $349,000 Active 22 DOM
-
2026-06-15days on market $349,000 Active 21 DOM
-
2026-06-14days on market $349,000 Active 19 DOM
-
2026-06-10days on market $349,000 Active 16 DOM
-
2026-06-08days on market $349,000 Active 14 DOM
-
2026-06-07days on market $349,000 Active 13 DOM
-
2026-06-05days on market $349,000 Active 10 DOM
-
2026-06-03days on market $349,000 Active 9 DOM
-
2026-06-02days on market $349,000 Active 8 DOM
-
2026-06-01days on market $349,000 Active 7 DOM
-
2026-05-31days on market $349,000 Active 6 DOM
-
2026-05-31days on market $349,000 Active 5 DOM
-
2026-05-25$349,000 Active
-
2022-11-02soldstatus $265,000 Closed 479-char remark
Show marketing remark (479 chars)
This charming 4 bedroom, 3 bathroom home is located perfectly in the center of Merritt Island with great proximity to beaches, shopping, and schools. LVP flooring throughout main house and tile in Mother-in-Law suite. Freshly painted interior. Roof less than 6 years old, AC and water heater 4 years old. Lots of potential with mother-in-law suite being attached to main house as well. Could easily be rented out and has its own separate entrance with a shared screened in porch.
-
2022-09-24historical Backups 479-char remark
Show marketing remark (479 chars)
This charming 4 bedroom, 3 bathroom home is located perfectly in the center of Merritt Island with great proximity to beaches, shopping, and schools. LVP flooring throughout main house and tile in Mother-in-Law suite. Freshly painted interior. Roof less than 6 years old, AC and water heater 4 years old. Lots of potential with mother-in-law suite being attached to main house as well. Could easily be rented out and has its own separate entrance with a shared screened in porch.
-
2022-09-16$265,000 Active
-
2022-09-15$265,000 Active 479-char remark
Show marketing remark (479 chars)
This charming 4 bedroom, 3 bathroom home is located perfectly in the center of Merritt Island with great proximity to beaches, shopping, and schools. LVP flooring throughout main house and tile in Mother-in-Law suite. Freshly painted interior. Roof less than 6 years old, AC and water heater 4 years old. Lots of potential with mother-in-law suite being attached to main house as well. Could easily be rented out and has its own separate entrance with a shared screened in porch.
-
2021-11-10historical
-
2021-11-05$245,000 Active
-
2021-02-05soldstatus $225,000 Closed
-
2021-02-05soldstatus $225,000
-
2020-12-23historical Backups
-
2020-12-22$212,000 Active
-
2017-12-27soldstatus $90,000
-
1980-02-01soldstatus $42,000
-
1973-12-01soldstatus $19,000
ⓘ Source: listings_history table (triggers on properties + properties_extension) + one-shot
backfill from property_details.listing_events for pre-trigger history.
Tax reassessment forecast FL · Resets to sale price
- Current annual tax
- $3,022 · $252/mo
- Projected year-2 tax
- $3,022 · $252/mo
- Expected delta
- $0/yr ($0/mo · 0.0%)
ⓘ Screening estimate from a state-policy table — verify with the county assessor before closing.
Climate risk First Street
- Flood 9/10 Extreme FEMA zone X (shaded) · 99% chance over 30 yrs
- Wildfire 3/10 Moderate
- Heat 10/10 Extreme 7 d/yr ≥106°F today · 23 d/yr by 30 yrs out
- Wind 10/10 Extreme 99% chance of damaging wind over 30 yrs
- Air quality 1/10 Low 0 unhealthy d/yr today · 0 by 30 yrs out
Nearby sold comps map
Loading sold comps map…
Walkable amenities ~0.75 mi
Loading nearby amenities…
Taxation est. · year 1
- Rental income
- $29,037
- − Mortgage interest
- −$19,549
- − Property taxes
- −$3,022
- − Insurance
- −$2,542
- − Repairs & maintenance
- −$2,323
- − Management
- −$2,323
- − Depreciation
- −$10,153
- Taxable loss
- −$10,875
- Est. tax savings @ 24.0%
- +$2,610
- After-tax cash flow
- $-1,977/yr
For passive investors: Depreciation is non-cash, so a rental often shows a tax loss while cash-flowing — sheltering income. Rental losses are passive: they offset passive income freely, and up to $25,000/yr can offset ordinary (W-2) income if you actively participate and your MAGI is under $100k (phasing out to $0 by $150k); unused losses carry forward. On sale, claimed depreciation is recaptured at up to 25%, and gains may owe capital-gains tax (a 1031 exchange can defer both). Figures are a year-1 estimate at your 24.0% rate — not tax advice; consult a CPA.
Schools (NCES district)
- District
- Brevard
- NCES district ID
- 1200150
- Math proficiency
- 53% ▼ -9.00%
- Reading proficiency
- 57% ▼ -4.00%
- Median HH income
- $49,426
- Composite
- 46.86/100
- National rank
- #2370
- State rank
- #19 of 73 in FL
Livability — Merritt Island
- Score
- 70/100
- State rank
- #441
- US rank
- #7878
Category grades
Schools grade is shown separately in the Schools card above.
Census & demographics
- Census place
- Merritt Island, FL
- County
- Brevard County · 602,871 people
- City population
- 46,372
- Metro
- Palm Bay-Melbourne-Titusville, FL
- Population (ZIP)
- 24,759
- Household income
- $87,262
- Rent vs Own
- Severe rent burden
- 849.0
Population outlook (Brevard County) Hauer SSP2
- Today (2025)
- 623,254 people
- By 2030
- 648,420 · +4.0%
- By 2040
- 690,009 · +10.7%
- By 2050
- 715,669 · +14.8%
- By 2075
- 775,744 · +24.5%
- By 2100
- 776,687 · +24.6%
Race, ethnicity, and origin ACS 2023
- Neighborhood character
- Predominantly White (77%)
- Race & ethnicity
- White 77% Hispanic / Latino 13% Two or more races 7% Black 4% Asian 3%
- Hispanic origin (detail)
- Mexican 2% Puerto Rican 6%
- Common ancestry
- Slovak 3% Romanian 3% Lithuanian 3%
- Foreign-born
- 9% · Canada, China, Jamaica
- Languages at home
- 87% English-only · Spanish 8% Tagalog/Filipino 2% French/Haitian/Cajun 1%
Political lean MEDSL · Brevard
- 2024 margin
- Strong R (+20.8) · D 39.1% · R 59.9% · Other 1.0%
- 2008→2024 swing
- -10.4pp toward R · 2008: -10.4pp · 2024: -20.8pp
- All cycles
- 2024: R+20.8 2020: R+16.4 2016: R+19.8 2012: R+12.7 2008: R+10.4
Not yet ingested
- Civics
- —
Market trends
- HPI YoY
- ▼ -168.76%
- Current HPI
- 320.1966
- Rent YoY
- ▲ 2.12%
- Metro
- Palm Bay-Melbourne-Titusville, FL
- State GDP YoY
- ▲ 3.28%
- F500 in state
- 36
Industry mix (Fortune 500 HQ in FL)
| Industry | F500 HQs | Revenue |
|---|---|---|
| Industrial Technology | 2 | $29B |
|
||
| Insurance | 2 | $17B |
|
||
| Retail | 1 | $60B |
|
||
| Technology Distribution | 1 | $58B |
|
||
| Homebuilding | 1 | $35B |
|
||
| Technology Manufacturing | 1 | $35B |
|
||
Price history
+1736.8% since first listed14 events — show timeline
- 2026-05-25 Listed $349,000 SCMLS
- 2022-11-02 Sold (MLS) $265,000 SCMLS
- 2022-09-24 Contingent — SCMLS
- 2022-09-16 Listed $265,000 Stellar MLS as Distributed by MLS Grid
- 2022-09-15 Listed $265,000 SCMLS
- 2021-11-10 Listing Removed — SCMLS
- 2021-11-05 Listed $245,000 SCMLS
- 2021-02-05 Sold (Public Records) $225,000 Public Records
- 2021-02-05 Sold (MLS) $225,000 SCMLS
- 2020-12-23 Contingent — SCMLS
- 2020-12-22 Listed $212,000 SCMLS
- 2017-12-27 Sold (Public Records) $90,000 Public Records
- 1980-02-01 Sold (Public Records) $42,000 Public Records
- 1973-12-01 Sold (Public Records) $19,000 Public Records
Property tax history
+16.9%/yrLatest (2025): $3,022 · -0.0% YoY. Source: county tax records.
Cash-flow waterfall
monthlySold comps — $/sqft
last 12 mo · ≤1 miLoading sold comps…