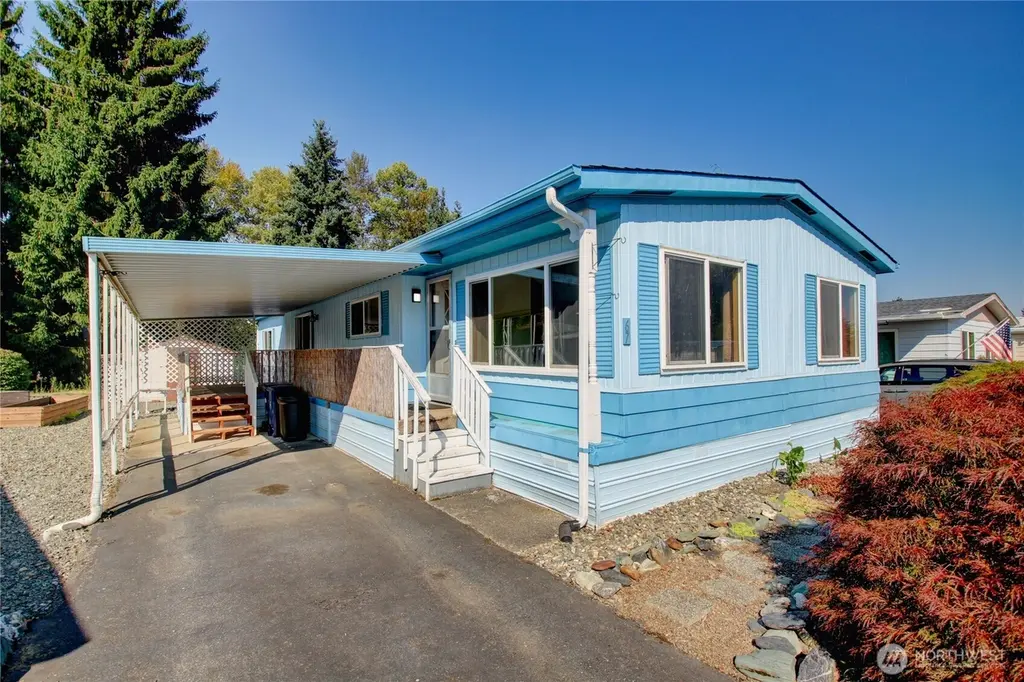
2725 E Fir St #67 · Mount Vernon, WA
Flood risk 4/10 · Minor
- FEMA flood zone
- X
- Chance of flooding over 30 yrs
- 0.22%
- Est. flood insurance / yr
- $507 – $1,088
Fire risk 3/10 · Minor
- Est. fire insurance / yr
- $604 – $1,122
Heat risk 2/10 · Minimal
- Hot days now (above 81°F)
- 8 days/yr
- Hot days in 30 yrs
- 21 days/yr
Wind risk 1/10 · Minimal
- Chance of severe wind over 30 yrs
- —
Air-quality risk 5/10 · Moderate
- Unhealthy air days now
- 7 days/yr
- Unhealthy air days in 30 yrs
- 7 days/yr
Risk factors via First Street. Map © Google.
Why this score? — see what drove the B+ grade
The composite is a weighted blend of 9 inputs, each scored 0–100. Each bar is that input's sub-score; the figure is the points it added to the 100-point composite (weight × sub-score).
- Cash flow +30.0/30.0
- ARV discount +15.0/15.0
- 1% rule +10.0/10.0
- DSCR +10.0/10.0
- Schools +4.0/10.0
- Livability +4.0/5.0
- Rent growth +3.1/5.0
- Condition / age +2.8/5.0
- Appreciation +0.0/10.0
$65,900
🖨 Deal sheet 📄 Offer letter ✓ Due diligence
Listing remarks
NEW Furnace with AC ready Installed. Located in a 55+ community of Park Village just inside the entrance for easy access. Windows and slider have been updated, beautiful laminate flooring in the family room and recently installed same flooring into the kitchen. New carpet installed in main living/dining area. Family room has natural gas free standing fireplace for those chilly nights. Main bedroom with en-suite and second bedroom with direct access to second bathroom makes it pretty handy. Landscaped gardens and raised beds ready for your own flowers or vegetables. Has a fenced area behind the home for a pet to have its own space. Convenient covered deck area. Come take a look.
Key facts
- Laminate flooring
- Fenced area
- Updated windows
Tags
Neighborhood map
What this means for you Summary
Snapshot
- This is a 2-bed/2.0-bath manufactured listed at $66k. Condition is rated average.
Deal economics
- At list price, monthly cash flow is $1k ($15k/yr) — positive.
- The deal already cash-flows at list — no discount required.
- Meets the 1% rule at list price ($2k rent vs $66k).
- Recommended offer: $58k (12.0% below list) — sets the bar for market timing.
- Cap rate 29.5% vs local median 2.4% in Mount Vernon — top-decile yield for the area; either an underpriced asset or a hidden risk that comps aren't pricing in. Stress-test before assuming the spread holds.
Location & tenants
- Location reads 79/100 on livability (#106 in WA, #2,120 nationally) — a middle-class / working-renter tenant base. Strengths: commute A+, housing A+, health & safety A+; Watch: cost of living D+.
- Mount Vernon School District (urban): math 41% / reading 47% proficiency, ranked #189 of 291 in WA (top 65%) — families likely to look elsewhere, expect single-tenant / working-renter base with shorter leases.
- Market conditions: Rents rising (+2.3%/yr); 199 active listings in the ZIP; 10 comparable units currently listed for rent nearby; rentals lingering (median 44d on market — plan ~5-8 weeks vacancy on turnover, expect pricing pressure); 50% of comp listings sitting > 30 days — soft ceiling on asking rent; solid renter incomes; 561 units permitted in Skagit County in 2024 (270 in 5+ unit buildings).
- This rent runs 34% of the median local income ($77k/yr) — at the standard rent-burdened threshold; future hikes will face affordability resistance.
Forward outlook
- Local home prices are declining (-3.0%/yr); year-one equity from $456 of loan paydown is wiped out by about $2k of value loss. Plan a longer hold.
- Skagit County population projected at +11% by 2050 — modest demand growth; plan on rents tracking national, not racing it.
- At projected returns (-3.0% appreciation + 2.3% rent growth), your $18k cash investment doubles in ~2 years — after that, you're playing with house money.
Negotiation context
- It's been on market 284 days — a 12% lower offer ($58k) is reasonable based on typical stale-listing flexibility.
- 2 sale attempts; this cycle's ask has dropped $14k (18%) from the opening price — seller is motivated, your offer sets the floor, not the list.
Questions for the listing agent
- It's been on market 284 days. Have you received any prior offers? Is the seller open to a 12% concession, seller financing, or rate buy-down credit?
- Built in 1976 — when were the roof, HVAC, electrical panel, plumbing, and water heater last replaced?
- Why hasn't it sold? Are there any deal-killer items the seller is aware of (foundation, flood, title, zoning, code violations)?
- Is there a deadline driving the sale (1031 exchange, divorce, estate, relocation)? That informs how much negotiation room exists.
- What's the average days-on-market for RENTAL listings here right now (not sales)? A rising rental-DOM trend means longer vacancies and softer asking-rent achievability than the comps imply.
- What's the recent tenant-quality profile in this submarket — average credit score on applications, eviction rate, late-payment / NSF rate, and stable-employment percentage? A property-management company in the area should have these aggregated.
- How much new for-sale + rental construction is in the pipeline within 1–3 miles? Heavy new supply typically softens prices + rents 12–24 months out; constrained supply supports both.
Investment metrics
- 1% rule
- 3.33% ✓
- Cap rate
- 29.54%
- Cash-on-cash
- 83.01%
- DSCR
- 4.69
- GRM
- 2.5
CMA / ARV
- ARV (median comp)
- $92,375
- List price
- $65,900
- Delta
- -28.66%
- Verdict
- UNDERPRICED
- Comps
- 15 within 1.0 mi
Show comp detail 12 sales within ~0.75 mi
| Address | Dist | Beds/Ba | Sqft | Sold | Price | $/sf | Match |
|---|---|---|---|---|---|---|---|
| 2725 E Fir St #106 | 0.00mi | 2/2.0 | 1,440 (-2%) | 4mo | $52,000 | $36 | 94 |
| 2725 E Fir #99 | 0.03mi | 2/2.0 | 1,524 (+4%) | 9mo | $82,000 | $54 | 84 |
| 2725 E Fir St #85 | 0.03mi | 2/2.0 | 1,428 (-2%) | 13mo | $115,000 | $81 | 84 |
| 2725 E Fir #98 | 0.04mi | 3/2.0 (+1) | 1,578 (+8%) | 7mo | $78,500 | $50 | 75 |
| 2725 E Fir St | 0.03mi | 2/2.0 | 1,334 (-9%) | 11mo | $92,000 | $69 | 74 |
| 2725 E Fir St #13 | 0.03mi | 2/2.0 | 1,344 (-8%) | 13mo | $97,500 | $73 | 74 |
| 2725 E Fir St #41 | 0.04mi | 2/2.0 | 1,248 (-15%) | 1mo | $85,000 | $68 | 73 |
| 2725 E Fir St #84 | 0.04mi | 2/2.0 | 1,280 (-13%) | 10mo | $122,000 | $95 | 69 |
| 2725 Fir St #22 | 0.03mi | 2/2.0 | 1,272 (-13%) | 10mo | $75,500 | $59 | 69 |
| 2725 E Fir St #2 | 0.03mi | 3/2.0 (+1) | 1,344 (-8%) | 14mo | $60,000 | $45 | 69 |
| 1915 N 33rd Pl | 0.68mi | 2/2.0 | 1,274 (-13%) | 4mo | $399,000 | $313 | 44 |
| 1905 N 33rd | 0.65mi | 3/2.0 (+1) | 1,274 (-13%) | 9mo | $480,000 | $377 | 36 |
Match score weights: distance 35% · size 25% · config 20% · recency 20%. Top-matched comps best support the ARV.
Projected returns pro-forma
-3.0% appreciation · 2.33% rent growth · sell at horizon
- IRR
- 82.6%
- Equity multiple
- 4.75×
- Total profit
- $69,182
- Equity at exit
- $9,826
- IRR
- 85.7%
- Equity multiple
- 9.62×
- Total profit
- $159,114
- Equity at exit
- $5,698
Cash invested: $18,452 (down + closing). Projections, not guarantees.
Landlord ↔ Tenant lean methodology
- Overall (STATE)
- 28 Tenant-Leaning
- State Washington
- 28 Tenant-Leaning · D+8
- County
- — inherits STATE
- City
- — inherits STATE
ZIP-level market 98273
- Rents YoY
- 2.3%
- Active inventory
- 199
- Price-to-rent
- 2.5×
Monthly cashflow live
- Estimated rent
- $2,192 high interval (Pro) →
- Mortgage (P&I)
- −$346
- Tax est. 1.5%
- −$82 /mo · $988/yr
- Insurance
- −$27
- HOA
- −$0
- Vacancy / Maint / Mgmt
- −$460
- Net cashflow
- $1,276
Break-even live
UW: 25.0% down · 7.5% · 30yr · 1.5% tax · 5.0% vac · 8.0% maint · 8.0% mgmt
Financing live
Cash to close
- Down payment
- $16,475
- Closing costs
- $1,977
- Reserves months
- —
- Total cash needed
- —
Loan-product check · same deal, 3 products live
Conventional
25% down · 7.5% · 30yr
- Down + closing
- —
- Monthly P&I
- —
- Monthly cashflow
- —
- DSCR
- —
- Eligible?
- —
Personal DTI + credit; lowest rate.
DSCR
20% down · 8.5% · 30yr
- Down + closing
- —
- Monthly P&I
- —
- Monthly cashflow
- —
- DSCR
- —
- Eligible?
- —
No personal income docs; deal must DSCR.
Hard money
10% down · 12.0% · 12mo
- Down + closing
- —
- Monthly P&I
- —
- Monthly cashflow
- —
- DSCR
- —
- Eligible?
- —
Short-term bridge; refi at stabilization.
Rent comps 10 comps
| Address | Beds | Baths | Sqft | Rent | $/sqft | DOM | Units | Dist |
|---|---|---|---|---|---|---|---|---|
| 1521 N 26th St Mount Vernon, WA | 1.0–3.0 | 1.0 | 807 | $1,755 | $2.17 | 21d | 8 | 0.30mi |
| 1115 Nylin Ct Mount Vernon, WA | 3.0 | 1.0 | 1032 | $2,500 | $2.42 | 44d | 1 | 0.46mi |
| 3316 E College Way Unit A Mount Vernon, WA | 3.0 | 1.0 | 916 | $2,000 | $2.18 | 44d | 1 | 0.56mi |
| 119 N 29th Pl Mount Vernon, WA | 3.0 | 1.0 | 1098 | $2,700 | $2.46 | 44d | 1 | 0.63mi |
| 1508 N Waugh Rd Apt B Mount Vernon, WA | 2.0 | 1.0 | 1021 | $2,300 | $2.25 | 21d | 1 | 0.79mi |
| 3129 Arbor St Mount Vernon, WA | 3.0 | 2.0 | 1244 | $2,600 | $2.09 | 21d | 1 | 1.18mi |
| 2430 W Meadow Blvd Mount Vernon, WA | 3.0 | 2.5 | 1400 | $3,000 | $2.14 | 44d | 1 | 1.29mi |
| 1002 S 12th St Mount Vernon, WA | 2.0 | 1.0 | 1052 | $2,575 | $2.45 | 21d | 1 | 1.33mi |
| 1511 Shirley Pl Mount Vernon, WA | 2.0 | 1.0 | 936 | $2,250 | $2.40 | 44d | 1 | 1.36mi |
| 202 Dallas St Mount Vernon, WA | 3.0 | 2.5 | 1582 | $1,375 | $0.87 | 21d | 1 | 1.36mi |
Listing history 23 events
-
2026-06-19days on market $65,900 Active 284 DOM
-
2026-06-18days on market $65,900 Active 283 DOM
-
2026-06-17days on market $65,900 Active 282 DOM
-
2026-06-16days on market $65,900 Active 281 DOM
-
2026-06-15days on market $65,900 Active 280 DOM
-
2026-06-14days on market $65,900 Active 278 DOM
-
2026-06-13days on market $65,900 Active 277 DOM
-
2026-06-10days on market $65,900 Active 275 DOM
-
2026-06-09days on market $65,900 Active 274 DOM
-
2026-06-08days on market $65,900 Active 273 DOM
-
2026-06-07days on market $65,900 Active 272 DOM
-
2026-06-03days on market $65,900 Active 268 DOM
-
2026-06-02days on market $65,900 Active 267 DOM
-
2026-06-01days on market $65,900 Active 266 DOM
-
2026-05-31days on market $65,900 Active 265 DOM
-
2026-05-30days on market $65,900 Active 264 DOM
-
2026-04-13price $65,900
-
2026-03-18price $75,900
-
2026-03-03price $70,000
-
2026-01-10status Active
-
2025-12-30status Pending - Backup Offer Requested
-
2025-10-02price $74,900
-
2025-08-28$79,900 Active
ⓘ Source: listings_history table (triggers on properties + properties_extension) + one-shot
backfill from property_details.listing_events for pre-trigger history.
Climate risk First Street
- Flood 4/10 Moderate FEMA zone X · 22% chance over 30 yrs
- Wildfire 3/10 Moderate
- Heat 2/10 Low 8 d/yr ≥81°F today · 21 d/yr by 30 yrs out
- Wind 1/10 Low
- Air quality 5/10 Major 7 unhealthy d/yr today · 7 by 30 yrs out
Nearby sold comps map
Loading sold comps map…
Walkable amenities ~0.75 mi
Loading nearby amenities…
Taxation est. · year 1
- Rental income
- $26,306
- − Mortgage interest
- −$3,691
- − Property taxes
- −$988
- − Insurance
- −$330
- − Repairs & maintenance
- −$2,105
- − Management
- −$2,105
- − Depreciation
- −$1,917
- Taxable income
- $15,171
- Est. tax owed @ 24.0%
- −$3,641
- After-tax cash flow
- $11,676/yr
For passive investors: Depreciation is non-cash, so a rental often shows a tax loss while cash-flowing — sheltering income. Rental losses are passive: they offset passive income freely, and up to $25,000/yr can offset ordinary (W-2) income if you actively participate and your MAGI is under $100k (phasing out to $0 by $150k); unused losses carry forward. On sale, claimed depreciation is recaptured at up to 25%, and gains may owe capital-gains tax (a 1031 exchange can defer both). Figures are a year-1 estimate at your 24.0% rate — not tax advice; consult a CPA.
Condition & rehab AI · 12 photos
This manufactured home is in average condition with cosmetic updates needed. It has a good layout and is located in a 55+ community, making it suitable for a buyer looking for a move-in ready home.
Repairs flagged
- Minor kitchen cabinets — existing cabinets
- Minor bathroom fixtures — existing fixtures
- Minor exterior paint — blue siding
- Minor interior paint — existing paint
- Minor flooring — existing laminate and carpet
Value-add opportunities
- Both new flooring in kitchen and bathrooms — improves appearance and functionality
- Both new paint throughout — enhances curb appeal and interior aesthetics
- Both new kitchen cabinets — modernizes space and increases functionality
- Both new bathroom fixtures — enhances functionality and aesthetics
Renovation cost estimate screening
| Repair item | Severity | Est. cost |
|---|---|---|
| kitchen cabinets · existing cabinets | Minor | $500–3,000 |
| bathroom fixtures · existing fixtures | Minor | $500–3,000 |
| exterior paint · blue siding | Minor | $500–3,000 |
| interior paint · existing paint | Minor | $500–3,000 |
| flooring · existing laminate and carpet | Minor | $500–3,000 |
| Total estimated repair cost · 5 items | $2,500–15,000 |
Value-add ROI direction
- Both new flooring in kitchen and bathrooms — improves appearance and functionality ↑
- Both new paint throughout — enhances curb appeal and interior aesthetics ↑
- Both new kitchen cabinets — modernizes space and increases functionality ↑
- Both new bathroom fixtures — enhances functionality and aesthetics ↑
ⓘ Cost ranges are severity-bucket heuristics (US national rule-of-thumb). Get contractor quotes + a written scope before underwriting a rehab budget.
Schools (NCES district)
- District
- Mount Vernon School District
- NCES district ID
- 5305400
- Math proficiency
- 41% ▼ -1.00%
- Reading proficiency
- 47% ▲ 1.00%
- Median HH income
- $50,829
- Composite
- 40.14/100
- National rank
- #7848
- State rank
- #189 of 291 in WA
Livability — Mount Vernon
- Score
- 79/100
- State rank
- #106
- US rank
- #2120
Category grades
Schools grade is shown separately in the Schools card above.
Census & demographics
- Census place
- Mount Vernon, WA
- County
- Skagit County · 118,108 people
- City population
- 48,861
- Metro
- Mount Vernon-Anacortes, WA
- Population (ZIP)
- 30,001
- Household income
- $76,717
- Rent vs Own
- Severe rent burden
- 1045.0
Population outlook (Skagit County) Hauer SSP2
- Today (2025)
- 131,498 people
- By 2030
- 135,556 · +3.1%
- By 2040
- 141,717 · +7.8%
- By 2050
- 145,714 · +10.8%
- By 2075
- 152,201 · +15.7%
- By 2100
- 147,980 · +12.5%
Race, ethnicity, and origin ACS 2023
- Neighborhood character
- Majority White (60%)
- Race & ethnicity
- White 60% Hispanic / Latino 32% Two or more races 9% Asian 2% Native American 1%
- Hispanic origin (detail)
- Mexican 30%
- Common ancestry
- Portuguese 6% Slovak 3% Italian 2%
- Foreign-born
- 14% · Canada
- Languages at home
- 71% English-only · Spanish 25% Russian/Polish/Slavic 1% Other Indo-European 1%
Political lean MEDSL · Skagit
- 2024 margin
- Lean D (+8.9) · D 52.9% · R 44.0% · Other 3.0%
- 2008→2024 swing
- -0.7pp no change · 2008: 9.6pp · 2024: 8.9pp
- All cycles
- 2024: D+8.9 2020: D+7.5 2016: D+3.2 2012: D+5.8 2008: D+9.6
Not yet ingested
- Civics
- —
Market trends
- HPI YoY
- ▼ -525.00%
- Current HPI
- 395.3742
- Rent YoY
- ▲ 2.33%
- Metro
- Mount Vernon-Anacortes, WA
- State GDP YoY
- ▲ 4.65%
- F500 in state
- 22
Industry mix (Fortune 500 HQ in WA)
| Industry | F500 HQs | Revenue |
|---|---|---|
| Retail | 2 | $269B |
|
||
| Technology / Retail | 1 | $638B |
|
||
| Technology | 1 | $245B |
|
||
| Telecommunications | 1 | $38B |
|
||
| Food / Beverage | 1 | $36B |
|
||
| Automotive / Trucks | 1 | $34B |
|
||
Price history
-17.5% since first listed7 events — show timeline
- 2026-04-13 Price Changed $65,900 NWMLS as Distributed by MLS Grid
- 2026-03-18 Price Changed $75,900 NWMLS as Distributed by MLS Grid
- 2026-03-03 Price Changed $70,000 NWMLS as Distributed by MLS Grid
- 2026-01-10 Relisted — NWMLS as Distributed by MLS Grid
- 2025-12-30 Pending — NWMLS as Distributed by MLS Grid
- 2025-10-02 Price Changed $74,900 NWMLS as Distributed by MLS Grid
- 2025-08-28 Listed $79,900 NWMLS as Distributed by MLS Grid
Cash-flow waterfall
monthlySold comps — $/sqft
last 12 mo · ≤1 miLoading sold comps…