 🌊 Lakefront
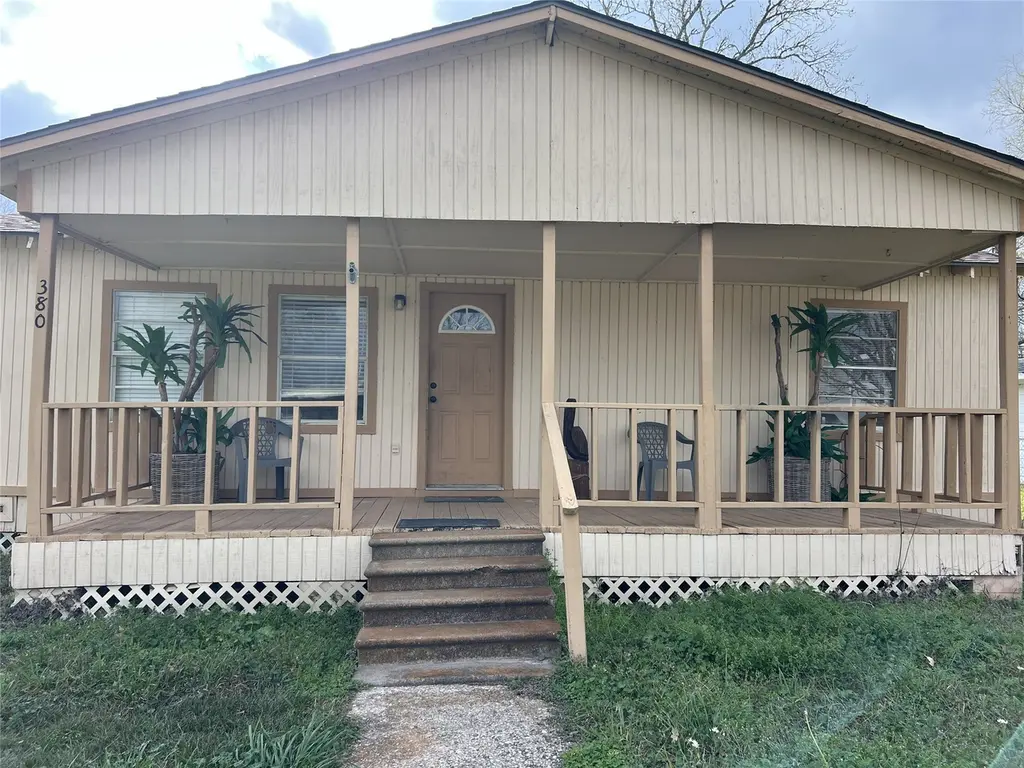
380 Governors Hogg Dr · Point Blank, TX
Flood risk 9/10 · Severe
- FEMA flood zone
- X (unshaded)
- Chance of flooding over 30 yrs
- 0.99%
- Est. flood insurance / yr
- $507 – $1,088
Fire risk 4/10 · Minor
- Est. fire insurance / yr
- $1,222 – $2,270
Heat risk 8/10 · Major
- Hot days now (above 110°F)
- 7 days/yr
- Hot days in 30 yrs
- 25 days/yr
Wind risk 8/10 · Major
- Chance of severe wind over 30 yrs
- 99.0%
Air-quality risk 1/10 · Minimal
- Unhealthy air days now
- 0 days/yr
- Unhealthy air days in 30 yrs
- 0 days/yr
Risk factors via First Street. Map © Google.
Why this score? — see what drove the D+ grade
The composite is a weighted blend of 9 inputs, each scored 0–100. Each bar is that input's sub-score; the figure is the points it added to the 100-point composite (weight × sub-score).
- ARV discount +15.0/15.0
- Cash flow +10.5/30.0
- Appreciation +4.8/10.0
- 1% rule +3.1/10.0
- DSCR +3.0/10.0
- Livability +2.6/5.0
- Rent growth +2.5/5.0
- Condition / age +2.5/5.0
- Schools +2.0/10.0
$120,000
🖨 Deal sheet (PDF) 📄 Offer letter ✓ Due diligence
Listing remarks MLS
Opportunity awaits with this 2-bedroom home situated on 2 lots and located in a charming waterfront community! With a little vision and some TLC, this property could truly shine. Whether you're looking for a primary residence, an investment property, or the perfect weekend getaway, this home offers plenty of potential to make it your own. The community features wonderful amenities including a pool, playground, boat ramp and fishing pier, making it a great place to relax and enjoy the waterfront lifestyle. Bring your ideas and creativity to transform this house into your dream home.
Key facts
- Fishing pier
- Waterfront community
- Pool
Tags
Neighborhood map
What this means for you Summary
Snapshot
- This is a 2-bed/2.0-bath single-family listed at $120k.
Deal economics
- At list price, monthly cash flow is $-129 ($-2k/yr) — negative.
- To cash-flow at today's rent, offer at most $97k (18.9% below list).
- To meet the 1% rule (rent ≥ 1% of price), the offer needs to be $98k (18.7% below list).
- Recommended offer: $97k (18.9% below list) — sets the bar for cash-flow.
- Cap rate 5.7% vs local median 2.4% in Point Blank — top-decile yield for the area; either an underpriced asset or a hidden risk that comps aren't pricing in. Stress-test before assuming the spread holds.
Location & tenants
- Location reads 51/100 on livability (#1,477 in TX) — a working-class tenant base; expect higher turnover. Strengths: cost of living A+, housing A+; Watch: employment D+, crime D, amenities F.
- Coldspring-Oakhurst CISD (rural): math 18% / reading 28% proficiency, ranked #732 of 826 in TX (top 89%) — low school quality limits family demand, transient renter base, plan for 1-2y turnover; 60% free/reduced lunch — lower-income household profile, screen leases tightly.
- Zoned schools: Street El (449 students, 70% FRL); Lincoln J H (math 14% / reading 28%, grade F, #1,387 of 1,662 statewide, top 85%, 347 students, 58% FRL); Coldspring-Oakhurst H S (math 27% / reading 37%, grade F, #1,044 of 1,632 statewide, top 66%, 496 students, 55% FRL) — zoned schools at 61% FRL track the district average.
- Market conditions: 197 active listings in the ZIP; 575 units permitted in San Jacinto County in 2024 (0 in 5+ unit buildings).
Forward outlook
- In year one you build about $463 of equity ($830 loan paydown + $-367 appreciation (-0.3% local appreciation)).
- San Jacinto County population projected at +7% by 2050 — modest demand growth; plan on rents tracking national, not racing it.
Negotiation context
- It's been on market 105 days — a 9% lower offer ($109k) is reasonable based on typical stale-listing flexibility.
- 3 sale attempts since 3y ago; this cycle's ask has dropped $20k (14%) from the opening price — seller is motivated, your offer sets the floor, not the list.
Risks & watch-outs
- Watch-outs: flood insurance adds $66/mo.
- Climate carrying-cost: severe flood risk; severe wind risk, 99% chance of damaging wind over 30y; extreme-heat days projected 7→25/yr by 2055 (HVAC capex compounding) — expect insurance premiums to compound above CPI over the hold.
Questions for the listing agent
- What do current leases actually rent for vs. the listed asking? Can we see a recent rent roll and the last 12 months of T-12 income?
- It's been on market 105 days. Have you received any prior offers? Is the seller open to a 19% concession, seller financing, or rate buy-down credit?
- Built in 1978 — when were the roof, HVAC, electrical panel, plumbing, and water heater last replaced?
- What's the actual annual flood-insurance premium (NFIP or private), and is the property in a SFHA with mandatory coverage?
- What does the HOA fee cover, when was the last increase, and are there any pending special assessments or reserve-fund shortfalls?
- Why hasn't it sold? Are there any deal-killer items the seller is aware of (foundation, flood, title, zoning, code violations)?
- Is there a deadline driving the sale (1031 exchange, divorce, estate, relocation)? That informs how much negotiation room exists.
- Schools are F-rated, which usually means shorter tenancies and higher turnover. Who's the typical renter profile here, and what's been the actual vacancy rate?
- Crime grade is D in this area — have there been break-ins, vandalism, or insurance claims at this property in the last 3 years? What carrier currently insures it and at what premium?
- The area grade is low — what's the realistic commute time and amenity access for the typical tenant pool here? Any planned neighborhood developments (good or bad) we should know about?
- This sits on a lake — are riparian / water-frontage rights deeded with the parcel? Any dock permits, shoreline easements, or HOA water-use restrictions?
- What's the documented flood / surge / shoreline-erosion history here (FEMA AND non-FEMA — e.g., storm surge, creek backup, septic-field saturation)?
- Any water-quality or seasonal algae-bloom issues that affect tenant satisfaction or short-term-rental demand?
- What's the average days-on-market for RENTAL listings here right now (not sales)? A rising rental-DOM trend means longer vacancies and softer asking-rent achievability than the comps imply.
- What's the recent tenant-quality profile in this submarket — average credit score on applications, eviction rate, late-payment / NSF rate, and stable-employment percentage? A property-management company in the area should have these aggregated.
Investment metrics
- 1% rule
- 0.81% ✗
- Cap rate
- 5.67%
- Cash-on-cash
- -2.22%
- DSCR
- 0.90
- GRM
- 10.3
CMA / ARV
- ARV (median comp)
- $239,782
- List price
- $120,000
- Delta
- -49.95%
- Verdict
- UNDERPRICED
- Comps
- 9 within 1.0 mi
Show comp detail 4 sales within ~0.75 mi
| Address | Dist | Beds/Ba | Sqft | Sold | Price | $/sf | Match |
|---|---|---|---|---|---|---|---|
| 277 Edgewater Way | 1.37mi | 3/2.0 (+1) | 978 (-9%) | 8mo | $193,700 | $198 | 38 |
| 240 Boat Launch Rd | 1.08mi | 3/1.5 (+1) | 1,216 (+13%) | 1mo | $85,000 | $70 | 36 |
| 118 High Dr | 1.40mi | 3/2.0 (+1) | 1,136 (+6%) | 24mo | $279,900 | $246 | 31 |
| 100 Oak Tree Dr | 0.87mi | 3/2.0 (+1) | 1,200 (+12%) | 23mo | $139,800 | $117 | 22 |
Match score weights: distance 35% · size 25% · config 20% · recency 20%. Top-matched comps best support the ARV.
Projected returns pro-forma
-0.31% appreciation · 3.0% rent growth · sell at horizon
- IRR
- -8.7%
- Equity multiple
- 0.60×
- Total profit
- $-13,366
- Equity at exit
- $33,019
- IRR
- -2.4%
- Equity multiple
- 0.76×
- Total profit
- $-8,129
- Equity at exit
- $38,261
Cash invested: $33,600 (down + closing). Projections, not guarantees.
Landlord ↔ Tenant lean methodology
- Overall (STATE)
- 87 Strongly Landlord-Friendly
- State Texas
- 87 Strongly Landlord-Friendly · R+5
- County
- — inherits STATE
- City
- — inherits STATE
ZIP-level market 77364
- Home prices YoY
- -0.2%
- Active inventory
- 197
- Price-to-rent
- 10.3×
Monthly cashflow live
- Estimated rent
- $975 medium interval (Pro) →
- Mortgage (P&I)
- −$629
- Tax from tax record
- −$128 /mo · $1,542/yr
- Insurance
- −$50
- Flood insurance flood zone
- −$66 /mo · $798/yr
- HOA
- −$25
- Vacancy / Maint / Mgmt
- −$205
- Net cashflow
- $-129
Break-even live
Sensitivity live
| Price | -10% $-61 | -5% $-95 | +0% $-129 | +5% $-163 | +10% $-197 |
|---|---|---|---|---|---|
| Rent | -10% $-206 | -5% $-167 | +0% $-129 | +5% $-90 | +10% $-52 |
| Rate | -1.0pp $-68 | -0.5pp $-98 | base $-129 | +0.5pp $-160 | +1.0pp $-191 |
UW: 25.0% down · 7.5% · 30yr · 1.5% tax · 5.0% vac · 8.0% maint · 8.0% mgmt
Financing live
Cash to close
- Down payment
- $30,000
- Closing costs
- $3,600
- Reserves months
- —
- Total cash needed
- —
Loan-product check · same deal, 3 products live
Conventional
25% down · 7.5% · 30yr
- Down + closing
- —
- Monthly P&I
- —
- Monthly cashflow
- —
- DSCR
- —
- Eligible?
- —
Personal DTI + credit; lowest rate.
DSCR
20% down · 8.5% · 30yr
- Down + closing
- —
- Monthly P&I
- —
- Monthly cashflow
- —
- DSCR
- —
- Eligible?
- —
No personal income docs; deal must DSCR.
Hard money
10% down · 12.0% · 12mo
- Down + closing
- —
- Monthly P&I
- —
- Monthly cashflow
- —
- DSCR
- —
- Eligible?
- —
Short-term bridge; refi at stabilization.
HOA detail
- Monthly dues
- $25 · $300/yr
- Likely covers
- waterpool
Listing history 26 events
-
2026-06-21days on market $120,000 Active 105 DOM
-
2026-06-19days on market $120,000 Active 103 DOM
-
2026-06-18days on market $120,000 Active 102 DOM
-
2026-06-17days on market $120,000 Active 101 DOM
-
2026-06-16days on market $120,000 Active 100 DOM
-
2026-06-15days on market $120,000 Active 99 DOM
-
2026-06-14days on market $120,000 Active 97 DOM
-
2026-06-13days on market $120,000 Active 96 DOM
-
2026-06-10days on market $120,000 Active 94 DOM
-
2026-06-09days on market $120,000 Active 93 DOM
-
2026-06-08days on market $120,000 Active 92 DOM
-
2026-06-07days on market $120,000 Active 91 DOM
-
2026-06-03days on market $120,000 Active 87 DOM
-
2026-06-02days on market $120,000 Active 86 DOM
-
2026-06-01days on market $120,000 Active 85 DOM
-
2026-05-31days on market $120,000 Active 84 DOM
-
2026-05-30days on market $120,000 Active 83 DOM
-
2026-04-16price $120,000 591-char remark
Show marketing remark (591 chars)
Opportunity awaits with this 2-bedroom home situated on 2 lots and located in a charming waterfront community! With a little vision and some TLC, this property could truly shine. Whether you're looking for a primary residence, an investment property, or the perfect weekend getaway, this home offers plenty of potential to make it your own. The community features wonderful amenities including a pool, playground, boat ramp and fishing pier, making it a great place to relax and enjoy the waterfront lifestyle. Bring your ideas and creativity to transform this house into your dream home.
-
2026-03-08$140,000 Active 591-char remark
Show marketing remark (591 chars)
Opportunity awaits with this 2-bedroom home situated on 2 lots and located in a charming waterfront community! With a little vision and some TLC, this property could truly shine. Whether you're looking for a primary residence, an investment property, or the perfect weekend getaway, this home offers plenty of potential to make it your own. The community features wonderful amenities including a pool, playground, boat ramp and fishing pier, making it a great place to relax and enjoy the waterfront lifestyle. Bring your ideas and creativity to transform this house into your dream home.
-
2024-03-08historical
-
2024-02-12price $160,000
-
2024-02-02$180,000 Active
-
2023-05-12soldstatus Sold
-
2023-04-10status Pending
-
2023-03-30status Option Pending
-
2023-01-08$145,000 Active
ⓘ Source: listings_history table (triggers on properties + properties_extension) + one-shot
backfill from property_details.listing_events for pre-trigger history.
Tax reassessment forecast TX · Resets to sale price
- Current annual tax
- $1,542 · $128/mo
- Projected year-2 tax
- $2,196 · $183/mo
- Expected delta
- +$654/yr (+$55/mo · 42.4%)
ⓘ Screening estimate from a state-policy table — verify with the county assessor before closing.
Climate risk First Street
- Flood 9/10 Extreme FEMA zone X (unshaded) · 99% chance over 30 yrs
- Wildfire 4/10 Moderate
- Heat 8/10 Severe 7 d/yr ≥110°F today · 25 d/yr by 30 yrs out
- Wind 8/10 Severe 99% chance of damaging wind over 30 yrs
- Air quality 1/10 Low 0 unhealthy d/yr today · 0 by 30 yrs out
Nearby sold comps map
Loading sold comps map…
Walkable amenities ~0.75 mi
Loading nearby amenities…
Taxation est. · year 1
- Rental income
- $11,704
- − Mortgage interest
- −$6,722
- − Property taxes
- −$1,542
- − Insurance
- −$1,398
- − Repairs & maintenance
- −$936
- − Management
- −$936
- − HOA
- −$300
- − Depreciation
- −$3,491
- Taxable loss
- −$3,621
- Est. tax savings @ 24.0%
- +$869
- After-tax cash flow
- $-676/yr
For passive investors: Depreciation is non-cash, so a rental often shows a tax loss while cash-flowing — sheltering income. Rental losses are passive: they offset passive income freely, and up to $25,000/yr can offset ordinary (W-2) income if you actively participate and your MAGI is under $100k (phasing out to $0 by $150k); unused losses carry forward. On sale, claimed depreciation is recaptured at up to 25%, and gains may owe capital-gains tax (a 1031 exchange can defer both). Figures are a year-1 estimate at your 24.0% rate — not tax advice; consult a CPA.
Schools (NCES district)
- District
- Coldspring-Oakhurst CISD
- NCES district ID
- 4814520
- Math proficiency
- 18% ▼ -9.00%
- Reading proficiency
- 28% ▼ -2.00%
- Median HH income
- $46,916
- Composite
- 20.07/100
- National rank
- #8653
- State rank
- #732 of 826 in TX
Livability — Point Blank
- Score
- 51/100
- State rank
- #1477
- US rank
- #25299
Category grades
Schools grade is shown separately in the Schools card above.
Census & demographics
- Population (ZIP)
- 1,835
Population outlook (San Jacinto County) Hauer SSP2
- Today (2025)
- 29,069 people
- By 2030
- 29,750 · +2.3%
- By 2040
- 30,714 · +5.7%
- By 2050
- 31,010 · +6.7%
- By 2075
- 31,616 · +8.8%
- By 2100
- 29,874 · +2.8%
Race, ethnicity, and origin ACS 2023
- Neighborhood character
- Predominantly White (75%)
- Race & ethnicity
- White 75% Black 13% Two or more races 8% Hispanic / Latino 3% Asian 3%
- Common ancestry
- Lithuanian 5% Italian 4% Serbian 3%
- Foreign-born
- 5% · South Korea, Canada
- Languages at home
- 93% English-only · Spanish 6% Other Asian/Pacific 1%
Political lean MEDSL · San Jacinto
- 2024 margin
- Solid R (+65.3) · D 17.0% · R 82.3%
- 2008→2024 swing
- -27.0pp toward R · 2008: -38.3pp · 2024: -65.3pp
- All cycles
- 2024: R+65.3 2020: R+61.9 2016: R+58.4 2012: R+48.9 2008: R+38.3
Not yet ingested
- Civics
- —
Market trends
- HPI YoY
- ▼ -0.31%
- Current HPI
- 193.4748
- Rent YoY
- —
- Metro
- —
- State GDP YoY
- ▲ 3.95%
- F500 in state
- 110
Industry mix (Fortune 500 HQ in TX)
| Industry | F500 HQs | Revenue |
|---|---|---|
| Energy | 16 | $1,198B |
|
||
| Technology | 5 | $198B |
|
||
| Engineering / Construction | 4 | $72B |
|
||
| Energy Services | 3 | $60B |
|
||
| Utilities | 3 | $41B |
|
||
| Healthcare | 2 | $330B |
|
||
Price history
-17.2% since first listed9 events — show timeline
- 2026-04-16 Price Changed $120,000 HARMLS
- 2026-03-08 Listed $140,000 HARMLS
- 2024-03-08 Listing Removed — HARMLS
- 2024-02-12 Price Changed $160,000 HARMLS
- 2024-02-02 Listed $180,000 HARMLS
- 2023-05-12 Sold (MLS) — HARMLS
- 2023-04-10 Pending — HARMLS
- 2023-03-30 Pending — HARMLS
- 2023-01-08 Listed $145,000 HARMLS
Property tax history
+4.0%/yrLatest (2025): $1,542 · +8.0% YoY. Source: county tax records.
Cash-flow waterfall
monthlySold comps — $/sqft
last 12 mo · ≤1 miLoading sold comps…