 🏷️ Likely Rental
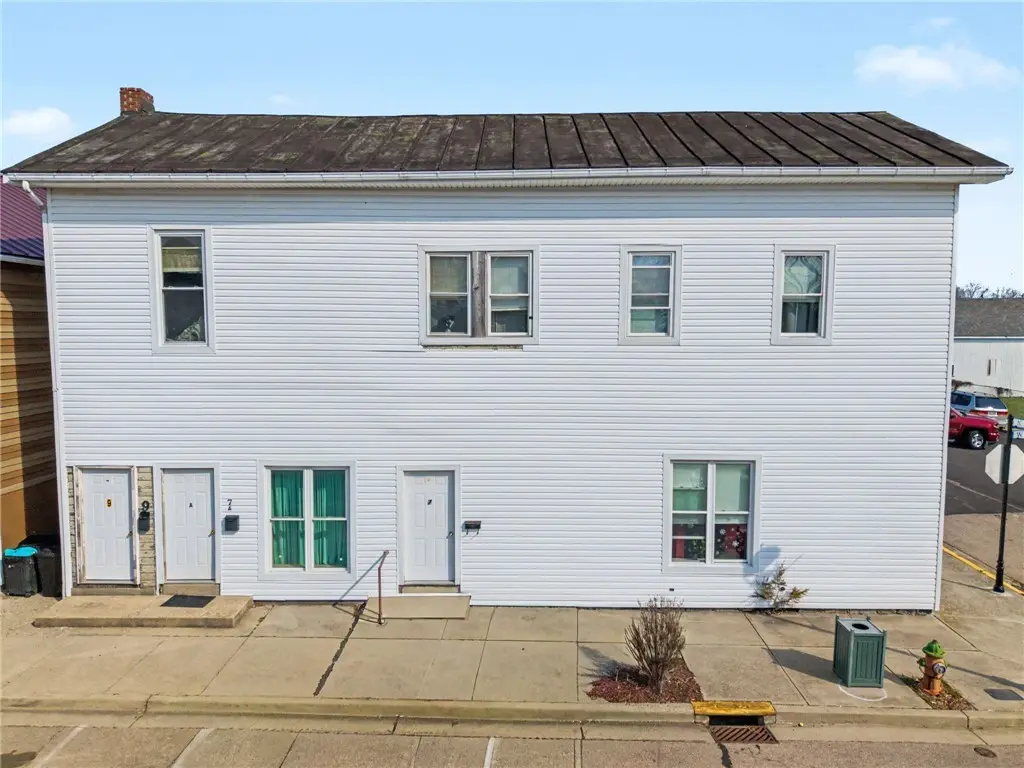
7 NW Cor Center St Main St · Farmersville, OH
Flood risk No data
- FEMA flood zone
- —
- Chance of flooding over 30 yrs
- —
- Est. flood insurance / yr
- —
Fire risk No data
- Est. fire insurance / yr
- —
Heat risk No data
- Hot days now (above threshold)
- —
- Hot days in 30 yrs
- —
Wind risk No data
- Chance of severe wind over 30 yrs
- —
Air-quality risk No data
- Unhealthy air days now
- —
- Unhealthy air days in 30 yrs
- —
Risk factors via First Street. Map © Google.
Why this score? — see what drove the B grade
The composite is a weighted blend of 9 inputs, each scored 0–100. Each bar is that input's sub-score; the figure is the points it added to the 100-point composite (weight × sub-score).
- Cash flow +30.0/30.0
- 1% rule +10.0/10.0
- DSCR +10.0/10.0
- ARV discount +7.5/15.0
- Schools +5.3/10.0
- Livability +3.7/5.0
- Rent growth +2.5/5.0
- Condition / age +2.2/5.0
- Appreciation +0.0/10.0
$124,900
🖨 Deal sheet 📄 Offer letter ✓ Due diligence
Multi-family units
County records classify this as Multi-Family (2-4 Unit). Listing-text estimate: 1 unit. estimate disagrees with records
Listing remarks MLS
Investment opportunity with three rental units currently occupied. The upper unit offers 2 bedrooms and 1 full bath. The two lower units each offer 1 bedroom and 1 full bath. Showings will be scheduled only after accepted contract. Tenants are month to month.
Key facts
- 1,263 sq ft lot
- Built 1900
- Listed 53 days
Neighborhood map
What this means for you Summary
Snapshot
- This is a 4-bed/3.0-bath multifamily listed at $125k. Condition is rated fair.
Deal economics
- At list price, monthly cash flow is $2k ($19k/yr) — positive.
- The deal already cash-flows at list — no discount required.
- Meets the 1% rule at list price ($3k rent vs $125k).
- Recommended offer: $121k (3.0% below list) — sets the bar for market timing.
Location & tenants
- Location reads 74/100 on livability (#275 in OH, #4,528 nationally) — a middle-class / working-renter tenant base. Strengths: crime A+, cost of living A+, housing A+; Watch: amenities F, commute F, health & safety F.
- Valley View Local (suburban): math 54% / reading 69% proficiency, ranked #250 of 656 in OH (top 38%) — acceptable for families but not a draw, mixed tenant base, ~2y average lease.
- Market conditions: 15 active listings in the ZIP; solid renter incomes; 907 units permitted in Montgomery County in 2024 (416 in 5+ unit buildings).
- At $3,061/mo this rent would consume 46% of the median local household income ($80k/yr) — very limited rent-growth headroom before tenants either downsize or default.
Forward outlook
- Local home prices are declining (-3.0%/yr); year-one equity from $864 of loan paydown is wiped out by about $4k of value loss. Plan a longer hold.
- Montgomery County population projected at -10% by 2050 — secular population decline; favor cash flow + early exit over multi-decade hold.
- At projected returns (-3.0% appreciation + 3.0% rent growth), your $35k cash investment doubles in ~3 years — after that, you're playing with house money.
Negotiation context
- It's been on market 53 days — a 3% lower offer ($121k) is reasonable based on typical stale-listing flexibility.
Risks & watch-outs
- Watch-outs: built in 1900 — expect roof / HVAC / electrical / plumbing capex.
Questions for the listing agent
- It's been on market 53 days. Have you received any prior offers? Is the seller open to a 3% concession, seller financing, or rate buy-down credit?
- Have any recent inspections been done? Can we get a copy of the seller's disclosures and any deferred-maintenance estimates?
- Built in 1900 — when were the roof, HVAC, electrical panel, plumbing, and water heater last replaced?
- Is there a deadline driving the sale (1031 exchange, divorce, estate, relocation)? That informs how much negotiation room exists.
- Schools are A-rated — typically a magnet for longer-tenancy family renters. What's the average tenant stay here, and is there a school-zone premium baked into asking?
- What's the average days-on-market for RENTAL listings here right now (not sales)? A rising rental-DOM trend means longer vacancies and softer asking-rent achievability than the comps imply.
- What's the recent tenant-quality profile in this submarket — average credit score on applications, eviction rate, late-payment / NSF rate, and stable-employment percentage? A property-management company in the area should have these aggregated.
- How much new apartment / multifamily construction is in the pipeline within 1–3 miles? Heavy new supply (>2% of stock underway) typically softens rents 12–24 months out; light construction supports rent growth.
Investment metrics
- 1% rule
- 2.45% ✓
- Cap rate
- 21.23%
- Cash-on-cash
- 53.36%
- DSCR
- 3.37
- GRM
- 3.4
CMA / ARV
- ARV (median comp)
- $450,000
- List price
- $124,900
- Delta
- -72.24%
- Verdict
- UNDERPRICED
- Comps
- 1 within 2.0 mi
Projected returns pro-forma
-3.0% appreciation · 3.0% rent growth · sell at horizon
- IRR
- 51.4%
- Equity multiple
- 3.25×
- Total profit
- $78,848
- Equity at exit
- $18,623
- IRR
- 56.8%
- Equity multiple
- 6.62×
- Total profit
- $196,378
- Equity at exit
- $10,799
Cash invested: $34,972 (down + closing). Projections, not guarantees.
Landlord ↔ Tenant lean methodology
- Overall (STATE)
- 73 Landlord-Friendly
- State Ohio
- 73 Landlord-Friendly · R+6
- County
- — inherits STATE
- City
- — inherits STATE
ZIP-level market 45325
- Home prices YoY
- -29.0%
- Active inventory
- 15
- Price-to-rent
- 9.5×
Monthly cashflow live
- Estimated rent
- $3,061 medium interval (Pro) →
- Mortgage (P&I)
- −$655
- Tax est. 1.5%
- −$156 /mo · $1,874/yr
- Insurance
- −$52
- HOA
- −$0
- Vacancy / Maint / Mgmt
- −$643
- Net cashflow
- $1,555
Break-even live
3-unit breakdown (identical units grouped — click to expand)
| Units | Beds | Baths | Est. rent |
|---|---|---|---|
| 1× unit | 2 | 1 | $1,099 |
| 2× units | 1 | 1 | $1,962 |
| #2 | 1 | 1 | $981 |
| #3 | 1 | 1 | $981 |
| Total (3 units) | $3,061 | ||
UW: 25.0% down · 7.5% · 30yr · 1.5% tax · 5.0% vac · 8.0% maint · 8.0% mgmt
Financing live
Cash to close
- Down payment
- $31,225
- Closing costs
- $3,747
- Reserves months
- —
- Total cash needed
- —
Loan-product check · same deal, 3 products live
Conventional
25% down · 7.5% · 30yr
- Down + closing
- —
- Monthly P&I
- —
- Monthly cashflow
- —
- DSCR
- —
- Eligible?
- —
Personal DTI + credit; lowest rate.
DSCR
20% down · 8.5% · 30yr
- Down + closing
- —
- Monthly P&I
- —
- Monthly cashflow
- —
- DSCR
- —
- Eligible?
- —
No personal income docs; deal must DSCR.
Hard money
10% down · 12.0% · 12mo
- Down + closing
- —
- Monthly P&I
- —
- Monthly cashflow
- —
- DSCR
- —
- Eligible?
- —
Short-term bridge; refi at stabilization.
Listing history 2 events
-
2026-04-15price $124,900 259-char remark
Show marketing remark (259 chars)
Investment opportunity with three rental units currently occupied. The upper unit offers 2 bedrooms and 1 full bath. The two lower units each offer 1 bedroom and 1 full bath. Showings will be scheduled only after accepted contract. Tenants are month to month.
-
2026-03-27$149,900 Active 259-char remark
Show marketing remark (259 chars)
Investment opportunity with three rental units currently occupied. The upper unit offers 2 bedrooms and 1 full bath. The two lower units each offer 1 bedroom and 1 full bath. Showings will be scheduled only after accepted contract. Tenants are month to month.
ⓘ Source: listings_history table (triggers on properties + properties_extension) + one-shot
backfill from property_details.listing_events for pre-trigger history.
Nearby sold comps map
Loading sold comps map…
Walkable amenities ~0.75 mi
Loading nearby amenities…
Taxation est. · year 1
- Rental income
- $36,732
- − Mortgage interest
- −$6,996
- − Property taxes
- −$1,874
- − Insurance
- −$624
- − Repairs & maintenance
- −$2,939
- − Management
- −$2,939
- − Depreciation
- −$3,633
- Taxable income
- $17,727
- Est. tax owed @ 24.0%
- −$4,255
- After-tax cash flow
- $14,406/yr
For passive investors: Depreciation is non-cash, so a rental often shows a tax loss while cash-flowing — sheltering income. Rental losses are passive: they offset passive income freely, and up to $25,000/yr can offset ordinary (W-2) income if you actively participate and your MAGI is under $100k (phasing out to $0 by $150k); unused losses carry forward. On sale, claimed depreciation is recaptured at up to 25%, and gains may owe capital-gains tax (a 1031 exchange can defer both). Figures are a year-1 estimate at your 24.0% rate — not tax advice; consult a CPA.
Condition & rehab AI · 2 photos
This multi-family property requires significant repairs, particularly to the roof and exterior siding, to improve its condition and value. Landscaping improvements would also enhance its curb appeal.
Repairs flagged
- Major roof — Signs of moss and discoloration suggest significant water damage and potential structural issues.
- Moderate exterior siding — The siding shows visible signs of wear and tear, indicating the need for repainting or replacement.
- Minor landscaping — Overgrown areas and lack of visible curb appeal features suggest a need for some landscaping improvements.
Value-add opportunities
- Both repair and replace the roof — A new roof would significantly improve the home's appearance and functionality, attracting more tenants and buyers.
- Both paint the exterior siding — Fresh paint would enhance the home's curb appeal and make it more attractive to potential renters and buyers.
- Both landscaping improvements — Well-maintained landscaping would improve the home's curb appeal and make it more attractive to potential renters and buyers.
Renovation cost estimate screening
| Repair item | Severity | Est. cost |
|---|---|---|
| roof · Signs of moss and discoloration suggest significant water damage and potential structural issues. | Major | $15,000–50,000 |
| exterior siding · The siding shows visible signs of wear and tear, indicating the need for repainting or replacement. | Moderate | $3,000–15,000 |
| landscaping · Overgrown areas and lack of visible curb appeal features suggest a need for some landscaping improvements. | Minor | $500–3,000 |
| Total estimated repair cost · 3 items | $18,500–68,000 |
Value-add ROI direction
- Both repair and replace the roof — A new roof would significantly improve the home's appearance and functionality, attracting more tenants and buyers. ↑
- Both paint the exterior siding — Fresh paint would enhance the home's curb appeal and make it more attractive to potential renters and buyers. ↑
- Both landscaping improvements — Well-maintained landscaping would improve the home's curb appeal and make it more attractive to potential renters and buyers. ↑
ⓘ Cost ranges are severity-bucket heuristics (US national rule-of-thumb). Get contractor quotes + a written scope before underwriting a rehab budget.
Schools (NCES district)
- District
- Valley View Local
- NCES district ID
- 3904874
- Math proficiency
- 54% ▼ -17.00%
- Reading proficiency
- 69% ▼ -7.00%
- Median HH income
- $60,457
- Composite
- 53.26/100
- National rank
- #1495
- State rank
- #250 of 656 in OH
Livability — Farmersville
- Score
- 74/100
- State rank
- #275
- US rank
- #4528
Category grades
Schools grade is shown separately in the Schools card above.
Census & demographics
- Census place
- Farmersville, OH
- County
- Montgomery · 506,435 people
- Metro
- Dayton-Kettering-Beavercreek, OH
- Population (ZIP)
- 2,746
- Household income
- $79,688
- Rent vs Own
- Severe rent burden
- 3.3
Population outlook (Montgomery County) Hauer SSP2
- Today (2025)
- 523,241 people
- By 2030
- 514,948 · -1.6%
- By 2040
- 493,378 · -5.7%
- By 2050
- 469,639 · -10.2%
- By 2075
- 418,360 · -20.0%
- By 2100
- 353,315 · -32.5%
Race, ethnicity, and origin ACS 2023
- Neighborhood character
- Predominantly White (97%)
- Race & ethnicity
- White 97% Two or more races 3%
- Common ancestry
- Slovak 4% Italian 3% Lithuanian 2%
- Foreign-born
- 0%
Political lean MEDSL · Montgomery
- 2024 margin
- Toss-up / Even · D 49.8% · R 49.3%
- 2008→2024 swing
- -5.8pp toward R · 2008: 6.2pp · 2024: 0.5pp
- All cycles
- 2024: D+0.5 2020: D+2.2 2016: R+1.2 2012: D+3.1 2008: D+6.2
Not yet ingested
- Civics
- —
Market trends
- HPI YoY
- ▼ -93.25%
- Current HPI
- 228.4052
- Rent YoY
- —
- Metro
- —
- State GDP YoY
- ▲ 1.98%
- F500 in state
- 48
Industry mix (Fortune 500 HQ in OH)
| Industry | F500 HQs | Revenue |
|---|---|---|
| Insurance | 3 | $145B |
|
||
| Industrial Machinery | 3 | $49B |
|
||
| Financial Services | 3 | $24B |
|
||
| Consumer Goods | 2 | $93B |
|
||
| Aerospace / Defense | 2 | $47B |
|
||
| Utilities | 2 | $33B |
|
||
Price history
-16.7% since first listed2 events — show timeline
- 2026-04-15 Price Changed $124,900 Dayton MLS
- 2026-03-27 Listed $149,900 Dayton MLS
Cash-flow waterfall
monthlySold comps — $/sqft
last 12 mo · ≤1 miLoading sold comps…