 Multi-family
1424 Orange Ave NW Unit & 1422 · Roanoke, VA
Flood risk 7/10 · Major
- FEMA flood zone
- X (unshaded)
- Chance of flooding over 30 yrs
- 0.99%
- Est. flood insurance / yr
- $473 – $860
Fire risk 1/10 · Minimal
- Est. fire insurance / yr
- $666 – $1,236
Heat risk 5/10 · Moderate
- Hot days now (above 101°F)
- 7 days/yr
- Hot days in 30 yrs
- 18 days/yr
Wind risk 2/10 · Minimal
- Chance of severe wind over 30 yrs
- 1.0%
Air-quality risk 1/10 · Minimal
- Unhealthy air days now
- 0 days/yr
- Unhealthy air days in 30 yrs
- 0 days/yr
Risk factors via First Street. Map © Google.
Why this score? — see what drove the B+ grade
The composite is a weighted blend of 9 inputs, each scored 0–100. Each bar is that input's sub-score; the figure is the points it added to the 100-point composite (weight × sub-score).
- Cash flow +30.0/30.0
- ARV discount +15.0/15.0
- 1% rule +10.0/10.0
- DSCR +10.0/10.0
- Schools +4.1/10.0
- Rent growth +3.9/5.0
- Livability +3.7/5.0
- Condition / age +2.2/5.0
- Appreciation +0.0/10.0
$133,149
🖨 Deal sheet 📄 Offer letter ✓ Due diligence
Multi-family units
County records classify this as Multi-Family (2-4 Unit). Listing-text estimate: 1 unit. estimate disagrees with records
Listing remarks MLS
One vacant, one occupied (Lease ends 5/31/26), must give 48 hr notice.
Key facts
- 6,534 sq ft lot
- Built 1900
- Listed 308 days
Neighborhood map
What this means for you Summary
Snapshot
- This is a multifamily listed at $133k. Condition is rated fair.
Deal economics
- At list price, monthly cash flow is $859 ($10k/yr) — positive.
- The deal already cash-flows at list — no discount required.
- Meets the 1% rule at list price ($2k rent vs $133k).
- Recommended offer: $117k (12.0% below list) — sets the bar for market timing.
- Cap rate 14.5% vs local median 4.2% in Roanoke — top-decile yield for the area; either an underpriced asset or a hidden risk that comps aren't pricing in. Stress-test before assuming the spread holds.
Location & tenants
- Location reads 73/100 on livability (#163 in VA) — a middle-class / working-renter tenant base. Strengths: cost of living A+, health & safety A+, housing A; Watch: amenities C-, employment D, crime F.
- Roanoke City Public School District (urban): math 40% / reading 58% proficiency, ranked #102 of 131 in VA (top 78%) — families likely to look elsewhere, expect single-tenant / working-renter base with shorter leases; 67% free/reduced lunch — lower-income household profile, screen leases tightly.
- Market conditions: Rents rising fast (+5.7%/yr); 151 active listings in the ZIP; 40 comparable units currently listed for rent nearby; rentals at typical pace (median 21d on market — plan ~3-4 weeks tenant-placement turnaround); 40% of comp listings sitting > 30 days — soft ceiling on asking rent; 113 units permitted in Roanoke city in 2024 (0 in 5+ unit buildings).
- At $2,322/mo this rent would consume 59% of the median local household income ($47k/yr) (locally 913% of renters already pay >50% of income on rent) — very limited rent-growth headroom before tenants either downsize or default.
Forward outlook
- Local home prices are declining (-3.0%/yr); year-one equity from $921 of loan paydown is wiped out by about $4k of value loss. Plan a longer hold.
- Roanoke County population projected at +11% by 2050 — modest demand growth; plan on rents tracking national, not racing it.
- At projected returns (-3.0% appreciation + 5.7% rent growth), your $37k cash investment doubles in ~4 years — after that, you're playing with house money.
Negotiation context
- It's been on market 308 days — a 12% lower offer ($117k) is reasonable based on typical stale-listing flexibility.
- 2 sale attempts since 8y ago; this cycle's ask has dropped $27k (17%) from the opening price — seller is motivated, your offer sets the floor, not the list.
Risks & watch-outs
- Watch-outs: flood insurance adds $56/mo; built in 1900 — expect roof / HVAC / electrical / plumbing capex.
- Climate carrying-cost: major flood risk; extreme-heat days projected 7→18/yr by 2055 (HVAC capex compounding) — expect insurance premiums to compound above CPI over the hold.
Questions for the listing agent
- It's been on market 308 days. Have you received any prior offers? Is the seller open to a 12% concession, seller financing, or rate buy-down credit?
- Have any recent inspections been done? Can we get a copy of the seller's disclosures and any deferred-maintenance estimates?
- Built in 1900 — when were the roof, HVAC, electrical panel, plumbing, and water heater last replaced?
- What's the actual annual flood-insurance premium (NFIP or private), and is the property in a SFHA with mandatory coverage?
- Why hasn't it sold? Are there any deal-killer items the seller is aware of (foundation, flood, title, zoning, code violations)?
- Is there a deadline driving the sale (1031 exchange, divorce, estate, relocation)? That informs how much negotiation room exists.
- Schools are A-rated — typically a magnet for longer-tenancy family renters. What's the average tenant stay here, and is there a school-zone premium baked into asking?
- Crime grade is F in this area — have there been break-ins, vandalism, or insurance claims at this property in the last 3 years? What carrier currently insures it and at what premium?
- What's the average days-on-market for RENTAL listings here right now (not sales)? A rising rental-DOM trend means longer vacancies and softer asking-rent achievability than the comps imply.
- What's the recent tenant-quality profile in this submarket — average credit score on applications, eviction rate, late-payment / NSF rate, and stable-employment percentage? A property-management company in the area should have these aggregated.
- How much new apartment / multifamily construction is in the pipeline within 1–3 miles? Heavy new supply (>2% of stock underway) typically softens rents 12–24 months out; light construction supports rent growth.
Investment metrics
- 1% rule
- 1.74% ✓
- Cap rate
- 14.53%
- Cash-on-cash
- 29.43%
- DSCR
- 2.31
- GRM
- 4.8
CMA / ARV
- ARV (median comp)
- $215,130
- List price
- $133,149
- Delta
- -38.11%
- Verdict
- UNDERPRICED
- Comps
- 2 within 1.0 mi
Show comp detail 11 sales within ~0.75 mi
| Address | Dist | Beds/Ba | Sqft | Sold | Price | $/sf | Match |
|---|---|---|---|---|---|---|---|
| 1406 Melrose Ave NW | 0.08mi | —/— | — | 10mo | $235,000 | — | 76 |
| 1710 Mercer Ave NW | 0.30mi | —/— | 1,188 | 6mo | $80,000 | $67 | 69 |
| 1704 Hanover Ave NW | 0.22mi | —/— | — | 12mo | $240,000 | — | 67 |
| 1821 Moorman Ave NW | 0.37mi | —/— | — | 7mo | $143,500 | — | 64 |
| 1213 Hanover Ave NW Unit & 1215 | 0.21mi | —/— | — | 19mo | $55,000 | — | 62 |
| 609 12th St NW | 0.28mi | —/— | — | 18mo | $175,000 | — | 60 |
| 2105 Staunton Ave NW Unit & 2107 | 0.58mi | —/— | — | 7mo | $180,000 | — | 55 |
| 911 Madison Ave NW | 0.43mi | —/— | — | 18mo | $100,000 | — | 52 |
| 2119 Staunton Ave NW | 0.61mi | —/— | — | 9mo | $156,800 | — | 52 |
| 919 Gilmer Ave NW | 0.51mi | —/— | — | 19mo | $165,000 | — | 48 |
| 605 8th St NW | 0.61mi | —/— | — | 21mo | $122,500 | — | 42 |
Match score weights: distance 35% · size 25% · config 20% · recency 20%. Top-matched comps best support the ARV.
Projected returns pro-forma
-3.0% appreciation · 5.71% rent growth · sell at horizon
- IRR
- 24.9%
- Equity multiple
- 2.06×
- Total profit
- $39,686
- Equity at exit
- $19,853
- IRR
- 34.4%
- Equity multiple
- 4.58×
- Total profit
- $133,470
- Equity at exit
- $11,512
Cash invested: $37,282 (down + closing). Projections, not guarantees.
Landlord ↔ Tenant lean methodology
- Overall (STATE)
- 55 Moderately Landlord-Leaning
- State Virginia
- 55 Moderately Landlord-Leaning · D+2
- County
- — inherits STATE
- City
- — inherits STATE
ZIP-level market 24017
- Home prices YoY
- -28.3%
- Rents YoY
- 5.7%
- Active inventory
- 151
- Price-to-rent
- 9.6×
Monthly cashflow live
- Estimated rent
- $2,322 high interval (Pro) →
- Mortgage (P&I)
- −$698
- Tax est. 1.5%
- −$166 /mo · $1,997/yr
- Insurance
- −$55
- Flood insurance flood zone
- −$56 /mo · $666/yr
- HOA
- −$0
- Vacancy / Maint / Mgmt
- −$488
- Net cashflow
- $859
Break-even live
2-unit breakdown (identical units grouped — click to expand)
| Units | Beds | Baths | Est. rent |
|---|---|---|---|
| 2× units | 1 | 1 | $2,322 |
| #1 | 1 | 1 | $1,161 |
| #2 | 1 | 1 | $1,161 |
| Total (2 units) | $2,322 | ||
UW: 25.0% down · 7.5% · 30yr · 1.5% tax · 5.0% vac · 8.0% maint · 8.0% mgmt
Financing live
Cash to close
- Down payment
- $33,287
- Closing costs
- $3,994
- Reserves months
- —
- Total cash needed
- —
Loan-product check · same deal, 3 products live
Conventional
25% down · 7.5% · 30yr
- Down + closing
- —
- Monthly P&I
- —
- Monthly cashflow
- —
- DSCR
- —
- Eligible?
- —
Personal DTI + credit; lowest rate.
DSCR
20% down · 8.5% · 30yr
- Down + closing
- —
- Monthly P&I
- —
- Monthly cashflow
- —
- DSCR
- —
- Eligible?
- —
No personal income docs; deal must DSCR.
Hard money
10% down · 12.0% · 12mo
- Down + closing
- —
- Monthly P&I
- —
- Monthly cashflow
- —
- DSCR
- —
- Eligible?
- —
Short-term bridge; refi at stabilization.
Rent comps 40 comps
| Address | Beds | Baths | Sqft | Rent | $/sqft | DOM | Units | Dist |
|---|---|---|---|---|---|---|---|---|
| 1314 Moorman Ave NW Apt E Roanoke, VA | 1.0 | 1.0 | 500 | $750 | $1.50 | 13d | 1 | 0.18mi |
| 1502 Gilmer Ave NW Apt B Roanoke, VA | 2.0 | 1.0 | — | $995 | — | 13d | 1 | 0.21mi |
| 821 12th St NW Roanoke, VA | 3.0 | 2.0 | 1508 | $1,625 | $1.08 | 43d | 1 | 0.25mi |
| 1116 Fairfax Ave NW Roanoke, VA | 2.0 | 1.0 | 800 | $1,400 | $1.75 | 21d | 1 | 0.32mi |
| 1117 Rugby Blvd NW Unit B Roanoke, VA | 2.0 | 1.0 | 1048 | $778 | $0.74 | 21d | 1 | 0.40mi |
| 1007 Gilmer Ave NW Roanoke, VA | 2.0 | 2.0 | 1187 | $1,175 | $0.99 | 21d | 1 | 0.42mi |
| 1920 Melrose Ave NW Roanoke, VA | 2.0 | 1.0 | 768 | $950 | $1.24 | 43d | 1 | 0.43mi |
| 1533 Rugby Blvd NW Roanoke, VA | 3.0 | 1.0 | 1500 | $1,475 | $0.98 | 43d | 1 | 0.46mi |
| 1531 Syracuse Ave NW Roanoke, VA | 3.0 | 1.0 | 1488 | $1,675 | $1.13 | 43d | 1 | 0.53mi |
| 10 12 1/2 St SW Roanoke, VA | 3.0 | 1.5 | 999 | $1,023 | $1.02 | 43d | 1 | 0.57mi |
| 813 Gilmer Ave NW Roanoke, VA | 2.0 | 1.0 | 1050 | $1,322 | $1.26 | 21d | 1 | 0.57mi |
| 717 Orange Ave NW Roanoke, VA | 2.0 | 1.0 | 738 | $900 | $1.22 | 43d | 1 | 0.62mi |
| 2125 Orange Ave NW Roanoke, VA | 3.0 | 1.0 | — | $1,095 | — | 13d | 1 | 0.62mi |
| 2125 Orange Ave NW Apt B Roanoke, VA | 3.0 | 1.0 | — | $1,195 | — | 21d | 1 | 0.62mi |
| 829 Salem Ave SW Unit 3 Roanoke, VA | 1.0 | 1.0 | 443 | $1,900 | $4.29 | 13d | 1 | 0.76mi |
| 2324 Orange Ave NW Unit Up Roanoke, VA | 2.0 | 1.0 | — | $999 | — | 21d | 1 | 0.78mi |
| 2324 Staunton Ave NW Roanoke, VA | 3.0 | 1.0 | — | $1,395 | — | 43d | 1 | 0.79mi |
| 416 Hanover Ave NW Roanoke, VA | 2.0 | 1.0 | 682 | $1,195 | $1.75 | 13d | 1 | 0.81mi |
| 1422 Patterson Ave SW Unit 1 Roanoke, VA | 2.0 | 1.0 | — | $1,125 | — | 13d | 1 | 0.83mi |
| 701 Salem Ave SW Roanoke, VA | 2.0 | 1.0 | 1250 | $1,950 | $1.56 | 43d | 1 | 0.85mi |
| 802 Rorer Ave SW Apt A Roanoke, VA | 2.0 | 1.0 | 820 | $895 | $1.09 | 43d | 1 | 0.86mi |
| 1405 Chapman Ave SW Roanoke, VA | 1.0 | 1.0 | — | $815 | — | 43d | 1 | 0.86mi |
| 1630 Patterson Ave SW Unit B Roanoke, VA | 3.0 | 1.0 | 1200 | $1,395 | $1.16 | 43d | 1 | 0.87mi |
| 401 Rutherford Ave NW Roanoke, VA | 3.0 | 1.0 | 1064 | $1,450 | $1.36 | 43d | 1 | 0.89mi |
| 1334 Chapman Ave SW Apt 4 Roanoke, VA | 2.0 | 1.0 | — | $1,075 | — | 43d | 1 | 0.89mi |
| 1825 Patterson Ave SW Unit B Roanoke, VA | 2.0 | 1.0 | 1000 | $850 | $0.85 | 43d | 1 | 0.89mi |
| 1430 Chapman Ave SW Unit 2 Roanoke, VA | 2.0 | 1.0 | — | $1,150 | — | 13d | 1 | 0.89mi |
| 333 Harrison Ave NW Roanoke, VA | 3.0 | 2.0 | 1186 | $1,123 | $0.95 | 21d | 1 | 0.90mi |
| 1901 Patterson Ave SW Apt A Roanoke, VA | 3.0 | 1.0 | — | $1,200 | — | 43d | 1 | 0.90mi |
| 2445 Maryland Ave NW #1 Roanoke, VA | 3.0 | 1.0 | — | $923 | — | 43d | 1 | 0.91mi |
| 1717 Chapman Ave SW Roanoke, VA | 2.0 | 1.0 | — | $1,195 | — | 13d | 1 | 0.92mi |
| 1106 Campbell Ave SW Roanoke, VA | 2.0 | 1.0 | 850 | $950 | $1.12 | 13d | 1 | 0.93mi |
| 1624 Chapman Ave SW Unit A6 Roanoke, VA | 1.0 | 1.0 | 650 | $799 | $1.23 | 21d | 1 | 0.93mi |
| 631 Campbell Ave SW Unit 111 Roanoke, VA | 1.0 | 1.0 | 575 | $1,035 | $1.80 | 21d | 1 | 0.96mi |
| 1114 Lafayette Blvd NW Unit 1 Roanoke, VA | 2.0 | 1.0 | — | $1,095 | — | 21d | 1 | 0.97mi |
| 605 Calvary St SW Apt A Roanoke, VA | 1.0 | 1.0 | 838 | $2,100 | $2.51 | 21d | 1 | 1.02mi |
| 605 Calvary St SW Apt A Roanoke, VA | 1.0 | 1.0 | 838 | $2,100 | $2.51 | 13d | 1 | 1.02mi |
| 216 Patton Ave NW Unit 2 Roanoke, VA | 2.0 | 1.0 | 1240 | $1,025 | $0.83 | 21d | 1 | 1.05mi |
| 357 Salem Ave SW Apt 405 Roanoke, VA | 1.0 | 1.0 | 544 | $955 | $1.76 | 21d | 1 | 1.06mi |
| 2608 Florida Ave NW Roanoke, VA | 3.0 | 1.0 | 1394 | $1,600 | $1.15 | 21d | 1 | 1.06mi |
Listing history 23 events
-
2026-06-18days on market $133,149 Active 308 DOM
-
2026-06-17days on market $133,149 Active 307 DOM
-
2026-06-16days on market $133,149 Active 306 DOM
-
2026-06-15days on market $133,149 Active 305 DOM
-
2026-06-14days on market $133,149 Active 303 DOM
-
2026-06-13days on market $133,149 Active 302 DOM
-
2026-06-10days on market $133,149 Active 300 DOM
-
2026-06-09days on market $133,149 Active 299 DOM
-
2026-06-08days on market $133,149 Active 298 DOM
-
2026-06-05days on market $133,149 Active 294 DOM
-
2026-06-03pricedays on market $133,149 Active 293 DOM
-
2026-06-02days on market $140,157 Active 292 DOM
-
2026-06-01days on market $140,157 Active 291 DOM
-
2026-05-31days on market $140,157 Active 290 DOM
-
2026-05-30days on market $140,157 Active 289 DOM
-
2026-05-05price $140,157 70-char remark
Show marketing remark (70 chars)
One vacant, one occupied (Lease ends 5/31/26), must give 48 hr notice.
-
2026-02-05price $147,533 70-char remark
Show marketing remark (70 chars)
One vacant, one occupied (Lease ends 5/31/26), must give 48 hr notice.
-
2026-01-05price $150,543 70-char remark
Show marketing remark (70 chars)
One vacant, one occupied (Lease ends 5/31/26), must give 48 hr notice.
-
2025-11-13price $153,616 70-char remark
Show marketing remark (70 chars)
One vacant, one occupied (Lease ends 5/31/26), must give 48 hr notice.
-
2025-10-08price $156,751 70-char remark
Show marketing remark (70 chars)
One vacant, one occupied (Lease ends 5/31/26), must give 48 hr notice.
-
2025-08-14$159,950 Active 70-char remark
Show marketing remark (70 chars)
One vacant, one occupied (Lease ends 5/31/26), must give 48 hr notice.
-
2018-06-08historical
-
2018-01-25$57,950
ⓘ Source: listings_history table (triggers on properties + properties_extension) + one-shot
backfill from property_details.listing_events for pre-trigger history.
Climate risk First Street
- Flood 7/10 Severe FEMA zone X (unshaded) · 99% chance over 30 yrs
- Wildfire 1/10 Low
- Heat 5/10 Major 7 d/yr ≥101°F today · 18 d/yr by 30 yrs out
- Wind 2/10 Low 100% chance of damaging wind over 30 yrs
- Air quality 1/10 Low 0 unhealthy d/yr today · 0 by 30 yrs out
Nearby sold comps map
Loading sold comps map…
Walkable amenities ~0.75 mi
Loading nearby amenities…
Taxation est. · year 1
- Rental income
- $27,864
- − Mortgage interest
- −$7,458
- − Property taxes
- −$1,997
- − Insurance
- −$1,332
- − Repairs & maintenance
- −$2,229
- − Management
- −$2,229
- − Depreciation
- −$3,873
- Taxable income
- $8,744
- Est. tax owed @ 24.0%
- −$2,099
- After-tax cash flow
- $8,205/yr
For passive investors: Depreciation is non-cash, so a rental often shows a tax loss while cash-flowing — sheltering income. Rental losses are passive: they offset passive income freely, and up to $25,000/yr can offset ordinary (W-2) income if you actively participate and your MAGI is under $100k (phasing out to $0 by $150k); unused losses carry forward. On sale, claimed depreciation is recaptured at up to 25%, and gains may owe capital-gains tax (a 1031 exchange can defer both). Figures are a year-1 estimate at your 24.0% rate — not tax advice; consult a CPA.
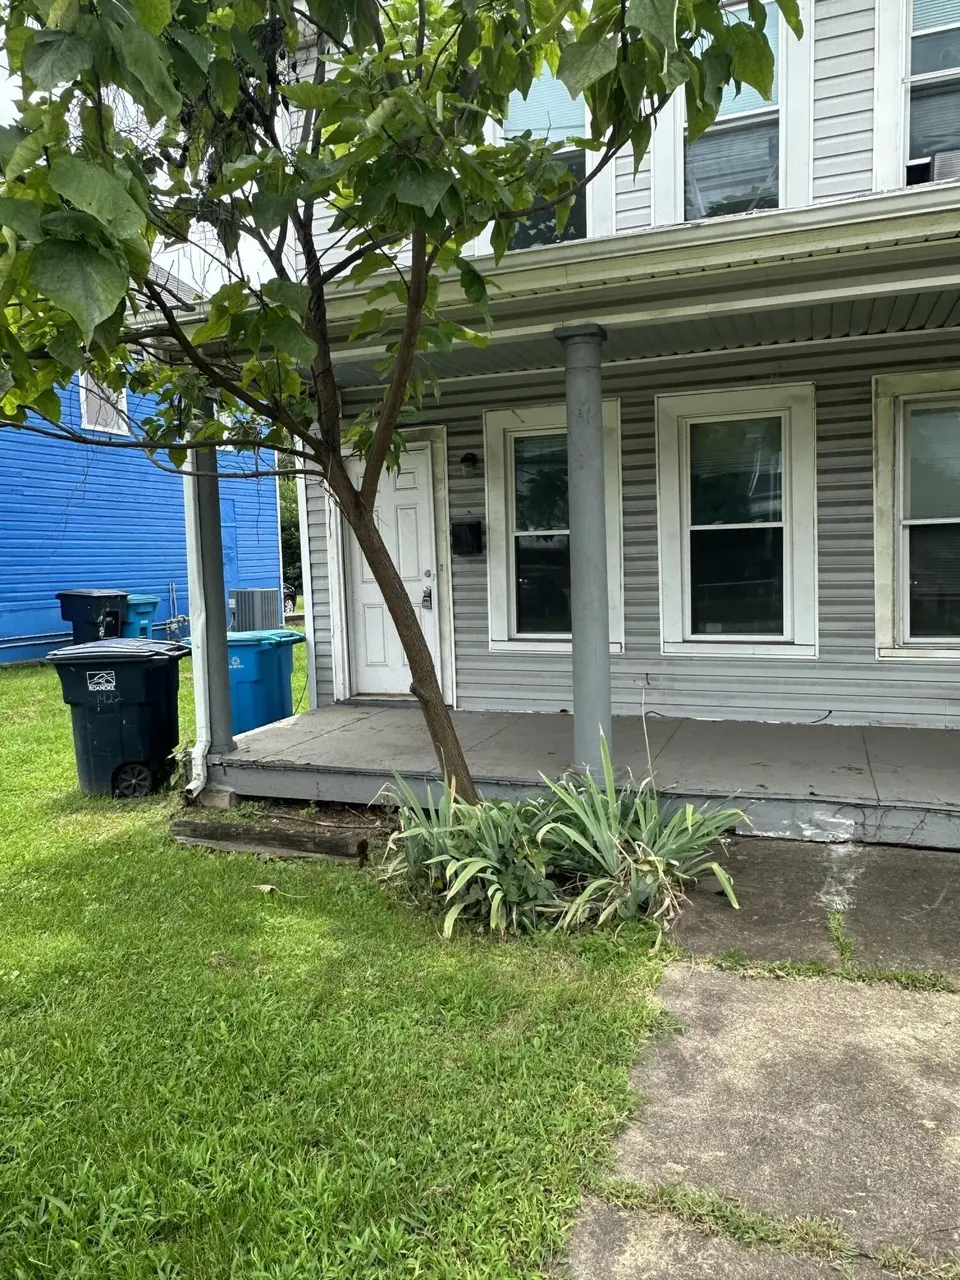
Condition & rehab AI · 13 photos
The property requires moderate repairs and maintenance, with the highest ROI coming from updating the exterior, kitchen, and bathroom.
Repairs flagged
- Minor kitchen cabinets — slight wear
- Minor bathroom fixtures — slight wear
- Moderate exterior paint — moderate discoloration
Value-add opportunities
- Both paint exterior — enhances curb appeal and resale value
- Both replace kitchen cabinets — modernizes kitchen and improves resale value
- Both replace bathroom fixtures — modernizes bathroom and improves resale value
Renovation cost estimate screening
| Repair item | Severity | Est. cost |
|---|---|---|
| kitchen cabinets · slight wear | Minor | $500–3,000 |
| bathroom fixtures · slight wear | Minor | $500–3,000 |
| exterior paint · moderate discoloration | Moderate | $3,000–15,000 |
| Total estimated repair cost · 3 items | $4,000–21,000 |
Value-add ROI direction
- Both paint exterior — enhances curb appeal and resale value ↑
- Both replace kitchen cabinets — modernizes kitchen and improves resale value ↑
- Both replace bathroom fixtures — modernizes bathroom and improves resale value ↑
ⓘ Cost ranges are severity-bucket heuristics (US national rule-of-thumb). Get contractor quotes + a written scope before underwriting a rehab budget.
Schools (NCES district)
- District
- Roanoke City Public School District
- NCES district ID
- 5103300
- Math proficiency
- 40% ▼ -38.00%
- Reading proficiency
- 58% ▼ -12.00%
- Median HH income
- $38,592
- Composite
- 40.8/100
- National rank
- #3639
- State rank
- #102 of 131 in VA
Livability — Roanoke
- Score
- 73/100
- State rank
- #163
- US rank
- #5055
Category grades
Schools grade is shown separately in the Schools card above.
Census & demographics
- Census place
- Roanoke, VA
- County
- Roanoke City · 101,625 people
- City population
- 168,930
- Metro
- Roanoke, VA
- Population (ZIP)
- 23,678
- Household income
- $47,360
- Rent vs Own
- Severe rent burden
- 913.0
Population outlook (Roanoke County) Hauer SSP2
- Today (2025)
- 106,094 people
- By 2030
- 108,927 · +2.7%
- By 2040
- 114,104 · +7.5%
- By 2050
- 118,032 · +11.3%
- By 2075
- 123,363 · +16.3%
- By 2100
- 116,827 · +10.1%
Race, ethnicity, and origin ACS 2023
- Neighborhood character
- Diverse neighborhood (Simpson 0.58)
- Race & ethnicity
- Black 59% White 25% Hispanic / Latino 9% Asian 4% Two or more races 4%
- Hispanic origin (detail)
- Mexican 2% Cuban 1%
- Common ancestry
- Slovak 1% Romanian 1% Lithuanian 1%
- Foreign-born
- 9% · Canada, China, Vietnam
- Languages at home
- 87% English-only · Spanish 8% Other Indo-European 3% German/W. Germanic 1%
Political lean MEDSL · Roanoke
- 2024 margin
- Strong D (+23.6) · D 61.1% · R 37.5% · Other 1.4%
- 2008→2024 swing
- +0.2pp no change · 2008: 23.4pp · 2024: 23.6pp
- All cycles
- 2024: D+23.6 2020: D+25.8 2016: D+17.6 2012: D+21.5 2008: D+23.4
Not yet ingested
- Civics
- —
Market trends
- HPI YoY
- ▼ -78.29%
- Current HPI
- 198.5991
- Rent YoY
- ▲ 5.71%
- Metro
- Roanoke, VA
- State GDP YoY
- ▲ 2.40%
- F500 in state
- 50
Industry mix (Fortune 500 HQ in VA)
| Industry | F500 HQs | Revenue |
|---|---|---|
| Aerospace / Defense | 4 | $236B |
|
||
| Technology / Defense | 3 | $32B |
|
||
| Financial Services | 2 | $176B |
|
||
| Utilities | 2 | $27B |
|
||
| Insurance | 2 | $25B |
|
||
| Technology | 2 | $15B |
|
||
Price history
+141.9% since first listed8 events — show timeline
- 2026-05-05 Price Changed $140,157 MLSRV
- 2026-02-05 Price Changed $147,533 MLSRV
- 2026-01-05 Price Changed $150,543 MLSRV
- 2025-11-13 Price Changed $153,616 MLSRV
- 2025-10-08 Price Changed $156,751 MLSRV
- 2025-08-14 Listed $159,950 MLSRV
- 2018-06-08 Listing Removed — MLSRV
- 2018-01-25 Listed $57,950 MLSRV
Cash-flow waterfall
monthlySold comps — $/sqft
last 12 mo · ≤1 miLoading sold comps…