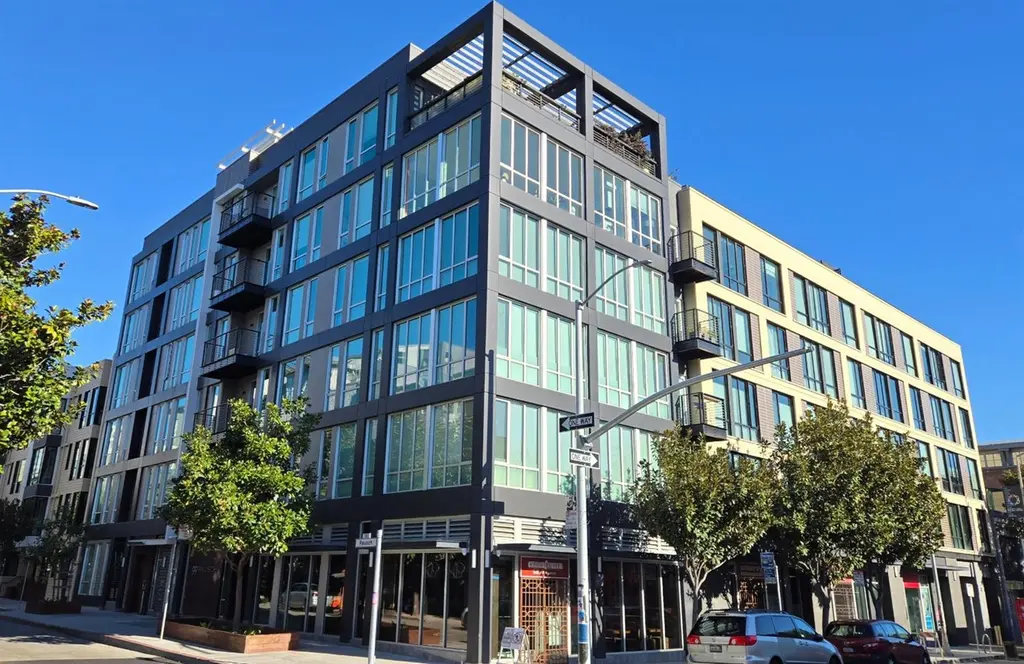
99 Rausch St #421 · San Francisco, CA
Flood risk 1/10 · Minimal
- FEMA flood zone
- X (unshaded)
- Chance of flooding over 30 yrs
- 0.0%
- Est. flood insurance / yr
- $507 – $1,088
Fire risk 1/10 · Minimal
- Est. fire insurance / yr
- $659 – $1,223
Heat risk 3/10 · Minor
- Hot days now (above 79°F)
- 8 days/yr
- Hot days in 30 yrs
- 17 days/yr
Wind risk 1/10 · Minimal
- Chance of severe wind over 30 yrs
- —
Air-quality risk 8/10 · Major
- Unhealthy air days now
- 15 days/yr
- Unhealthy air days in 30 yrs
- 15 days/yr
Risk factors via First Street. Map © Google.
Why this score? — see what drove the C- grade
The composite is a weighted blend of 9 inputs, each scored 0–100. Each bar is that input's sub-score; the figure is the points it added to the 100-point composite (weight × sub-score).
- ARV discount +15.0/15.0
- Appreciation +7.5/10.0
- Cash flow +6.8/30.0
- Rent growth +5.0/5.0
- Schools +5.0/10.0
- 1% rule +3.9/10.0
- Livability +3.8/5.0
- Condition / age +2.5/5.0
- DSCR +1.0/10.0
$436,500
🖨 Deal sheet (PDF) 📄 Offer letter ✓ Due diligence
Listing remarks MLS
Nestled in the heart of San Francisco in the South of Market area, 99 Rausch was completed in 2017 by award-winning BAR Architects. Luxury living with an open living area, top notch cabinets and appliances including large stacked washer & Dryer, wide plank oak flooring, outdoor area, Nest-controlled HVAC & in-unit laundry. 99 Rausch is a 6-story, 112-residence community with state-of-the-art amenities & environmentally sustainable features. Inspired Modern living at the heart of everything. Featuring 7 days a week concierge, Gym, Yoga Area, Owners Lounge with TV & wet bar, Meeting Room, Bicycle Repair Station, & Dog Wash Station. Best of all, a sun kissed Rooftop Deck and Lounge includes 2 BBQ grills, multiple partitioned seating areas, fire pit, and panoramic views from downtown skyline to twin peaks! Close to the Moscone Center, Civic Center, Civic Auditorium, Trader Joe's, Whole Foods, Costco & Yerba Buena Center for the Arts.1 Bedroom Below Market Rate (BMR) housing opportunity available at 100% Area Median Income (AMI). Maximum income for 1 person=$109,100 2 people = $124,700; 3 = $140,250; 4 = $155,850, 5 = $168,300. Must be 1st-time homebuyer & income eligible. Unit available thru the Mayor's Office of Housing and Community Development (MOHCD) & subject to resale controls, monitoring & other restrictions. Unit will be listed on DAHLIA, the SF Housing Portal (https://housing.sfgov.org) starting on the application date, Apr. 8, 2026. Visit https://housing.sfgov.org for application & program info. Application, loan pre-approval, and homebuyer education verification due by May 8, 2026 at 5:00 PM.
Key facts
- $820 HOA
- Garage
- Built 2017
Neighborhood map
What this means for you Summary
Snapshot
- This is a 1-bed/1.0-bath condo listed at $436k.
Deal economics
- At list price, monthly cash flow is $-681 ($-8k/yr) — negative.
- To cash-flow at today's rent, offer at most $316k (27.6% below list).
- To meet the 1% rule (rent ≥ 1% of price), the offer needs to be $387k (11.4% below list).
- Recommended offer: $316k (27.6% below list) — sets the bar for cash-flow.
- Cap rate 4.4% vs local median 2.1% in San Francisco — top-decile yield for the area; either an underpriced asset or a hidden risk that comps aren't pricing in. Stress-test before assuming the spread holds.
Location & tenants
- Location reads 76/100 on livability (#90 in CA, #3,143 nationally) — a middle-class / working-renter tenant base. Strengths: amenities A+, commute A+, employment A+; Watch: crime F, cost of living F.
- San Francisco Unified (urban): math 50% / reading 56% proficiency, ranked #322 of 1,400 in CA (top 23%) — acceptable for families but not a draw, mixed tenant base, ~2y average lease.
- Market conditions: Rents rising fast (+15.5%/yr); 108 active listings in the ZIP; 40 comparable units currently listed for rent nearby; rentals leasing fast (median 3d on market — plan ~1-2 weeks tenant-placement turnaround); high-income renter base; 750 units permitted in San Francisco County in 2024 (688 in 5+ unit buildings).
- This rent runs 40% of the median local income ($116k/yr) — at the standard rent-burdened threshold; future hikes will face affordability resistance.
Forward outlook
- In year one you build about $25k of equity ($3k loan paydown + $22k appreciation (5.0% local appreciation)).
- San Francisco County population projected at +39% by 2050 — long-run rental-demand tailwind backs the buy-and-hold thesis.
- By year 2, paydown + projected appreciation supports a ~$40k cash-out refi (75% LTV) — recoverable capital for the next deal without selling this one.
Negotiation context
- It's been on market 78 days — a 6% lower offer ($410k) is reasonable based on typical stale-listing flexibility.
Risks & watch-outs
- Watch-outs: HOA is 21% of rent.
Questions for the listing agent
- What do current leases actually rent for vs. the listed asking? Can we see a recent rent roll and the last 12 months of T-12 income?
- It's been on market 78 days. Have you received any prior offers? Is the seller open to a 28% concession, seller financing, or rate buy-down credit?
- What does the HOA fee cover, when was the last increase, and are there any pending special assessments or reserve-fund shortfalls?
- Any open or pending special assessments — roof, HVAC, plumbing, elevator, façade? What's the per-unit balance and payoff schedule, and is the seller paying it off at close or rolling it to the buyer?
- Why hasn't it sold? Are there any deal-killer items the seller is aware of (foundation, flood, title, zoning, code violations)?
- Is there a deadline driving the sale (1031 exchange, divorce, estate, relocation)? That informs how much negotiation room exists.
- Schools are B-rated — typically a magnet for longer-tenancy family renters. What's the average tenant stay here, and is there a school-zone premium baked into asking?
- Crime grade is F in this area — have there been break-ins, vandalism, or insurance claims at this property in the last 3 years? What carrier currently insures it and at what premium?
- What's the average days-on-market for RENTAL listings here right now (not sales)? A rising rental-DOM trend means longer vacancies and softer asking-rent achievability than the comps imply.
- What's the recent tenant-quality profile in this submarket — average credit score on applications, eviction rate, late-payment / NSF rate, and stable-employment percentage? A property-management company in the area should have these aggregated.
- How much new apartment / multifamily construction is in the pipeline within 1–3 miles? Heavy new supply (>2% of stock underway) typically softens rents 12–24 months out; light construction supports rent growth.
Investment metrics
- 1% rule
- 0.89% ✗
- Cap rate
- 4.42%
- Cash-on-cash
- -6.69%
- DSCR
- 0.70
- GRM
- 9.4
CMA / ARV
- ARV (median comp)
- $733,572
- List price
- $436,500
- Delta
- -40.50%
- Verdict
- UNDERPRICED
- Comps
- 20 within 1.0 mi
Projected returns pro-forma
4.96% appreciation · 8.0% rent growth · sell at horizon
- IRR
- 9.6%
- Equity multiple
- 1.63×
- Total profit
- $77,224
- Equity at exit
- $246,365
- IRR
- 13.4%
- Equity multiple
- 3.63×
- Total profit
- $321,522
- Equity at exit
- $424,373
Cash invested: $122,220 (down + closing). Projections, not guarantees.
Landlord ↔ Tenant lean methodology
- Overall (CITY)
- 0 Strongly Tenant-Friendly
- State California
- 18 Strongly Tenant-Friendly · D+13
- County
- — inherits STATE
- City San Francisco
- 0 Strongly Tenant-Friendly · D+57
ZIP-level market 94103
- Home prices YoY
- 2.9%
- Rents YoY
- 15.5%
- Active inventory
- 108
- Price-to-rent
- 9.4×
Monthly cashflow live
- Estimated rent
- $3,869 high interval (Pro) →
- Mortgage (P&I)
- −$2,289
- Tax from tax record
- −$447 /mo · $5,368/yr
- Insurance
- −$182
- HOA
- −$820
- Vacancy / Maint / Mgmt
- −$813
- Net cashflow
- $-681
Break-even live
Sensitivity live
| Price | -10% $-434 | -5% $-558 | +0% $-681 | +5% $-805 | +10% $-929 |
|---|---|---|---|---|---|
| Rent | -10% $-987 | -5% $-834 | +0% $-681 | +5% $-529 | +10% $-376 |
| Rate | -1.0pp $-462 | -0.5pp $-570 | base $-681 | +0.5pp $-795 | +1.0pp $-910 |
UW: 25.0% down · 7.5% · 30yr · 1.5% tax · 5.0% vac · 8.0% maint · 8.0% mgmt
Financing live
Cash to close
- Down payment
- $109,125
- Closing costs
- $13,095
- Reserves months
- —
- Total cash needed
- —
Loan-product check · same deal, 3 products live
Conventional
25% down · 7.5% · 30yr
- Down + closing
- —
- Monthly P&I
- —
- Monthly cashflow
- —
- DSCR
- —
- Eligible?
- —
Personal DTI + credit; lowest rate.
DSCR
20% down · 8.5% · 30yr
- Down + closing
- —
- Monthly P&I
- —
- Monthly cashflow
- —
- DSCR
- —
- Eligible?
- —
No personal income docs; deal must DSCR.
Hard money
10% down · 12.0% · 12mo
- Down + closing
- —
- Monthly P&I
- —
- Monthly cashflow
- —
- DSCR
- —
- Eligible?
- —
Short-term bridge; refi at stabilization.
Rent comps 40 comps
| Address | Beds | Baths | Sqft | Rent | $/sqft | DOM | Units | Dist |
|---|---|---|---|---|---|---|---|---|
| 99 Rausch St San Francisco, CA | 1.0 | 1.0 | 655 | $4,250 | $6.49 | 25d | 1 | 0.02mi |
| 603 Natoma St Apt 406 San Francisco, CA | 1.0 | 1.0 | 556 | $2,950 | $5.31 | 44d | 1 | 0.16mi |
| 1222 Harrison St San Francisco, CA | 2.0 | 1.0–2.5 | 853 | $4,798 | $5.62 | 2d | 34 | 0.17mi |
| 84 Harriet St Unit A San Francisco, CA | 1.0 | 1.0 | 718 | $3,295 | $4.59 | 21d | 1 | 0.20mi |
| 1288 Howard St #604 San Francisco, CA | 1.0 | 1.0 | 431 | $3,400 | $7.89 | 44d | 1 | 0.23mi |
| 1288 Howard St #1908 San Francisco, CA | 1.0–2.0 | 1.0–2.0 | 782 | $4,190 | $5.35 | 2d | 2 | 0.23mi |
| 1188 Mission St San Francisco, CA | 1.0 | 1.0 | 448 | $3,269 | $7.29 | 2d | 17 | 0.25mi |
| 975 Bryant St San Francisco, CA | 2.0 | 1.0–2.0 | 697 | $4,814 | $6.91 | 2d | 10 | 0.26mi |
| 1190 Mission St San Francisco, CA | 1.0 | 1.0 | 508 | $3,136 | $6.17 | 2d | 5 | 0.26mi |
| 33 8th St San Francisco, CA | 1.0–2.0 | 1.0 | 646 | $3,744 | $5.79 | 3d | 10 | 0.30mi |
| 570 Jessie St San Francisco, CA | — | 1.0 | 430 | $2,495 | $5.80 | 3d | 1 | 0.34mi |
| 1075 Market St San Francisco, CA | 1.0 | 1.0 | 546 | $3,500 | $6.40 | 25d | 2 | 0.35mi |
| 55 9th St San Francisco, CA | 2.0 | 1.0–2.0 | 861 | $4,430 | $5.14 | 3d | 1 | 0.36mi |
| 1075 Market St #461 San Francisco, CA | 1.0 | 1.0 | 648 | $3,460 | $5.34 | 21d | 1 | 0.37mi |
| 1075 Market St #603 San Francisco, CA | — | 1.0 | 445 | $3,300 | $7.42 | 8d | 1 | 0.37mi |
| 855 Brannan St San Francisco, CA | 3.0 | 1.0–2.0 | 958 | $5,133 | $5.36 | 2d | 5 | 0.38mi |
| 900 Folsom St San Francisco, CA | 2.0 | 1.0–2.0 | 863 | $5,020 | $5.82 | 2d | 24 | 0.39mi |
| 434 Minna St San Francisco, CA | 2.0 | 1.0–2.0 | 719 | $5,246 | $7.29 | 2d | 15 | 0.40mi |
| 400 Clementina St #1449 San Francisco, CA | 1.0–2.0 | 1.0–2.0 | 775 | $3,970 | $5.12 | 2d | 2 | 0.41mi |
| 1028 Market St San Francisco, CA | 2.0 | 1.0 | 526 | $4,090 | $7.77 | 2d | 6 | 0.42mi |
| 50 Jones St San Francisco, CA | 1.0 | 1.0 | 471 | $3,397 | $7.21 | 4d | 9 | 0.43mi |
| 18 10th St #1315 San Francisco, CA | — | 1.0 | 479 | $4,463 | $9.31 | 4d | 2 | 0.45mi |
| 1532 Harrison St San Francisco, CA | 2.0 | 1.0–2.0 | 617 | $3,984 | $6.46 | 2d | 11 | 0.45mi |
| 8 10th St San Francisco, CA | 2.0 | 1.0–2.0 | 919 | $6,104 | $6.64 | 3d | 28 | 0.46mi |
| 1390 Market St San Francisco, CA | 1.0 | 1.0 | 561 | $4,067 | $7.25 | 2d | 14 | 0.47mi |
| 673 Brannan St San Francisco, CA | 1.0–5.0 | 1.0–2.0 | 1302 | $3,912 | $3.00 | 2d | 2 | 0.49mi |
| 960 Market St San Francisco, CA | 1.0 | 1.0 | 613 | $4,295 | $7.01 | 22d | 1 | 0.49mi |
| 1 Polk St San Francisco, CA | 1.0 | 1.0 | 773 | $4,644 | $6.00 | 3d | 4 | 0.50mi |
| 101 Polk St San Francisco, CA | 1.0 | 1.0 | 573 | $4,614 | $8.04 | 3d | 7 | 0.52mi |
| 1 Henry Adams St San Francisco, CA | 3.0 | 2.0 | 873 | $6,587 | $7.54 | 2d | 3 | 0.53mi |
| 285 Turk St Apt 507 San Francisco, CA | 1.0 | 1.0 | 462 | $1,795 | $3.89 | 44d | 1 | 0.53mi |
| 829 Folsom St #408 San Francisco, CA | — | 1.0 | 495 | $2,860 | $5.78 | 15d | 1 | 0.54mi |
| 821 Folsom St #401 San Francisco, CA | 1.0 | 1.0 | 652 | $3,650 | $5.60 | 25d | 1 | 0.56mi |
| 100 Van Ness Ave #1477 San Francisco, CA | 1.0–2.0 | 1.0–2.0 | 893 | $5,940 | $6.65 | 2d | 2 | 0.56mi |
| 150 Van Ness Ave #1475 San Francisco, CA | 1.0 | 1.0 | 615 | $5,510 | $8.96 | 21d | 1 | 0.56mi |
| 30 Otis St San Francisco, CA | 2.0 | 1.0–2.0 | 874 | $6,956 | $7.95 | 3d | 13 | 0.59mi |
| 1 Brady St San Francisco, CA | 2.0 | 1.0–2.0 | 889 | $5,557 | $6.25 | 2d | 29 | 0.66mi |
| 291 15th St San Francisco, CA | 1.0 | 1.0 | 550 | $2,695 | $4.90 | 25d | 1 | 0.66mi |
| 360 Berry St San Francisco, CA | 1.0–2.0 | 1.0–2.0 | 842 | $4,512 | $5.36 | 2d | 4 | 0.67mi |
| 360 Hyde St San Francisco, CA | — | 1.0 | 415 | $1,795 | $4.33 | 44d | 1 | 0.68mi |
HOA detail condo
- Monthly dues
- $820 · $9,840/yr
- Likely covers
- gymdoorman
- Assessments
- None detected in remarks — confirm with the listing agent.
Listing history 15 events
-
2026-06-18days on market $436,500 Active 78 DOM
-
2026-06-17days on market $436,500 Active 77 DOM
-
2026-06-16days on market $436,500 Active 76 DOM
-
2026-06-15days on market $436,500 Active 75 DOM
-
2026-06-13days on market $436,500 Active 73 DOM
-
2026-06-13days on market $436,500 Active 72 DOM
-
2026-06-09days on market $436,500 Active 69 DOM
-
2026-06-08days on market $436,500 Active 68 DOM
-
2026-06-07days on market $436,500 Active 67 DOM
-
2026-06-04days on market $436,500 Active 64 DOM
-
2026-06-03days on market $436,500 Active 63 DOM
-
2026-06-02days on market $436,500 Active 62 DOM
-
2026-06-01days on market $436,500 Active 61 DOM
-
2026-05-31days on market $436,500 Active 60 DOM
-
2026-04-01$468,300 Active 1666-char remark
Show marketing remark (1666 chars)
Nestled in the heart of San Francisco in the South of Market area, 99 Rausch was completed in 2017 by award-winning BAR Architects. Luxury living with an open living area, top notch cabinets and appliances including large stacked washer & Dryer, wide plank oak flooring, outdoor area, Nest-controlled HVAC & in-unit laundry. 99 Rausch is a 6-story, 112-residence community with state-of-the-art amenities & environmentally sustainable features. Inspired Modern living at the heart of everything. Featuring 7 days a week concierge, Gym, Yoga Area, Owners Lounge with TV & wet bar, Meeting Room, Bicycle Repair Station, & Dog Wash Station. Best of all, a sun kissed Rooftop Deck and Lounge includes 2 BBQ grills, multiple partitioned seating areas, fire pit, and panoramic views from downtown skyline to twin peaks! Close to the Moscone Center, Civic Center, Civic Auditorium, Trader Joe's, Whole Foods, Costco & Yerba Buena Center for the Arts.1 Bedroom Below Market Rate (BMR) housing opportunity available at 100% Area Median Income (AMI). Maximum income for 1 person=$109,100 2 people = $124,700; 3 = $140,250; 4 = $155,850, 5 = $168,300. Must be 1st-time homebuyer & income eligible. Unit available thru the Mayor's Office of Housing and Community Development (MOHCD) & subject to resale controls, monitoring & other restrictions. Unit will be listed on DAHLIA, the SF Housing Portal (https://housing.sfgov.org) starting on the application date, Apr. 8, 2026. Visit https://housing.sfgov.org for application & program info. Application, loan pre-approval, and homebuyer education verification due by May 8, 2026 at 5:00 PM.
ⓘ Source: listings_history table (triggers on properties + properties_extension) + one-shot
backfill from property_details.listing_events for pre-trigger history.
Tax reassessment forecast CA · Resets to sale price
- Current annual tax
- $5,368 · $447/mo
- Projected year-2 tax
- $5,368 · $447/mo
- Expected delta
- $0/yr ($0/mo · 0.0%)
ⓘ Screening estimate from a state-policy table — verify with the county assessor before closing.
Climate risk First Street
- Flood 1/10 Low FEMA zone X (unshaded) · 0% chance over 30 yrs
- Wildfire 1/10 Low
- Heat 3/10 Moderate 8 d/yr ≥79°F today · 17 d/yr by 30 yrs out
- Wind 1/10 Low
- Air quality 8/10 Severe 15 unhealthy d/yr today · 15 by 30 yrs out
Nearby sold comps map
Loading sold comps map…
Walkable amenities ~0.75 mi
Loading nearby amenities…
Taxation est. · year 1
- Rental income
- $46,433
- − Mortgage interest
- −$24,451
- − Property taxes
- −$5,368
- − Insurance
- −$2,182
- − Repairs & maintenance
- −$3,715
- − Management
- −$3,715
- − HOA
- −$9,840
- − Depreciation
- −$12,698
- Taxable loss
- −$15,536
- Est. tax savings @ 24.0%
- +$3,729
- After-tax cash flow
- $-4,448/yr
For passive investors: Depreciation is non-cash, so a rental often shows a tax loss while cash-flowing — sheltering income. Rental losses are passive: they offset passive income freely, and up to $25,000/yr can offset ordinary (W-2) income if you actively participate and your MAGI is under $100k (phasing out to $0 by $150k); unused losses carry forward. On sale, claimed depreciation is recaptured at up to 25%, and gains may owe capital-gains tax (a 1031 exchange can defer both). Figures are a year-1 estimate at your 24.0% rate — not tax advice; consult a CPA.
Schools (NCES district)
- District
- San Francisco Unified
- NCES district ID
- 0634410
- Math proficiency
- 50% ▬ 0.00%
- Reading proficiency
- 56% ▲ 1.00%
- Median HH income
- $81,249
- Composite
- 50.14/100
- National rank
- #4088
- State rank
- #322 of 1400 in CA
Livability — San Francisco
- Score
- 76/100
- State rank
- #90
- US rank
- #3143
Category grades
Schools grade is shown separately in the Schools card above.
Census & demographics
- Census place
- San Francisco, CA
- County
- San Francisco County · 827,552 people
- City population
- 827,552
- Metro
- San Francisco-Oakland-Berkeley, CA
- Population (ZIP)
- 34,964
- Household income
- $116,438
- Rent vs Own
- Severe rent burden
- 2666.0
Population outlook (San Francisco County) Hauer SSP2
- Today (2025)
- 1,030,936 people
- By 2030
- 1,110,409 · +7.7%
- By 2040
- 1,270,010 · +23.2%
- By 2050
- 1,435,001 · +39.2%
- By 2075
- 1,779,074 · +72.6%
- By 2100
- 1,966,767 · +90.8%
Race, ethnicity, and origin ACS 2023
- Neighborhood character
- Highly diverse neighborhood (Simpson 0.75)
- Race & ethnicity
- White 32% Asian 31% Hispanic / Latino 20% Two or more races 11% Black 10% Native American 2%
- Hispanic origin (detail)
- Mexican 11%
- Common ancestry
- Lithuanian 2% Slovak 2% Romanian 2%
- Foreign-born
- 36% · Canada, China, Vietnam
- Languages at home
- 56% English-only · Spanish 16% Chinese 9% Tagalog/Filipino 6%
Political lean MEDSL · San Francisco
- 2024 margin
- Solid D (+64.8) · D 80.3% · R 15.5% · Other 4.1%
- 2008→2024 swing
- -5.7pp toward R · 2008: 70.5pp · 2024: 64.8pp
- All cycles
- 2024: D+64.8 2020: D+72.5 2016: D+76.1 2012: D+70.2 2008: D+70.5
Not yet ingested
- Civics
- —
Market trends
- HPI YoY
- ▲ 4.96%
- Current HPI
- 175.4945
- Rent YoY
- ▲ 15.50%
- Metro
- San Francisco-Oakland-Berkeley, CA
- State GDP YoY
- ▲ 3.21%
- F500 in state
- 116
Industry mix (Fortune 500 HQ in CA)
| Industry | F500 HQs | Revenue |
|---|---|---|
| Technology | 27 | $1,492B |
|
||
| Financial Services | 3 | $174B |
|
||
| Retail | 3 | $44B |
|
||
| Insurance | 3 | $26B |
|
||
| Media / Entertainment | 2 | $115B |
|
||
| Pharmaceuticals / Biotech | 2 | $62B |
|
||
Price history
1 event — show timeline
- 2026-04-01 Listed $468,300 FRESNOMLS
Property tax history
+12.3%/yrLatest (2025): $5,368 · +2.9% YoY. Source: county tax records.
Cash-flow waterfall
monthlySold comps — $/sqft
last 12 mo · ≤1 miLoading sold comps…