 🏗️ New Construction
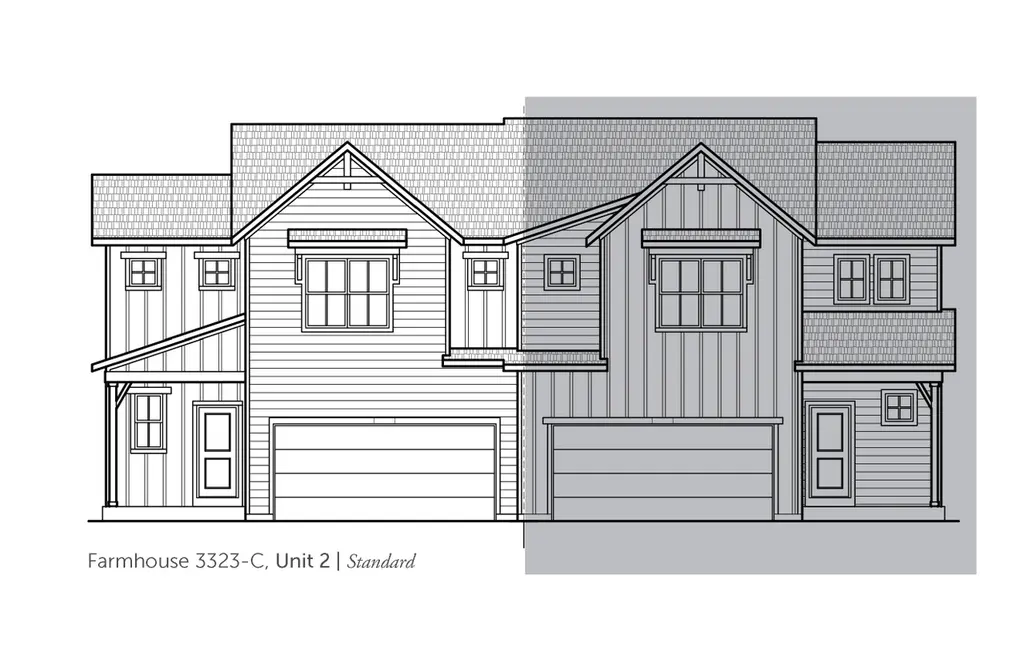
Peak Mountain Duo 2 Plan · Colorado Springs, CO
Flood risk No data
- FEMA flood zone
- —
- Chance of flooding over 30 yrs
- —
- Est. flood insurance / yr
- —
Fire risk No data
- Est. fire insurance / yr
- —
Heat risk No data
- Hot days now (above threshold)
- —
- Hot days in 30 yrs
- —
Wind risk No data
- Chance of severe wind over 30 yrs
- —
Air-quality risk No data
- Unhealthy air days now
- —
- Unhealthy air days in 30 yrs
- —
Risk factors via First Street. Map © Google.
Why this score? — see what drove the C- grade
The composite is a weighted blend of 9 inputs, each scored 0–100. Each bar is that input's sub-score; the figure is the points it added to the 100-point composite (weight × sub-score).
- Cash flow +18.7/30.0
- ARV discount +7.5/15.0
- DSCR +5.9/10.0
- Schools +5.1/10.0
- 1% rule +5.0/10.0
- Appreciation +4.1/10.0
- Livability +3.9/5.0
- Rent growth +2.3/5.0
- Condition / age +1.0/5.0
$454,100
🖨 Deal sheet 📄 Offer letter ✓ Due diligence
Multi-family units
County records classify this as Multi-Family (2-4 Unit). Listing-text estimate: 2 units. confirmed
Listing remarks MLS
The Peak Mountain Duo 2 is a "to be built" duplex, 2-story home and includes 3 beds, 2.5 baths, dining space, covered porch, 2-car garage, patio, and exterior landscaping & fencing. Smart Home Connection Package is Now Included in ALL Classic Homes! Options include kitchen island, loft, master bath soaker tub/shower combo.
Key facts
- Covered porch
- Fencing
- Kitchen island
Tags
Neighborhood map
What this means for you Summary
Snapshot
- This is a 2 × 3.0-bed/2.5-bath units multifamily listed at $454k. Condition is rated poor.
Deal economics
- At list price, monthly cash flow is $452 ($5k/yr) — positive. Per door: $226/mo.
- The deal already cash-flows at list — no discount required.
- Meets the 1% rule at list price ($5k rent vs $454k).
- Recommended offer: $400k (12.0% below list) — sets the bar for market timing.
- Cap rate 7.5% vs local median 3.3% in Colorado Springs — top-decile yield for the area; either an underpriced asset or a hidden risk that comps aren't pricing in. Stress-test before assuming the spread holds.
Location & tenants
- Location reads 78/100 on livability (#23 in CO, #2,639 nationally) — a middle-class / working-renter tenant base. Strengths: amenities A+, housing A+, health & safety A+; Watch: cost of living C-, crime F.
- Academy School District No. 20 In The County Of El Paso An (urban): math 45% / reading 65% proficiency, ranked #8 of 86 in CO (top 9%) — acceptable for families but not a draw, mixed tenant base, ~2y average lease; only 10% free/reduced lunch — higher-income household profile.
- Market conditions: Rents soft (-0.8%/yr); 403 active listings in the ZIP; high-income renter base; 3,906 units permitted in El Paso County in 2024 (872 in 5+ unit buildings).
- This rent runs 39% of the median local income ($139k/yr) — at the standard rent-burdened threshold; future hikes will face affordability resistance.
Forward outlook
- Local home prices are declining (-1.8%/yr); year-one equity from $3k of loan paydown is wiped out by about $8k of value loss. Plan a longer hold.
- El Paso County population projected at +28% by 2050 — long-run rental-demand tailwind backs the buy-and-hold thesis.
Negotiation context
- It's been on market 329 days — a 12% lower offer ($400k) is reasonable based on typical stale-listing flexibility.
Questions for the listing agent
- It's been on market 329 days. Have you received any prior offers? Is the seller open to a 12% concession, seller financing, or rate buy-down credit?
- Can we see the unit-by-unit rent roll, current vacancy, and any below-market leases? What's the average tenancy length?
- What capital expenditures (roof, boiler, parking lot, exteriors) have been made in the last 5 years, and what's planned in the next 2?
- Have any recent inspections been done? Can we get a copy of the seller's disclosures and any deferred-maintenance estimates?
- Why hasn't it sold? Are there any deal-killer items the seller is aware of (foundation, flood, title, zoning, code violations)?
- Is there a deadline driving the sale (1031 exchange, divorce, estate, relocation)? That informs how much negotiation room exists.
- Schools are B-rated — typically a magnet for longer-tenancy family renters. What's the average tenant stay here, and is there a school-zone premium baked into asking?
- Crime grade is F in this area — have there been break-ins, vandalism, or insurance claims at this property in the last 3 years? What carrier currently insures it and at what premium?
- What's the average days-on-market for RENTAL listings here right now (not sales)? A rising rental-DOM trend means longer vacancies and softer asking-rent achievability than the comps imply.
- What's the recent tenant-quality profile in this submarket — average credit score on applications, eviction rate, late-payment / NSF rate, and stable-employment percentage? A property-management company in the area should have these aggregated.
- How much new apartment / multifamily construction is in the pipeline within 1–3 miles? Heavy new supply (>2% of stock underway) typically softens rents 12–24 months out; light construction supports rent growth.
Investment metrics
- 1% rule
- 1.00% ✓
- Cap rate
- 7.49%
- Cash-on-cash
- 4.27%
- DSCR
- 1.19
- GRM
- 8.3
CMA / ARV
No comps found within radius.
Projected returns pro-forma
-1.81% appreciation · 0.0% rent growth · sell at horizon
- IRR
- -6.9%
- Equity multiple
- 0.73×
- Total profit
- $-34,960
- Equity at exit
- $92,243
- IRR
- -2.5%
- Equity multiple
- 0.81×
- Total profit
- $-23,767
- Equity at exit
- $82,726
Cash invested: $127,148 (down + closing). Projections, not guarantees.
Landlord ↔ Tenant lean methodology
- Overall (STATE)
- 38 Tenant-Leaning
- State Colorado
- 38 Tenant-Leaning · D+4
- County
- — inherits STATE
- City
- — inherits STATE
ZIP-level market 80924
- Home prices YoY
- -1.0%
- Rents YoY
- -0.8%
- Active inventory
- 403
- Price-to-rent
- 16.7×
Monthly cashflow live
- Estimated rent
- $4,545 medium interval (Pro) →
- Mortgage (P&I)
- −$2,381
- Tax est. 1.5%
- −$568 /mo · $6,812/yr
- Insurance
- −$189
- HOA
- −$0
- Vacancy / Maint / Mgmt
- −$954
- Net cashflow
- $452
Break-even live
2-unit breakdown (identical units grouped — click to expand)
| Units | Beds | Baths | Est. rent |
|---|---|---|---|
| 2× units | 3.0 | 2.5 | $4,546 |
| #1 | 3.0 | 2.5 | $2,273 |
| #2 | 3.0 | 2.5 | $2,273 |
| Total (2 units) | $4,545 | ||
UW: 25.0% down · 7.5% · 30yr · 1.5% tax · 5.0% vac · 8.0% maint · 8.0% mgmt
Financing live
Cash to close
- Down payment
- $113,525
- Closing costs
- $13,623
- Reserves months
- —
- Total cash needed
- —
Loan-product check · same deal, 3 products live
Conventional
25% down · 7.5% · 30yr
- Down + closing
- —
- Monthly P&I
- —
- Monthly cashflow
- —
- DSCR
- —
- Eligible?
- —
Personal DTI + credit; lowest rate.
DSCR
20% down · 8.5% · 30yr
- Down + closing
- —
- Monthly P&I
- —
- Monthly cashflow
- —
- DSCR
- —
- Eligible?
- —
No personal income docs; deal must DSCR.
Hard money
10% down · 12.0% · 12mo
- Down + closing
- —
- Monthly P&I
- —
- Monthly cashflow
- —
- DSCR
- —
- Eligible?
- —
Short-term bridge; refi at stabilization.
Listing history 16 events
-
2026-06-18days on market $454,100 Active 329 DOM
-
2026-06-17days on market $454,100 Active 328 DOM
-
2026-06-16days on market $454,100 Active 327 DOM
-
2026-06-15days on market $454,100 Active 326 DOM
-
2026-06-14days on market $454,100 Active 324 DOM
-
2026-06-13days on market $454,100 Active 323 DOM
-
2026-06-10days on market $454,100 Active 321 DOM
-
2026-06-09days on market $454,100 Active 320 DOM
-
2026-06-08days on market $454,100 Active 319 DOM
-
2026-06-07days on market $454,100 Active 318 DOM
-
2026-06-05days on market $454,100 Active 315 DOM
-
2026-06-03days on market $454,100 Active 314 DOM
-
2026-06-03days on market $454,100 Active 313 DOM
-
2026-06-01days on market $454,100 Active 312 DOM
-
2026-05-31days on market $454,100 Active 311 DOM
-
2025-07-25$454,100 Active 340-char remark
Show marketing remark (340 chars)
The Peak Mountain Duo 2 is a "to be built" duplex, 2-story home and includes 3 beds, 2.5 baths, dining space, covered porch, 2-car garage, patio, and exterior landscaping & fencing. Smart Home Connection Package is Now Included in ALL Classic Homes! Options include kitchen island, loft, master bath soaker tub/shower combo.
ⓘ Source: listings_history table (triggers on properties + properties_extension) + one-shot
backfill from property_details.listing_events for pre-trigger history.
Nearby sold comps map
Loading sold comps map…
Walkable amenities ~0.75 mi
Loading nearby amenities…
Taxation est. · year 1
- Rental income
- $54,540
- − Mortgage interest
- −$25,437
- − Property taxes
- −$6,812
- − Insurance
- −$2,270
- − Repairs & maintenance
- −$4,363
- − Management
- −$4,363
- − Depreciation
- −$13,210
- Taxable loss
- −$1,915
- Est. tax savings @ 24.0%
- +$460
- After-tax cash flow
- $5,888/yr
For passive investors: Depreciation is non-cash, so a rental often shows a tax loss while cash-flowing — sheltering income. Rental losses are passive: they offset passive income freely, and up to $25,000/yr can offset ordinary (W-2) income if you actively participate and your MAGI is under $100k (phasing out to $0 by $150k); unused losses carry forward. On sale, claimed depreciation is recaptured at up to 25%, and gains may owe capital-gains tax (a 1031 exchange can defer both). Figures are a year-1 estimate at your 24.0% rate — not tax advice; consult a CPA.
Condition & rehab AI · 4 photos
This 'to be built' duplex requires extensive renovations across all systems and areas. Immediate updates to the kitchen, bathrooms, exterior, and HVAC are essential to increase its resale and rental value.
Repairs flagged
- Major Kitchen — No photos of kitchen
- Major Bathrooms — No photos of bathrooms
- Major Roof — No photos of roof
- Major Exterior — No photos of exterior
- Major Flooring — No photos of flooring
- Major Interior walls/paint — No photos of interior walls/paint
- Major Windows — No photos of windows
- Major Foundation/structure — No photos of foundation/structure
- Major HVAC/mechanicals — No photos of HVAC/mechanicals
- Major Landscaping/curb appeal — No photos of landscaping/curb appeal
Value-add opportunities
- Both Kitchen renovation — A modern kitchen can significantly increase both resale and rental value
- Both Bathroom renovation — Upgraded bathrooms are a major selling point for both buyers and renters
- Both Exterior paint and landscaping — A fresh coat of paint and well-maintained landscaping can enhance curb appeal and property value
- Both HVAC system upgrade — A new HVAC system can improve comfort and energy efficiency, attracting more buyers and renters
Renovation cost estimate screening
| Repair item | Severity | Est. cost |
|---|---|---|
| Kitchen · No photos of kitchen | Major | $15,000–50,000 |
| Bathrooms · No photos of bathrooms | Major | $15,000–50,000 |
| Roof · No photos of roof | Major | $15,000–50,000 |
| Exterior · No photos of exterior | Major | $15,000–50,000 |
| Flooring · No photos of flooring | Major | $15,000–50,000 |
| Interior walls/paint · No photos of interior walls/paint | Major | $15,000–50,000 |
| Windows · No photos of windows | Major | $15,000–50,000 |
| Foundation/structure · No photos of foundation/structure | Major | $15,000–50,000 |
| HVAC/mechanicals · No photos of HVAC/mechanicals | Major | $15,000–50,000 |
| Landscaping/curb appeal · No photos of landscaping/curb appeal | Major | $15,000–50,000 |
| Total estimated repair cost · 10 items | $150,000–500,000 |
Value-add ROI direction
- Both Kitchen renovation — A modern kitchen can significantly increase both resale and rental value ↑
- Both Bathroom renovation — Upgraded bathrooms are a major selling point for both buyers and renters ↑
- Both Exterior paint and landscaping — A fresh coat of paint and well-maintained landscaping can enhance curb appeal and property value ↑
- Both HVAC system upgrade — A new HVAC system can improve comfort and energy efficiency, attracting more buyers and renters ↑
ⓘ Cost ranges are severity-bucket heuristics (US national rule-of-thumb). Get contractor quotes + a written scope before underwriting a rehab budget.
Schools (NCES district)
- District
- Academy School District No. 20 In The County Of El Paso An
- NCES district ID
- 0801920
- Math proficiency
- 45% ▼ -5.00%
- Reading proficiency
- 65% ▲ 1.00%
- Median HH income
- $89,325
- Composite
- 50.62/100
- National rank
- #1840
- State rank
- #8 of 86 in CO
Livability — Colorado Springs
- Score
- 78/100
- State rank
- #23
- US rank
- #2639
Category grades
Schools grade is shown separately in the Schools card above.
Census & demographics
- Census place
- Colorado Springs, CO
- County
- El Paso County · 689,348 people
- City population
- 555,783
- Metro
- Colorado Springs, CO
- Population (ZIP)
- 19,619
- Household income
- $139,447
- Rent vs Own
- Severe rent burden
- 464.0
Population outlook (El Paso County) Hauer SSP2
- Today (2025)
- 768,926 people
- By 2030
- 815,739 · +6.1%
- By 2040
- 903,489 · +17.5%
- By 2050
- 981,204 · +27.6%
- By 2075
- 1,155,542 · +50.3%
- By 2100
- 1,202,070 · +56.3%
Race, ethnicity, and origin ACS 2023
- Neighborhood character
- Predominantly White (74%)
- Race & ethnicity
- White 74% Two or more races 10% Hispanic / Latino 9% Asian 5% Black 4%
- Hispanic origin (detail)
- Mexican 6%
- Common ancestry
- Italian 5% Slovak 3% Romanian 2%
- Foreign-born
- 8% · Canada, South Korea, China
- Languages at home
- 89% English-only · Other Indo-European 3% Spanish 3% German/W. Germanic 2%
Political lean MEDSL · El Paso
- 2024 margin
- Lean R (+9.8) · D 43.8% · R 53.5% · Other 2.7%
- 2008→2024 swing
- +9.0pp toward D · 2008: -18.8pp · 2024: -9.8pp
- All cycles
- 2024: R+9.8 2020: R+10.8 2016: R+22.6 2012: R+21.4 2008: R+18.8
Not yet ingested
- Civics
- —
Market trends
- HPI YoY
- ▼ -1.81%
- Current HPI
- 180.049
- Rent YoY
- ▼ -0.85%
- Metro
- Colorado Springs, CO
- State GDP YoY
- ▲ 1.95%
- F500 in state
- 14
Industry mix (Fortune 500 HQ in CO)
| Industry | F500 HQs | Revenue |
|---|---|---|
| Technology Distribution | 1 | $31B |
|
||
| Food / Agriculture | 1 | $18B |
|
||
| Packaging | 1 | $14B |
|
||
| Healthcare | 1 | $13B |
|
||
| Energy | 1 | $10B |
|
||
| Technology | 1 | $4B |
|
||
Price history
1 event — show timeline
- 2025-07-25 Listed $454,100 Zillow
Cash-flow waterfall
monthlySold comps — $/sqft
last 12 mo · ≤1 miLoading sold comps…