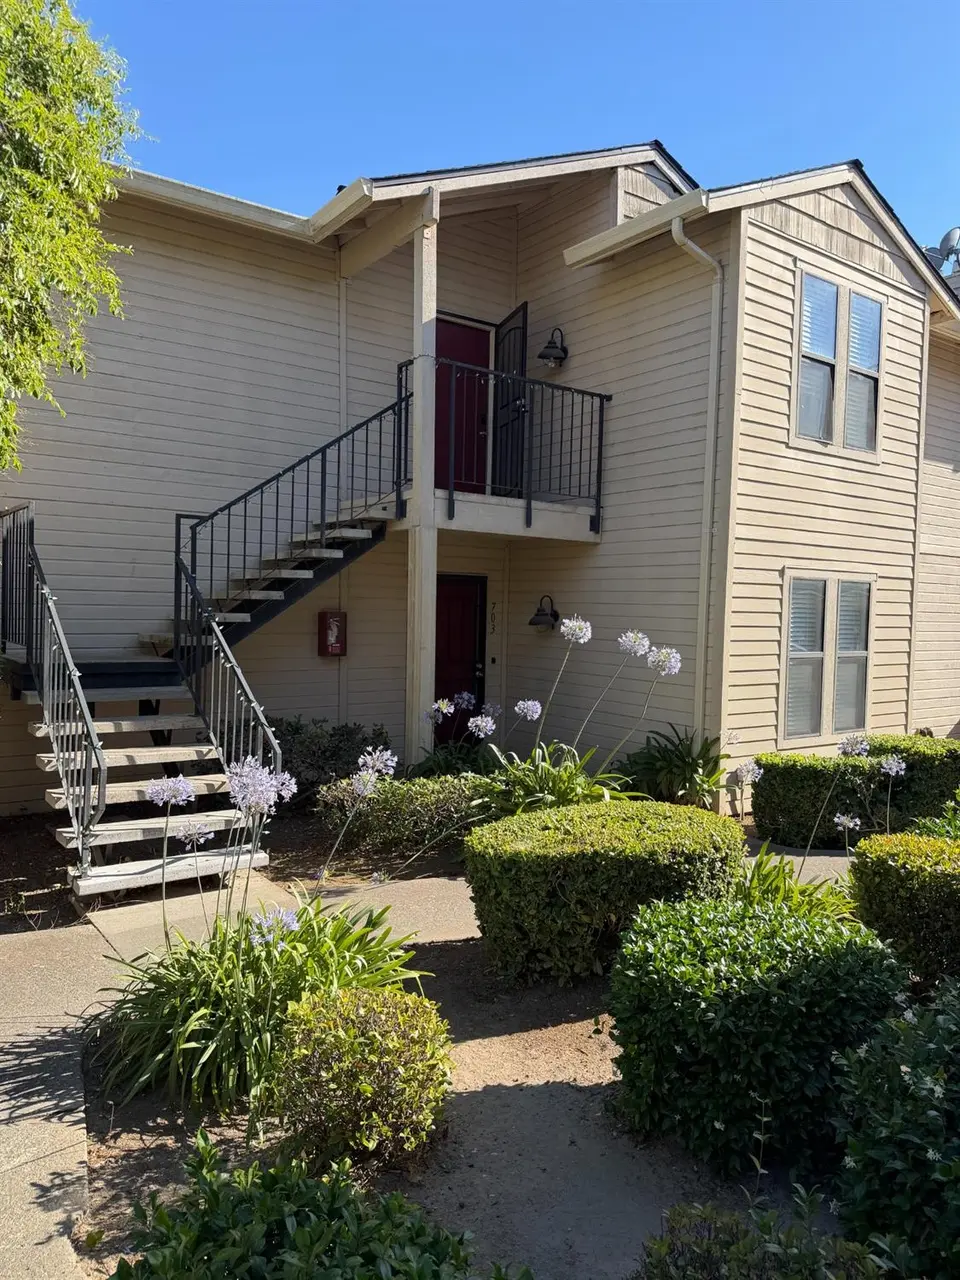
2401 Eilers Ln #703 · Lodi, CA
Flood risk 5/10 · Moderate
- FEMA flood zone
- X (shaded)
- Chance of flooding over 30 yrs
- 0.39%
- Est. flood insurance / yr
- $507 – $1,088
Fire risk 3/10 · Minor
- Est. fire insurance / yr
- $659 – $1,223
Heat risk 7/10 · Major
- Hot days now (above 101°F)
- 7 days/yr
- Hot days in 30 yrs
- 15 days/yr
Wind risk 1/10 · Minimal
- Chance of severe wind over 30 yrs
- —
Air-quality risk 10/10 · Severe
- Unhealthy air days now
- 27 days/yr
- Unhealthy air days in 30 yrs
- 29 days/yr
Risk factors via First Street. Map © Google.
Why this score? — see what drove the D grade
The composite is a weighted blend of 9 inputs, each scored 0–100. Each bar is that input's sub-score; the figure is the points it added to the 100-point composite (weight × sub-score).
- Cash flow +12.5/30.0
- ARV discount +7.5/15.0
- 1% rule +5.8/10.0
- DSCR +3.7/10.0
- Rent growth +3.6/5.0
- Livability +2.9/5.0
- Schools +2.7/10.0
- Condition / age +2.5/5.0
- Appreciation +0.0/10.0
$210,000
🖨 Deal sheet (PDF) 📄 Offer letter ✓ Due diligence
Listing remarks MLS
You're going to love this adorable very well kept downstairs condo. Kitchen has granite counters, electric range/oven and refrigerator, washer and dryer sty. Den, bonus room or p[possible second bedroom off kitchen. Remodeled bathroom, master bedroom has walk in closet and unit has a cute, cozy patio. Great location. You don't want to miss this!
Key facts
- Clubhouse
- Community pool
- Spa
Tags
Property features AI
Finance
- Other: Private pool and spa noted for the unit
- HOA & community: Mandatory association; Monthly association fee of $400; Community amenities include pool, clubhouse and dog park
Exterior
- Parking: 1-car garage; Garage faces the side
- Utilities: Public water; Public sewer; Irrigation from public district; Electric service details available (see remarks)
- Home design: Attached condominium (residential); Built in 1988; Entry level: main level; Not a senior community
- Construction: Tile roofing
- Exterior features: Tile roof; Close to clubhouse; Seasonal pond; Community pool and clubhouse access; Community spa (built-in hot tub)
Interior
- Kitchen: Counter with other/updated counter features
- Bedrooms: 1 bedroom (plus space that could be used as a second bedroom)
- Flooring: Flooring details available (see remarks)
- Bathrooms: 1 full bathroom
- Heating & cooling: Heating details available (see remarks); Cooling details available (see remarks)
- Interior features: One brick fireplace; Main level living with bedroom(s), living room, dining room and kitchen; Pets allowed; One story
- Laundry & utility: Laundry features available (see remarks)
Neighborhood map
What this means for you Summary
Snapshot
- This is a 1-bed/1.0-bath condo listed at $210k.
Deal economics
- At list price, monthly cash flow is $-32 ($-386/yr) — negative.
- To cash-flow at today's rent, offer at most $204k (2.7% below list).
- Meets the 1% rule at list price ($2k rent vs $210k).
- Recommended offer: $204k (2.7% below list) — sets the bar for cash-flow.
- Cap rate 6.1% vs local median 3.0% in Lodi — top-decile yield for the area; either an underpriced asset or a hidden risk that comps aren't pricing in. Stress-test before assuming the spread holds.
Location & tenants
- Location reads 58/100 on livability (#730 in CA) — a working-class tenant base; expect higher turnover. Strengths: housing A; Watch: schools C-, crime F, amenities F.
- Lodi Unified (urban): math 24% / reading 36% proficiency, ranked #325 of 517 in CA (top 63%) — families likely to look elsewhere, expect single-tenant / working-renter base with shorter leases.
- Market conditions: Rents rising fast (+4.2%/yr); 197 active listings in the ZIP; 3 comparable units currently listed for rent nearby; rentals at typical pace (median 15d on market — plan ~3-4 weeks tenant-placement turnaround); solid renter incomes; 3,779 units permitted in San Joaquin County in 2024 (0 in 5+ unit buildings).
Forward outlook
- Local home prices are declining (-3.0%/yr); year-one equity from $1k of loan paydown is wiped out by about $6k of value loss. Plan a longer hold.
- San Joaquin County population projected at +17% by 2050 — long-run rental-demand tailwind backs the buy-and-hold thesis.
Negotiation context
- Only 4 days on market — expect competitive offers; lowballing is unlikely to land.
Risks & watch-outs
- Climate carrying-cost: moderate flood risk; extreme-heat days projected 7→15/yr by 2055 (HVAC capex compounding) — expect insurance premiums to compound above CPI over the hold.
Questions for the listing agent
- What do current leases actually rent for vs. the listed asking? Can we see a recent rent roll and the last 12 months of T-12 income?
- What does the HOA fee cover, when was the last increase, and are there any pending special assessments or reserve-fund shortfalls?
- Any open or pending special assessments — roof, HVAC, plumbing, elevator, façade? What's the per-unit balance and payoff schedule, and is the seller paying it off at close or rolling it to the buyer?
- Is there a deadline driving the sale (1031 exchange, divorce, estate, relocation)? That informs how much negotiation room exists.
- Crime grade is F in this area — have there been break-ins, vandalism, or insurance claims at this property in the last 3 years? What carrier currently insures it and at what premium?
- The area grade is low — what's the realistic commute time and amenity access for the typical tenant pool here? Any planned neighborhood developments (good or bad) we should know about?
- What's the average days-on-market for RENTAL listings here right now (not sales)? A rising rental-DOM trend means longer vacancies and softer asking-rent achievability than the comps imply.
- What's the recent tenant-quality profile in this submarket — average credit score on applications, eviction rate, late-payment / NSF rate, and stable-employment percentage? A property-management company in the area should have these aggregated.
- How much new apartment / multifamily construction is in the pipeline within 1–3 miles? Heavy new supply (>2% of stock underway) typically softens rents 12–24 months out; light construction supports rent growth.
Investment metrics
- 1% rule
- 1.08% ✓
- Cap rate
- 6.11%
- Cash-on-cash
- -0.66%
- DSCR
- 0.97
- GRM
- 7.7
CMA / ARV
No comps found within radius.
Projected returns pro-forma
-3.0% appreciation · 4.24% rent growth · sell at horizon
- IRR
- -15.5%
- Equity multiple
- 0.44×
- Total profit
- $-32,961
- Equity at exit
- $31,312
- IRR
- -4.4%
- Equity multiple
- 0.69×
- Total profit
- $-18,260
- Equity at exit
- $18,157
Cash invested: $58,800 (down + closing). Projections, not guarantees.
Landlord ↔ Tenant lean methodology
- Overall (STATE)
- 18 Strongly Tenant-Friendly
- State California
- 18 Strongly Tenant-Friendly · D+13
- County
- — inherits STATE
- City
- — inherits STATE
ZIP-level market 95242
- Rents YoY
- 4.2%
- Active inventory
- 197
- Price-to-rent
- 7.7×
Monthly cashflow live
- Estimated rent
- $2,262 medium interval (Pro) →
- Mortgage (P&I)
- −$1,101
- Tax from tax record
- −$230 /mo · $2,766/yr
- Insurance
- −$88
- HOA
- −$400
- Vacancy / Maint / Mgmt
- −$475
- Net cashflow
- $-32
Break-even live
Sensitivity live
| Price | -10% $87 | -5% $27 | +0% $-32 | +5% $-92 | +10% $-151 |
|---|---|---|---|---|---|
| Rent | -10% $-211 | -5% $-122 | +0% $-32 | +5% $57 | +10% $147 |
| Rate | -1.0pp $74 | -0.5pp $21 | base $-32 | +0.5pp $-87 | +1.0pp $-142 |
UW: 25.0% down · 7.5% · 30yr · 1.5% tax · 5.0% vac · 8.0% maint · 8.0% mgmt
Financing live
Cash to close
- Down payment
- $52,500
- Closing costs
- $6,300
- Reserves months
- —
- Total cash needed
- —
Loan-product check · same deal, 3 products live
Conventional
25% down · 7.5% · 30yr
- Down + closing
- —
- Monthly P&I
- —
- Monthly cashflow
- —
- DSCR
- —
- Eligible?
- —
Personal DTI + credit; lowest rate.
DSCR
20% down · 8.5% · 30yr
- Down + closing
- —
- Monthly P&I
- —
- Monthly cashflow
- —
- DSCR
- —
- Eligible?
- —
No personal income docs; deal must DSCR.
Hard money
10% down · 12.0% · 12mo
- Down + closing
- —
- Monthly P&I
- —
- Monthly cashflow
- —
- DSCR
- —
- Eligible?
- —
Short-term bridge; refi at stabilization.
Rent comps 3 comps
| Address | Beds | Baths | Sqft | Rent | $/sqft | DOM | Units | Dist |
|---|---|---|---|---|---|---|---|---|
| 1279 Woodhaven Ln Unit 201 Lodi, CA | 1.0 | 1.0 | 850 | $2,750 | $3.24 | 44d | 1 | 0.11mi |
| 820 N Lower Sacramento Rd Lodi, CA | 2.0 | 1.0 | 950 | $1,695 | $1.78 | 2d | 1 | 0.39mi |
| 1800 Lake St Lodi, CA | 2.0 | 1.0 | 966 | $1,795 | $1.86 | 15d | 1 | 0.78mi |
HOA detail condo
- Monthly dues
- $400 · $4,800/yr
- Likely covers
- electric
- Assessments
- None detected in remarks — confirm with the listing agent.
Listing history 5 events
-
2026-06-18days on market $210,000 Active 4 DOM
-
2026-06-17days on market $210,000 Active 3 DOM
-
2026-06-16days on market $210,000 Active 2 DOM
-
2026-06-15remarks 699-char remark
-
2026-06-15$210,000 Active 1 DOM
ⓘ Source: listings_history table (triggers on properties + properties_extension) + one-shot
backfill from property_details.listing_events for pre-trigger history.
Tax reassessment forecast CA · Resets to sale price
- Current annual tax
- $2,766 · $230/mo
- Projected year-2 tax
- $2,766 · $230/mo
- Expected delta
- $0/yr ($0/mo · 0.0%)
ⓘ Screening estimate from a state-policy table — verify with the county assessor before closing.
Climate risk First Street
- Flood 5/10 Major FEMA zone X (shaded) · 39% chance over 30 yrs
- Wildfire 3/10 Moderate
- Heat 7/10 Severe 7 d/yr ≥101°F today · 15 d/yr by 30 yrs out
- Wind 1/10 Low
- Air quality 10/10 Extreme 27 unhealthy d/yr today · 29 by 30 yrs out
Nearby sold comps map
Loading sold comps map…
Walkable amenities ~0.75 mi
Loading nearby amenities…
Taxation est. · year 1
- Rental income
- $27,145
- − Mortgage interest
- −$11,763
- − Property taxes
- −$2,766
- − Insurance
- −$1,050
- − Repairs & maintenance
- −$2,172
- − Management
- −$2,172
- − HOA
- −$4,800
- − Depreciation
- −$6,109
- Taxable loss
- −$3,686
- Est. tax savings @ 24.0%
- +$885
- After-tax cash flow
- $498/yr
For passive investors: Depreciation is non-cash, so a rental often shows a tax loss while cash-flowing — sheltering income. Rental losses are passive: they offset passive income freely, and up to $25,000/yr can offset ordinary (W-2) income if you actively participate and your MAGI is under $100k (phasing out to $0 by $150k); unused losses carry forward. On sale, claimed depreciation is recaptured at up to 25%, and gains may owe capital-gains tax (a 1031 exchange can defer both). Figures are a year-1 estimate at your 24.0% rate — not tax advice; consult a CPA.
Schools (NCES district)
- District
- Lodi Unified
- NCES district ID
- 0622230
- Math proficiency
- 24% ▼ -8.00%
- Reading proficiency
- 36% ▼ -8.00%
- Median HH income
- $57,165
- Composite
- 26.84/100
- National rank
- #7108
- State rank
- #325 of 517 in CA
Livability — Lodi
- Score
- 58/100
- State rank
- #730
- US rank
- #21523
Category grades
Schools grade is shown separately in the Schools card above.
Census & demographics
- Census place
- Lodi, CA
- County
- San Joaquin County · 729,570 people
- City population
- 78,944
- Metro
- Stockton, CA
- Population (ZIP)
- 28,427
- Household income
- $104,721
- Rent vs Own
- Severe rent burden
- 778.0
Population outlook (San Joaquin County) Hauer SSP2
- Today (2025)
- 796,965 people
- By 2030
- 828,849 · +4.0%
- By 2040
- 885,611 · +11.1%
- By 2050
- 929,798 · +16.7%
- By 2075
- 994,578 · +24.8%
- By 2100
- 971,291 · +21.9%
Race, ethnicity, and origin ACS 2023
- Neighborhood character
- Majority White (62%)
- Race & ethnicity
- White 62% Hispanic / Latino 26% Two or more races 17% Asian 7% Black 1%
- Hispanic origin (detail)
- Mexican 22%
- Common ancestry
- Italian 3% Lithuanian 2% Romanian 2%
- Foreign-born
- 11% · Canada, China, Dominican Republic
- Languages at home
- 79% English-only · Spanish 13% Other Indo-European 3% Arabic 1%
Political lean MEDSL · San Joaquin
- 2024 margin
- Toss-up / Even · D 48.0% · R 48.9% · Other 3.0%
- 2008→2024 swing
- -11.6pp toward R · 2008: 10.7pp · 2024: -0.9pp
- All cycles
- 2024: R+0.9 2020: D+13.9 2016: D+12.9 2012: D+8.9 2008: D+10.7
Not yet ingested
- Civics
- —
Market trends
- HPI YoY
- ▼ -488.67%
- Current HPI
- 265.9974
- Rent YoY
- ▲ 4.24%
- Metro
- Stockton, CA
- State GDP YoY
- ▲ 3.21%
- F500 in state
- 116
Industry mix (Fortune 500 HQ in CA)
| Industry | F500 HQs | Revenue |
|---|---|---|
| Technology | 27 | $1,492B |
|
||
| Financial Services | 3 | $174B |
|
||
| Retail | 3 | $44B |
|
||
| Insurance | 3 | $26B |
|
||
| Media / Entertainment | 2 | $115B |
|
||
| Pharmaceuticals / Biotech | 2 | $62B |
|
||
Price history
+97.5% since first listed5 events — show timeline
- 2021-05-27 Sold (Public Records) $235,000 Public Records
- 2021-05-27 Sold (MLS) $235,000 MLSListings
- 2021-05-06 Pending — MLSListings
- 2021-05-03 Listed $230,000 MLSListings
- 2014-12-12 Sold (Public Records) $119,000 Public Records
Property tax history
+4.1%/yrLatest (2025): $2,766 · +2.9% YoY. Source: county tax records.
Cash-flow waterfall
monthlySold comps — $/sqft
last 12 mo · ≤1 miLoading sold comps…