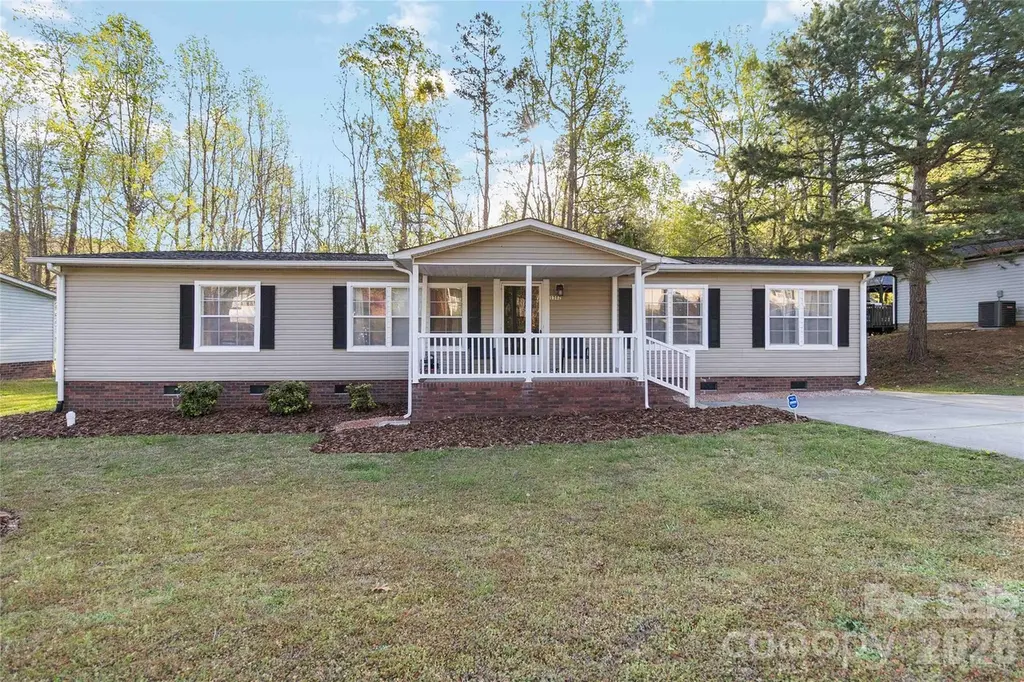
1362 Poplar Glen Dr · Kannapolis, NC
Flood risk 1/10 · Minimal
- FEMA flood zone
- X (unshaded)
- Chance of flooding over 30 yrs
- 0.0%
- Est. flood insurance / yr
- $507 – $1,088
Fire risk 3/10 · Minor
- Est. fire insurance / yr
- $906 – $1,684
Heat risk 5/10 · Moderate
- Hot days now (above 105°F)
- 7 days/yr
- Hot days in 30 yrs
- 17 days/yr
Wind risk 4/10 · Minor
- Chance of severe wind over 30 yrs
- 16.0%
Air-quality risk 2/10 · Minimal
- Unhealthy air days now
- 1 days/yr
- Unhealthy air days in 30 yrs
- 3 days/yr
Risk factors via First Street. Map © Google.
Why this score? — see what drove the D grade
The composite is a weighted blend of 9 inputs, each scored 0–100. Each bar is that input's sub-score; the figure is the points it added to the 100-point composite (weight × sub-score).
- Cash flow +14.8/30.0
- ARV discount +7.5/15.0
- DSCR +4.5/10.0
- Livability +3.2/5.0
- 1% rule +3.1/10.0
- Rent growth +3.0/5.0
- Schools +2.6/10.0
- Condition / age +2.5/5.0
- Appreciation +0.0/10.0
$245,000
🖨 Deal sheet (PDF) 📄 Offer letter ✓ Due diligence
Listing remarks MLS
Just updated and move in ready 3 bedroom, 2 bath home in great Kannapolis location. Quiet, private street conveniently located near I-85. Great floor plan! Features include quartz countertops in kitchen and bathrooms, new vinyl plank floors (no carpet), and fresh paint throughout. Primary bath includes a separate tub, walk in shower and double sinks. Large walk-in closet in the primary bedroom. There is a front porch, plus a covered deck for grilling out and relaxing. HVAC and water heater were replaced within the last 4-5 years and there is a brand new roof!
Key facts
- 0.23 acre lot
- Built 2001
- Listed 14 days
Neighborhood map
What this means for you Summary
Snapshot
- This is a 3-bed/2.0-bath manufactured listed at $245k.
Deal economics
- At list price, monthly cash flow is $69 ($825/yr) — positive.
- The deal already cash-flows at list — no discount required.
- To meet the 1% rule (rent ≥ 1% of price), the offer needs to be $199k (18.6% below list).
- Recommended offer: $199k (18.6% below list) — sets the bar for 1% rule.
- Cap rate 6.6% vs local median 3.5% in Kannapolis — top-decile yield for the area; either an underpriced asset or a hidden risk that comps aren't pricing in. Stress-test before assuming the spread holds.
Location & tenants
- Location reads 64/100 on livability (#354 in NC) — a middle-class / working-renter tenant base. Strengths: cost of living A+, housing A+, crime B; Watch: employment D+, amenities F, commute F.
- Kannapolis City Schools (suburban): math 30% / reading 33% proficiency, ranked #141 of 178 in NC (top 79%) — families likely to look elsewhere, expect single-tenant / working-renter base with shorter leases; 63% free/reduced lunch — lower-income household profile, screen leases tightly.
- Zoned schools: Jackson Park Elementary (math 50% / reading 41%, grade D-, #562 of 1,410 statewide, top 40%, 416 students, 99% FRL); Kannapolis Middle (math 30% / reading 35%, grade F, #312 of 475 statewide, top 66%, 1,238 students, 100% FRL); A L Brown High (math 25% / reading 30%, grade F, #467 of 535 statewide, top 87%, 1,741 students, 100% FRL) — zoned schools average 100% FRL vs 63% district-wide (36 pts higher); higher-poverty schools than district average — tighter screening recommended.
- Market conditions: Rents rising (+2.1%/yr); 144 active listings in the ZIP; 8 comparable units currently listed for rent nearby; rentals leasing fast (median 13d on market — plan ~1-2 weeks tenant-placement turnaround); 592 units permitted in Rowan County in 2024 (5 in 5+ unit buildings).
- This rent runs 36% of the median local income ($66k/yr) — at the standard rent-burdened threshold; future hikes will face affordability resistance.
Forward outlook
- Local home prices are declining (-3.0%/yr); year-one equity from $2k of loan paydown is wiped out by about $7k of value loss. Plan a longer hold.
- Rowan County population projected to shrink 6% by 2050 — rents likely to lag national; underwrite the cash flow, not the appreciation.
Negotiation context
- Only 14 days on market — expect competitive offers; lowballing is unlikely to land.
- 2 sale attempts since 3y ago with the ask held roughly flat each time — persistent listings suggest the price (not the market) is what's stuck; bring a comps-based counter.
Risks & watch-outs
- Climate carrying-cost: extreme-heat days projected 7→17/yr by 2055 (HVAC capex compounding) — expect insurance premiums to compound above CPI over the hold.
Questions for the listing agent
- Is there a deadline driving the sale (1031 exchange, divorce, estate, relocation)? That informs how much negotiation room exists.
- Schools are F-rated, which usually means shorter tenancies and higher turnover. Who's the typical renter profile here, and what's been the actual vacancy rate?
- The area grade is low — what's the realistic commute time and amenity access for the typical tenant pool here? Any planned neighborhood developments (good or bad) we should know about?
- What's the average days-on-market for RENTAL listings here right now (not sales)? A rising rental-DOM trend means longer vacancies and softer asking-rent achievability than the comps imply.
- What's the recent tenant-quality profile in this submarket — average credit score on applications, eviction rate, late-payment / NSF rate, and stable-employment percentage? A property-management company in the area should have these aggregated.
- How much new for-sale + rental construction is in the pipeline within 1–3 miles? Heavy new supply typically softens prices + rents 12–24 months out; constrained supply supports both.
Investment metrics
- 1% rule
- 0.81% ✗
- Cap rate
- 6.63%
- Cash-on-cash
- 1.20%
- DSCR
- 1.05
- GRM
- 10.2
CMA / ARV
No comps found within radius.
Projected returns pro-forma
-3.0% appreciation · 2.15% rent growth · sell at horizon
- IRR
- -15.3%
- Equity multiple
- 0.46×
- Total profit
- $-37,095
- Equity at exit
- $36,530
- IRR
- -8.2%
- Equity multiple
- 0.51×
- Total profit
- $-33,825
- Equity at exit
- $21,183
Cash invested: $68,600 (down + closing). Projections, not guarantees.
Landlord ↔ Tenant lean methodology
- Overall (STATE)
- 85 Strongly Landlord-Friendly
- State North Carolina
- 85 Strongly Landlord-Friendly · R+3
- County
- — inherits STATE
- City
- — inherits STATE
ZIP-level market 28083
- Rents YoY
- 2.1%
- Active inventory
- 144
- Price-to-rent
- 10.2×
Monthly cashflow live
- Estimated rent
- $1,994 high interval (Pro) →
- Mortgage (P&I)
- −$1,285
- Tax from tax record
- −$120 /mo · $1,435/yr
- Insurance
- −$102
- HOA
- −$0
- Vacancy / Maint / Mgmt
- −$419
- Net cashflow
- $69
Break-even live
Sensitivity live
| Price | -10% $207 | -5% $138 | +0% $69 | +5% $-1 | +10% $-70 |
|---|---|---|---|---|---|
| Rent | -10% $-89 | -5% $-10 | +0% $69 | +5% $148 | +10% $226 |
| Rate | -1.0pp $192 | -0.5pp $131 | base $69 | +0.5pp $5 | +1.0pp $-59 |
UW: 25.0% down · 7.5% · 30yr · 1.5% tax · 5.0% vac · 8.0% maint · 8.0% mgmt
Financing live
Cash to close
- Down payment
- $61,250
- Closing costs
- $7,350
- Reserves months
- —
- Total cash needed
- —
Loan-product check · same deal, 3 products live
Conventional
25% down · 7.5% · 30yr
- Down + closing
- —
- Monthly P&I
- —
- Monthly cashflow
- —
- DSCR
- —
- Eligible?
- —
Personal DTI + credit; lowest rate.
DSCR
20% down · 8.5% · 30yr
- Down + closing
- —
- Monthly P&I
- —
- Monthly cashflow
- —
- DSCR
- —
- Eligible?
- —
No personal income docs; deal must DSCR.
Hard money
10% down · 12.0% · 12mo
- Down + closing
- —
- Monthly P&I
- —
- Monthly cashflow
- —
- DSCR
- —
- Eligible?
- —
Short-term bridge; refi at stabilization.
Rent comps 8 comps
| Address | Beds | Baths | Sqft | Rent | $/sqft | DOM | Units | Dist |
|---|---|---|---|---|---|---|---|---|
| 2220 Moose Rd Kannapolis, NC | 3.0 | 2.5 | 1864 | $2,290 | $1.23 | 12d | 1 | 0.65mi |
| 1855 Lane St Kannapolis, NC | 3.0 | 2.0 | 1430 | $1,895 | $1.33 | 23d | 1 | 0.74mi |
| 1024 E 10th St Kannapolis, NC | 3.0 | 1.5 | 1030 | $1,595 | $1.55 | 6d | 1 | 0.79mi |
| 1614 Barbara Ann Cir Kannapolis, NC | 3.0 | 2.0 | 1509 | $1,899 | $1.26 | 18d | 1 | 1.18mi |
| 614 Forest Ridge Rd Kannapolis, NC | 3.0 | 2.0 | 1483 | $2,085 | $1.41 | 0d | 1 | 1.22mi |
| 2031 Samantha Dr Kannapolis, NC | 3.0 | 2.0 | 1300 | $1,725 | $1.33 | 12d | 1 | 1.23mi |
| 500 Jackson Park Rd Unit 12 Kannapolis, NC | 2.0 | 1.5 | 925 | $1,305 | $1.41 | 16d | 1 | 1.29mi |
| 368 W 18th St Kannapolis, NC | 3.0 | 2.0 | 1399 | $1,995 | $1.43 | 6d | 1 | 1.37mi |
Listing history 7 events
-
2026-04-22status Pending
-
2026-04-09$245,000 Active
-
2026-03-19historical $245,000
-
2023-05-11soldstatus $222,000
-
2023-05-10soldstatus $222,000 Closed 567-char remark
Show marketing remark (567 chars)
Just updated and move in ready 3 bedroom, 2 bath home in great Kannapolis location. Quiet, private street conveniently located near I-85. Great floor plan! Features include quartz countertops in kitchen and bathrooms, new vinyl plank floors (no carpet), and fresh paint throughout. Primary bath includes a separate tub, walk in shower and double sinks. Large walk-in closet in the primary bedroom. There is a front porch, plus a covered deck for grilling out and relaxing. HVAC and water heater were replaced within the last 4-5 years and there is a brand new roof!
-
2023-02-21historical Active Under Contract 567-char remark
Show marketing remark (567 chars)
Just updated and move in ready 3 bedroom, 2 bath home in great Kannapolis location. Quiet, private street conveniently located near I-85. Great floor plan! Features include quartz countertops in kitchen and bathrooms, new vinyl plank floors (no carpet), and fresh paint throughout. Primary bath includes a separate tub, walk in shower and double sinks. Large walk-in closet in the primary bedroom. There is a front porch, plus a covered deck for grilling out and relaxing. HVAC and water heater were replaced within the last 4-5 years and there is a brand new roof!
-
2023-02-14$235,000 Active 567-char remark
Show marketing remark (567 chars)
Just updated and move in ready 3 bedroom, 2 bath home in great Kannapolis location. Quiet, private street conveniently located near I-85. Great floor plan! Features include quartz countertops in kitchen and bathrooms, new vinyl plank floors (no carpet), and fresh paint throughout. Primary bath includes a separate tub, walk in shower and double sinks. Large walk-in closet in the primary bedroom. There is a front porch, plus a covered deck for grilling out and relaxing. HVAC and water heater were replaced within the last 4-5 years and there is a brand new roof!
ⓘ Source: listings_history table (triggers on properties + properties_extension) + one-shot
backfill from property_details.listing_events for pre-trigger history.
Tax reassessment forecast NC · Resets to sale price
- Current annual tax
- $1,435 · $120/mo
- Projected year-2 tax
- $2,009 · $167/mo
- Expected delta
- +$574/yr (+$48/mo · 40.0%)
ⓘ Screening estimate from a state-policy table — verify with the county assessor before closing.
Climate risk First Street
- Flood 1/10 Low FEMA zone X (unshaded) · 0% chance over 30 yrs
- Wildfire 3/10 Moderate
- Heat 5/10 Major 7 d/yr ≥105°F today · 17 d/yr by 30 yrs out
- Wind 4/10 Moderate 16% chance of damaging wind over 30 yrs
- Air quality 2/10 Low 1 unhealthy d/yr today · 3 by 30 yrs out
Nearby sold comps map
Loading sold comps map…
Walkable amenities ~0.75 mi
Loading nearby amenities…
Taxation est. · year 1
- Rental income
- $23,928
- − Mortgage interest
- −$13,724
- − Property taxes
- −$1,435
- − Insurance
- −$1,225
- − Repairs & maintenance
- −$1,914
- − Management
- −$1,914
- − Depreciation
- −$7,127
- Taxable loss
- −$3,412
- Est. tax savings @ 24.0%
- +$819
- After-tax cash flow
- $1,644/yr
For passive investors: Depreciation is non-cash, so a rental often shows a tax loss while cash-flowing — sheltering income. Rental losses are passive: they offset passive income freely, and up to $25,000/yr can offset ordinary (W-2) income if you actively participate and your MAGI is under $100k (phasing out to $0 by $150k); unused losses carry forward. On sale, claimed depreciation is recaptured at up to 25%, and gains may owe capital-gains tax (a 1031 exchange can defer both). Figures are a year-1 estimate at your 24.0% rate — not tax advice; consult a CPA.
Schools (NCES district)
- District
- Kannapolis City Schools
- NCES district ID
- 3702430
- Math proficiency
- 30% ▲ 7.00%
- Reading proficiency
- 33% ▼ -2.00%
- Median HH income
- $38,534
- Composite
- 26.34/100
- National rank
- #7237
- State rank
- #141 of 178 in NC
Livability — Kannapolis
- Score
- 64/100
- State rank
- #354
- US rank
- #14030
Category grades
Schools grade is shown separately in the Schools card above.
Census & demographics
- Census place
- Kannapolis, NC
- County
- Cabarrus County · 218,793 people
- City population
- 57,170
- Metro
- Charlotte-Concord-Gastonia, NC-SC
- Population (ZIP)
- 28,095
- Household income
- $66,257
- Rent vs Own
- Severe rent burden
- 633.0
Population outlook (Rowan County) Hauer SSP2
- Today (2025)
- 140,430 people
- By 2030
- 140,193 · -0.2%
- By 2040
- 137,617 · -2.0%
- By 2050
- 131,826 · -6.1%
- By 2075
- 115,123 · -18.0%
- By 2100
- 92,774 · -33.9%
Race, ethnicity, and origin ACS 2023
- Neighborhood character
- Diverse neighborhood (Simpson 0.61)
- Race & ethnicity
- White 55% Black 25% Hispanic / Latino 16% Two or more races 5% Asian 1%
- Hispanic origin (detail)
- Mexican 11% Puerto Rican 3%
- Common ancestry
- Slovak 2% Serbian 1% Lithuanian 1%
- Foreign-born
- 8% · Canada
- Languages at home
- 85% English-only · Spanish 13% Tagalog/Filipino 1% Other Indo-European 1%
Political lean MEDSL · Rowan
- 2024 margin
- Solid R (+35.9) · D 31.6% · R 67.5%
- 2008→2024 swing
- -13.1pp toward R · 2008: -22.8pp · 2024: -35.9pp
- All cycles
- 2024: R+35.9 2020: R+35.7 2016: R+36.8 2012: R+26.0 2008: R+22.8
Not yet ingested
- Civics
- —
Market trends
- HPI YoY
- ▼ -318.30%
- Current HPI
- 307.0675
- Rent YoY
- ▲ 2.15%
- Metro
- Charlotte-Concord-Gastonia, NC-SC
- State GDP YoY
- ▲ 3.28%
- F500 in state
- 26
Industry mix (Fortune 500 HQ in NC)
| Industry | F500 HQs | Revenue |
|---|---|---|
| Financial Services | 2 | $213B |
|
||
| Retail | 2 | $95B |
|
||
| Industrial Conglomerate | 1 | $38B |
|
||
| Metals / Steel | 1 | $35B |
|
||
| Utilities | 1 | $30B |
|
||
| Industrial Machinery | 1 | $19B |
|
||
Price history
+4.3% since first listed7 events — show timeline
- 2026-04-22 Pending — CANOPYMLS as Distributed by MLS Grid
- 2026-04-09 Listed $245,000 CANOPYMLS as Distributed by MLS Grid
- 2026-03-19 Coming Soon $245,000 CANOPYMLS as Distributed by MLS Grid
- 2023-05-11 Sold (Public Records) $222,000 Public Records
- 2023-05-10 Sold (MLS) $222,000 CANOPYMLS as Distributed by MLS Grid
- 2023-02-21 Contingent — CANOPYMLS as Distributed by MLS Grid
- 2023-02-14 Listed $235,000 CANOPYMLS as Distributed by MLS Grid
Property tax history
+2.8%/yrLatest (2025): $1,435 · +0.0% YoY. Source: county tax records.
Cash-flow waterfall
monthlySold comps — $/sqft
last 12 mo · ≤1 miLoading sold comps…