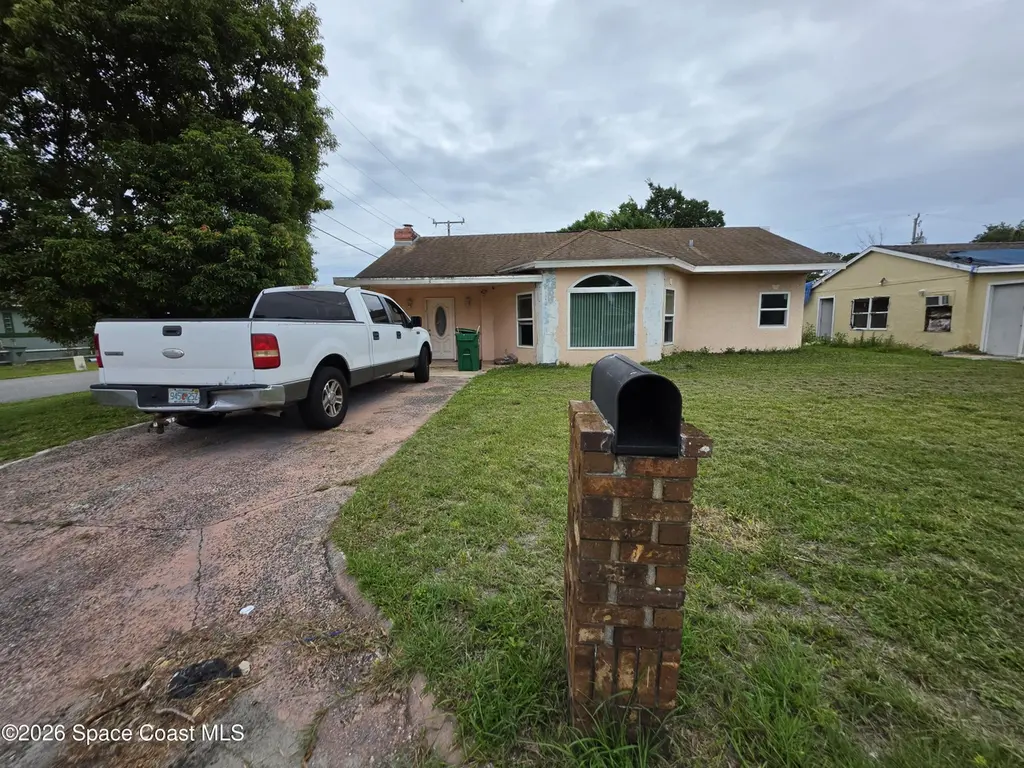
417 A Ln · Cocoa West, FL
Flood risk 1/10 · Minimal
- FEMA flood zone
- X (unshaded)
- Chance of flooding over 30 yrs
- 0.0%
- Est. flood insurance / yr
- $507 – $1,088
Fire risk 4/10 · Minor
- Est. fire insurance / yr
- $947 – $1,759
Heat risk 10/10 · Severe
- Hot days now (above 106°F)
- 7 days/yr
- Hot days in 30 yrs
- 24 days/yr
Wind risk 10/10 · Severe
- Chance of severe wind over 30 yrs
- 99.0%
Air-quality risk 1/10 · Minimal
- Unhealthy air days now
- 0 days/yr
- Unhealthy air days in 30 yrs
- 0 days/yr
Risk factors via First Street. Map © Google.
Why this score? — see what drove the C- grade
The composite is a weighted blend of 9 inputs, each scored 0–100. Each bar is that input's sub-score; the figure is the points it added to the 100-point composite (weight × sub-score).
- Cash flow +18.7/30.0
- ARV discount +7.5/15.0
- DSCR +5.9/10.0
- Schools +4.7/10.0
- 1% rule +4.0/10.0
- Rent growth +3.9/5.0
- Livability +3.5/5.0
- Condition / age +2.5/5.0
- Appreciation +0.0/10.0
$229,000
🖨 Deal sheet 📄 Offer letter ✓ Due diligence
Listing remarks
Welcome to this well-maintained 3-bedroom, 2-bathroom property in Waukegan! Spanning approximately 1806 sq. ft. upstairs, this residence features updated kitchen and bathrooms, plus windows installed 5?6 years ago. The finished basement expands your living space with an additional bedroom and bathroom. Situated on a spacious corner lot, the exterior offers a great front and side yard alongside a functional garage. Equipped with a furnace heating system, window cooling units, a 10-year-old roof, and an 8-year-old water heater. Ready for your personal flooring choices!
Key facts
- 6,098 sq ft lot
- 2 garage spots
- Built 1960
Property features AI
Finance
- Other: No private pool; Unfurnished; Approximate living area listed (value provided but sq. ft. excluded per instructions)
Exterior
- Parking: Attached garage; 2-car garage
- Utilities: Public sewer; Sewer connected
- Home design: Single family residence; Current use: Residential, Single Family
- Construction: Stucco exterior
- Exterior features: Lot identified as Other; Lot size about 0.14 acres; Property faces south
Interior
- Kitchen: Kitchen (main level; approximate dimensions 10 x 9)
- Bedrooms: Three bedrooms (levels not specified)
- Bathrooms: Two full bathrooms
- Heating & cooling: Central heating (electric); Central air conditioning (electric)
- Interior features: One room listed (other interior room details not provided)
- Laundry & utility: Unfurnished (no specific laundry appliances listed)
Neighborhood map
What this means for you Summary
Snapshot
- This is a 3-bed/2.0-bath single-family listed at $229k.
Deal economics
- At list price, monthly cash flow is $228 ($3k/yr) — positive.
- The deal already cash-flows at list — no discount required.
- To meet the 1% rule (rent ≥ 1% of price), the offer needs to be $206k (10.1% below list).
- Recommended offer: $206k (10.1% below list) — sets the bar for 1% rule.
Location & tenants
- Location reads 69/100 on livability (#481 in FL) — a middle-class / working-renter tenant base. Strengths: cost of living A+, housing A+, health & safety A; Watch: amenities F, commute F, employment F.
- Brevard (suburban): math 53% / reading 57% proficiency, ranked #19 of 73 in FL (top 26%) — acceptable for families but not a draw, mixed tenant base, ~2y average lease.
- Zoned schools: Saturn Elementary School (math 23% / reading 29%, grade F, #2,015 of 2,144 statewide, top 94%, 643 students, 81% FRL); Ronald Mcnair Magnet Middle School (math 58% / reading 50%, grade B-, #196 of 571 statewide, top 36%, 364 students, 58% FRL); Rockledge Senior High School (math 27% / reading 49%, grade F, #328 of 667 statewide, top 50%, 1,558 students, 50% FRL) — zoned schools average 63% FRL vs 43% district-wide (20 pts higher); higher-poverty schools than district average — tighter screening recommended.
- Zoned-school proficiency averages 39% at this address vs 55% district-wide (-16 pts) — the specific schools serving this property underperform the Brevard average; the district grade overstates school quality for this exact location.
- Market conditions: Rents rising fast (+5.6%/yr); 291 active listings in the ZIP; 3 comparable units currently listed for rent nearby; rentals at typical pace (median 23d on market — plan ~3-4 weeks tenant-placement turnaround); 4,602 units permitted in Brevard County in 2024 (702 in 5+ unit buildings).
- This rent runs 35% of the median local income ($71k/yr) — at the standard rent-burdened threshold; future hikes will face affordability resistance.
Forward outlook
- Local home prices are declining (-3.0%/yr); year-one equity from $2k of loan paydown is wiped out by about $7k of value loss. Plan a longer hold.
- Brevard County population projected at +15% by 2050 — modest demand growth; plan on rents tracking national, not racing it.
Negotiation context
- Only 12 days on market — expect competitive offers; lowballing is unlikely to land.
Risks & watch-outs
- Climate carrying-cost: severe wind risk, 99% chance of damaging wind over 30y; extreme-heat days projected 7→24/yr by 2055 (HVAC capex compounding) — expect insurance premiums to compound above CPI over the hold.
Questions for the listing agent
- Built in 1960 — when were the roof, HVAC, electrical panel, plumbing, and water heater last replaced?
- Is there a deadline driving the sale (1031 exchange, divorce, estate, relocation)? That informs how much negotiation room exists.
- Schools are F-rated, which usually means shorter tenancies and higher turnover. Who's the typical renter profile here, and what's been the actual vacancy rate?
- What's the average days-on-market for RENTAL listings here right now (not sales)? A rising rental-DOM trend means longer vacancies and softer asking-rent achievability than the comps imply.
- What's the recent tenant-quality profile in this submarket — average credit score on applications, eviction rate, late-payment / NSF rate, and stable-employment percentage? A property-management company in the area should have these aggregated.
- How much new for-sale + rental construction is in the pipeline within 1–3 miles? Heavy new supply typically softens prices + rents 12–24 months out; constrained supply supports both.
Investment metrics
- 1% rule
- 0.90% ✗
- Cap rate
- 7.49%
- Cash-on-cash
- 4.27%
- DSCR
- 1.19
- GRM
- 9.3
CMA / ARV
No comps found within radius.
Projected returns pro-forma
-3.0% appreciation · 5.6% rent growth · sell at horizon
- IRR
- -7.1%
- Equity multiple
- 0.73×
- Total profit
- $-17,136
- Equity at exit
- $34,145
- IRR
- 5.2%
- Equity multiple
- 1.43×
- Total profit
- $27,378
- Equity at exit
- $19,800
Cash invested: $64,120 (down + closing). Projections, not guarantees.
Landlord ↔ Tenant lean methodology
- Overall (STATE)
- 87 Strongly Landlord-Friendly
- State Florida
- 87 Strongly Landlord-Friendly · R+3
- County
- — inherits STATE
- City
- — inherits STATE
ZIP-level market 32926
- Home prices YoY
- -16.9%
- Rents YoY
- 5.6%
- Active inventory
- 291
- Price-to-rent
- 9.3×
Monthly cashflow live
- Estimated rent
- $2,060 medium interval (Pro) →
- Mortgage (P&I)
- −$1,201
- Tax from tax record
- −$103 /mo · $1,235/yr
- Insurance
- −$95
- HOA
- −$0
- Vacancy / Maint / Mgmt
- −$433
- Net cashflow
- $228
Break-even live
UW: 25.0% down · 7.5% · 30yr · 1.5% tax · 5.0% vac · 8.0% maint · 8.0% mgmt
Financing live
Cash to close
- Down payment
- $57,250
- Closing costs
- $6,870
- Reserves months
- —
- Total cash needed
- —
Loan-product check · same deal, 3 products live
Conventional
25% down · 7.5% · 30yr
- Down + closing
- —
- Monthly P&I
- —
- Monthly cashflow
- —
- DSCR
- —
- Eligible?
- —
Personal DTI + credit; lowest rate.
DSCR
20% down · 8.5% · 30yr
- Down + closing
- —
- Monthly P&I
- —
- Monthly cashflow
- —
- DSCR
- —
- Eligible?
- —
No personal income docs; deal must DSCR.
Hard money
10% down · 12.0% · 12mo
- Down + closing
- —
- Monthly P&I
- —
- Monthly cashflow
- —
- DSCR
- —
- Eligible?
- —
Short-term bridge; refi at stabilization.
Rent comps 3 comps
| Address | Beds | Baths | Sqft | Rent | $/sqft | DOM | Units | Dist |
|---|---|---|---|---|---|---|---|---|
| 527 A Ln Cocoa, FL | 3.0 | 1.0 | 1500 | $1,800 | $1.20 | 23d | 1 | 0.18mi |
| 3782 Catalina Dr Cocoa, FL | 3.0 | 2.0 | 1404 | $2,075 | $1.48 | 23d | 1 | 0.54mi |
| 305 Laredo Dr Cocoa, FL | 1.0–3.0 | 1.0–2.0 | 1481 | $2,319 | $1.57 | 13d | 28 | 1.38mi |
Listing history 9 events
-
2026-06-18days on market $229,000 Active 12 DOM
-
2026-06-17days on market $229,000 Active 11 DOM
-
2026-06-16days on market $229,000 Active 10 DOM
-
2026-06-15days on market $229,000 Active 9 DOM
-
2026-06-14days on market $229,000 Active 7 DOM
-
2026-06-10days on market $229,000 Active 4 DOM
-
2026-06-08days on market $229,000 Active 2 DOM
-
2026-06-07remarks 573-char remark
-
2026-06-07$229,000 Active 1 DOM
ⓘ Source: listings_history table (triggers on properties + properties_extension) + one-shot
backfill from property_details.listing_events for pre-trigger history.
Tax reassessment forecast FL · Resets to sale price
- Current annual tax
- $1,235 · $103/mo
- Projected year-2 tax
- $1,901 · $158/mo
- Expected delta
- +$666/yr (+$55/mo · 53.9%)
ⓘ Screening estimate from a state-policy table — verify with the county assessor before closing.
Climate risk First Street
- Flood 1/10 Low FEMA zone X (unshaded) · 0% chance over 30 yrs
- Wildfire 4/10 Moderate
- Heat 10/10 Extreme 7 d/yr ≥106°F today · 24 d/yr by 30 yrs out
- Wind 10/10 Extreme 99% chance of damaging wind over 30 yrs
- Air quality 1/10 Low 0 unhealthy d/yr today · 0 by 30 yrs out
Nearby sold comps map
Loading sold comps map…
Walkable amenities ~0.75 mi
Loading nearby amenities…
Taxation est. · year 1
- Rental income
- $24,718
- − Mortgage interest
- −$12,828
- − Property taxes
- −$1,235
- − Insurance
- −$1,145
- − Repairs & maintenance
- −$1,977
- − Management
- −$1,977
- − Depreciation
- −$6,662
- Taxable loss
- −$1,106
- Est. tax savings @ 24.0%
- +$265
- After-tax cash flow
- $3,002/yr
For passive investors: Depreciation is non-cash, so a rental often shows a tax loss while cash-flowing — sheltering income. Rental losses are passive: they offset passive income freely, and up to $25,000/yr can offset ordinary (W-2) income if you actively participate and your MAGI is under $100k (phasing out to $0 by $150k); unused losses carry forward. On sale, claimed depreciation is recaptured at up to 25%, and gains may owe capital-gains tax (a 1031 exchange can defer both). Figures are a year-1 estimate at your 24.0% rate — not tax advice; consult a CPA.
Schools (NCES district)
- District
- Brevard
- NCES district ID
- 1200150
- Math proficiency
- 53% ▼ -9.00%
- Reading proficiency
- 57% ▼ -4.00%
- Median HH income
- $49,426
- Composite
- 46.86/100
- National rank
- #2370
- State rank
- #19 of 73 in FL
Livability — Cocoa West
- Score
- 69/100
- State rank
- #481
- US rank
- #8792
Category grades
Schools grade is shown separately in the Schools card above.
Census & demographics
- Census place
- Cocoa West, FL
- County
- Brevard County · 602,871 people
- Metro
- Palm Bay-Melbourne-Titusville, FL
- Population (ZIP)
- 23,505
- Household income
- $70,735
- Rent vs Own
- Severe rent burden
- 782.0
Population outlook (Brevard County) Hauer SSP2
- Today (2025)
- 623,254 people
- By 2030
- 648,420 · +4.0%
- By 2040
- 690,009 · +10.7%
- By 2050
- 715,669 · +14.8%
- By 2075
- 775,744 · +24.5%
- By 2100
- 776,687 · +24.6%
Race, ethnicity, and origin ACS 2023
- Neighborhood character
- Predominantly White (72%)
- Race & ethnicity
- White 72% Black 11% Hispanic / Latino 10% Two or more races 9% Asian 2%
- Hispanic origin (detail)
- Mexican 5% Puerto Rican 2%
- Common ancestry
- Romanian 2% Lithuanian 2% Italian 2%
- Foreign-born
- 5% · Canada, Vietnam, Jamaica
- Languages at home
- 91% English-only · Spanish 6% Vietnamese 1% German/W. Germanic 1%
Political lean MEDSL · Brevard
- 2024 margin
- Strong R (+20.8) · D 39.1% · R 59.9% · Other 1.0%
- 2008→2024 swing
- -10.4pp toward R · 2008: -10.4pp · 2024: -20.8pp
- All cycles
- 2024: R+20.8 2020: R+16.4 2016: R+19.8 2012: R+12.7 2008: R+10.4
Not yet ingested
- Civics
- —
Market trends
- HPI YoY
- ▼ -68.32%
- Current HPI
- 335.1251
- Rent YoY
- ▲ 5.60%
- Metro
- Palm Bay-Melbourne-Titusville, FL
- State GDP YoY
- ▲ 3.28%
- F500 in state
- 36
Industry mix (Fortune 500 HQ in FL)
| Industry | F500 HQs | Revenue |
|---|---|---|
| Industrial Technology | 2 | $29B |
|
||
| Insurance | 2 | $17B |
|
||
| Retail | 1 | $60B |
|
||
| Technology Distribution | 1 | $58B |
|
||
| Homebuilding | 1 | $35B |
|
||
| Technology Manufacturing | 1 | $35B |
|
||
Price history
1 event — show timeline
- 2026-06-06 Listed $229,000 SCMLS
Property tax history
+3.1%/yrLatest (2025): $1,235 · +13.9% YoY. Source: county tax records.
Cash-flow waterfall
monthlySold comps — $/sqft
last 12 mo · ≤1 miLoading sold comps…