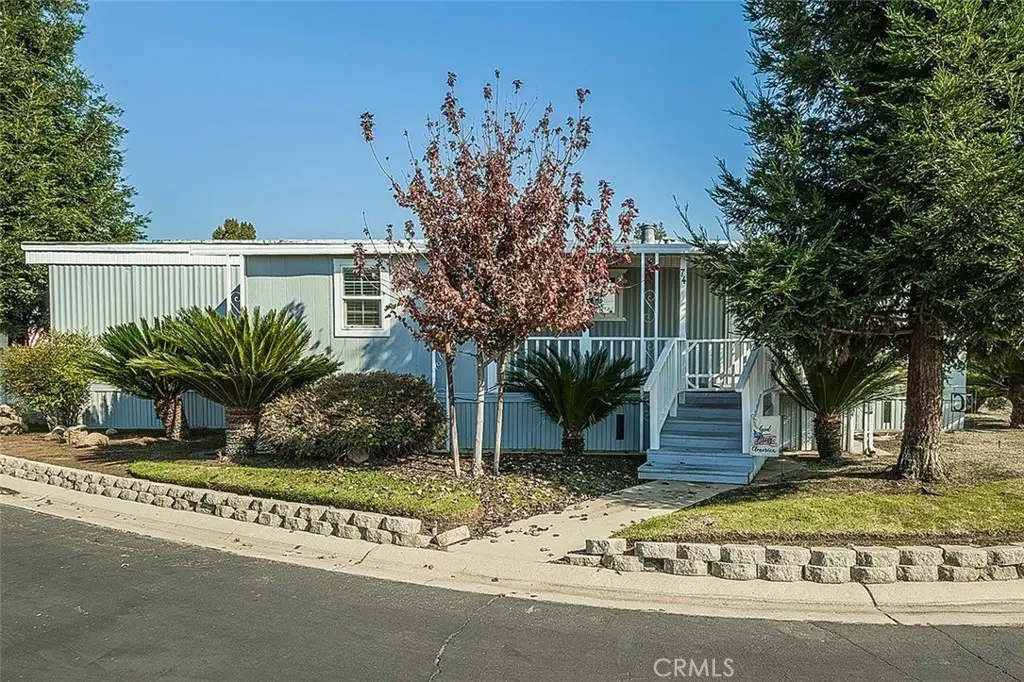
371 Bethel Ave · Sanger, CA
Flood risk 1/10 · Minimal
- FEMA flood zone
- X (unshaded)
- Chance of flooding over 30 yrs
- 0.0%
- Est. flood insurance / yr
- $507 – $1,088
Fire risk 8/10 · Major
- Est. fire insurance / yr
- $659 – $1,223
Heat risk 8/10 · Major
- Hot days now (above 105°F)
- 6 days/yr
- Hot days in 30 yrs
- 15 days/yr
Wind risk 1/10 · Minimal
- Chance of severe wind over 30 yrs
- —
Air-quality risk 10/10 · Severe
- Unhealthy air days now
- 52 days/yr
- Unhealthy air days in 30 yrs
- 58 days/yr
Risk factors via First Street. Map © Google.
Why this score? — see what drove the C grade
The composite is a weighted blend of 9 inputs, each scored 0–100. Each bar is that input's sub-score; the figure is the points it added to the 100-point composite (weight × sub-score).
- Cash flow +28.7/30.0
- DSCR +10.0/10.0
- 1% rule +8.0/10.0
- Schools +3.7/10.0
- Livability +2.9/5.0
- Rent growth +2.5/5.0
- Condition / age +2.5/5.0
- ARV discount +0.0/15.0
- Appreciation +0.0/10.0
$148,000
🖨 Deal sheet 📄 Offer letter ✓ Due diligence
Listing remarks MLS
Beautifully maintained and move-in ready! This charming 2-bedroom, 2-bath home offers comfortable Living with a spacious layout, bright natural light, and inviting living spaces throughout. Enjoy a cozy living room, functional kitchen, dedicated dining area, and plenty of storage with added sheds.
Key facts
- Move-in ready
- Functional kitchen
- Cozy living room
Tags
Neighborhood map
What this means for you Summary
Snapshot
- This is a 2-bed/2.0-bath land listed at $148k.
Deal economics
- At list price, monthly cash flow is $493 ($6k/yr) — positive.
- The deal already cash-flows at list — no discount required.
- Meets the 1% rule at list price ($2k rent vs $148k).
- Recommended offer: $146k (1.5% below list) — sets the bar for market timing.
- Cap rate 10.3% vs local median 3.6% in Sanger — top-decile yield for the area; either an underpriced asset or a hidden risk that comps aren't pricing in. Stress-test before assuming the spread holds.
Location & tenants
- Location reads 58/100 on livability (#668 in CA) — a working-class tenant base; expect higher turnover. Strengths: housing A+; Watch: schools C-, employment C-, crime D+.
- Sanger Unified (town): math 22% / reading 62% proficiency, ranked #216 of 517 in CA (top 42%) — families likely to look elsewhere, expect single-tenant / working-renter base with shorter leases; 64% free/reduced lunch — lower-income household profile, screen leases tightly.
- Market conditions: 151 active listings in the ZIP; solid renter incomes; 2,426 units permitted in Fresno County in 2024 (296 in 5+ unit buildings).
Forward outlook
- Local home prices are declining (-3.0%/yr); year-one equity from $1k of loan paydown is wiped out by about $4k of value loss. Plan a longer hold.
- Fresno County population projected at +11% by 2050 — modest demand growth; plan on rents tracking national, not racing it.
- At projected returns (-3.0% appreciation + 3.0% rent growth), your $41k cash investment doubles in ~9 years — after that, you're playing with house money.
Negotiation context
- It's been on market 18 days — a 2% lower offer ($146k) is reasonable based on typical stale-listing flexibility.
- 8 sale attempts since 24y ago with the ask held roughly flat each time — persistent listings suggest the price (not the market) is what's stuck; bring a comps-based counter.
- Current owner paid $80k; list at $148k implies a 85% gain — meaningful room to come down on a strong offer.
Risks & watch-outs
- Climate carrying-cost: severe wildfire risk; extreme-heat days projected 6→15/yr by 2055 (HVAC capex compounding) — expect insurance premiums to compound above CPI over the hold.
Questions for the listing agent
- Built in 1976 — when were the roof, HVAC, electrical panel, plumbing, and water heater last replaced?
- Is there a deadline driving the sale (1031 exchange, divorce, estate, relocation)? That informs how much negotiation room exists.
- Crime grade is D in this area — have there been break-ins, vandalism, or insurance claims at this property in the last 3 years? What carrier currently insures it and at what premium?
- What's the average days-on-market for RENTAL listings here right now (not sales)? A rising rental-DOM trend means longer vacancies and softer asking-rent achievability than the comps imply.
- What's the recent tenant-quality profile in this submarket — average credit score on applications, eviction rate, late-payment / NSF rate, and stable-employment percentage? A property-management company in the area should have these aggregated.
- How much new for-sale + rental construction is in the pipeline within 1–3 miles? Heavy new supply typically softens prices + rents 12–24 months out; constrained supply supports both.
Investment metrics
- 1% rule
- 1.30% ✓
- Cap rate
- 10.29%
- Cash-on-cash
- 14.29%
- DSCR
- 1.64
- GRM
- 6.4
CMA / ARV
- ARV (median comp)
- $120,653
- List price
- $148,000
- Delta
- 24.32%
- Verdict
- OVERPRICED
- Comps
- 12 within 1.0 mi
Projected returns pro-forma
-3.0% appreciation · 3.0% rent growth · sell at horizon
- IRR
- 4.7%
- Equity multiple
- 1.18×
- Total profit
- $7,473
- Equity at exit
- $22,067
- IRR
- 14.1%
- Equity multiple
- 2.14×
- Total profit
- $47,091
- Equity at exit
- $12,796
Cash invested: $41,440 (down + closing). Projections, not guarantees.
Landlord ↔ Tenant lean methodology
- Overall (STATE)
- 18 Strongly Tenant-Friendly
- State California
- 18 Strongly Tenant-Friendly · D+13
- County
- — inherits STATE
- City
- — inherits STATE
ZIP-level market 93657
- Active inventory
- 151
- Price-to-rent
- 6.4×
Monthly cashflow live
- Estimated rent
- $1,919 medium interval (Pro) →
- Mortgage (P&I)
- −$776
- Tax est. 1.5%
- −$185 /mo · $2,220/yr
- Insurance
- −$62
- HOA
- −$0
- Vacancy / Maint / Mgmt
- −$403
- Net cashflow
- $493
Break-even live
UW: 25.0% down · 7.5% · 30yr · 1.5% tax · 5.0% vac · 8.0% maint · 8.0% mgmt
Financing live
Cash to close
- Down payment
- $37,000
- Closing costs
- $4,440
- Reserves months
- —
- Total cash needed
- —
Loan-product check · same deal, 3 products live
Conventional
25% down · 7.5% · 30yr
- Down + closing
- —
- Monthly P&I
- —
- Monthly cashflow
- —
- DSCR
- —
- Eligible?
- —
Personal DTI + credit; lowest rate.
DSCR
20% down · 8.5% · 30yr
- Down + closing
- —
- Monthly P&I
- —
- Monthly cashflow
- —
- DSCR
- —
- Eligible?
- —
No personal income docs; deal must DSCR.
Hard money
10% down · 12.0% · 12mo
- Down + closing
- —
- Monthly P&I
- —
- Monthly cashflow
- —
- DSCR
- —
- Eligible?
- —
Short-term bridge; refi at stabilization.
Listing history 28 events
-
2026-06-01pricedays on market $148,000 Active 18 DOM
-
2026-05-31days on market $150,000 Active 130 DOM
-
2026-05-15$148,000 Active 298-char remark
Show marketing remark (298 chars)
Beautifully maintained and move-in ready! This charming 2-bedroom, 2-bath home offers comfortable Living with a spacious layout, bright natural light, and inviting living spaces throughout. Enjoy a cozy living room, functional kitchen, dedicated dining area, and plenty of storage with added sheds.
-
2026-01-21$150,000 Active 1351-char remark
Show marketing remark (1351 chars)
Welcome home! This charming residence is truly move-in ready and it feels so much larger than the square footage suggests! Perfectly situated on a desirable corner lot, it greets you with beautiful landscaping and undeniable curb appeal. Step into your own private backyard retreat, where mature shade trees and a lush green lawn create the perfect setting for morning coffee, weekend barbecues, or simply unwinding at the end of the day. Inside, you'll appreciate the warmth and flow of this thoughtfully designed home. Newer windows bring in plenty of natural light, while easy-care vinyl plank flooring adds both style and practicality. Living area in front room is extra large, offering room to relax or entertain, a dedicated dining space is ready for gatherings, and a versatile extra room can easily serve as a home office, craft space, or cozy reading nook. The convenient Jack & Jill bath provides easy access for guests from both the laundry room and the secondary bedroom; a smart design that makes everyday living effortless. Full of charm, comfort, and flexibility, this home invites you to settle in, spread out, and make it your own. This home had a death on the property from natural causes. Subject to Buyer's being approved to live in the Park. Tax records differ from actual actual bedroom count. Buyer to verify if important.
-
2022-05-26soldstatus $80,000 Sold
-
2022-04-13status Pending
-
2022-03-31$84,900 Active
-
2021-06-24price $90,000
-
2021-06-11soldstatus $90,000 Sold
-
2021-05-03status Backup
-
2021-05-03price $92,000
-
2021-04-16$92,000 Active
-
2017-01-27price $44,500
-
2017-01-26soldstatus $44,500 Sold
-
2016-11-01status Pending
-
2016-11-01$44,900 Active
-
2016-10-29price $44,900
-
2007-04-10price $69,000
-
2007-03-29soldstatus $69,500
-
2007-02-07$69,500
-
2007-02-07historical
-
2007-01-05soldstatus $75,000
-
2006-11-16historical
-
2006-09-13$75,000
-
2002-12-01soldstatus $38,000
-
2002-10-16price $40,000
-
2002-10-16historical
-
2002-08-02$38,000
ⓘ Source: listings_history table (triggers on properties + properties_extension) + one-shot
backfill from property_details.listing_events for pre-trigger history.
Climate risk First Street
- Flood 1/10 Low FEMA zone X (unshaded) · 0% chance over 30 yrs
- Wildfire 8/10 Severe
- Heat 8/10 Severe 6 d/yr ≥105°F today · 15 d/yr by 30 yrs out
- Wind 1/10 Low
- Air quality 10/10 Extreme 52 unhealthy d/yr today · 58 by 30 yrs out
Nearby sold comps map
Loading sold comps map…
Walkable amenities ~0.75 mi
Loading nearby amenities…
Taxation est. · year 1
- Rental income
- $23,031
- − Mortgage interest
- −$8,290
- − Property taxes
- −$2,220
- − Insurance
- −$740
- − Repairs & maintenance
- −$1,842
- − Management
- −$1,842
- − Depreciation
- −$4,305
- Taxable income
- $3,790
- Est. tax owed @ 24.0%
- −$910
- After-tax cash flow
- $5,011/yr
For passive investors: Depreciation is non-cash, so a rental often shows a tax loss while cash-flowing — sheltering income. Rental losses are passive: they offset passive income freely, and up to $25,000/yr can offset ordinary (W-2) income if you actively participate and your MAGI is under $100k (phasing out to $0 by $150k); unused losses carry forward. On sale, claimed depreciation is recaptured at up to 25%, and gains may owe capital-gains tax (a 1031 exchange can defer both). Figures are a year-1 estimate at your 24.0% rate — not tax advice; consult a CPA.
Schools (NCES district)
- District
- Sanger Unified
- NCES district ID
- 0635250
- Math proficiency
- 22% ▼ -21.00%
- Reading proficiency
- 62% ▲ 9.00%
- Median HH income
- $57,180
- Composite
- 36.67/100
- National rank
- #4608
- State rank
- #216 of 517 in CA
Livability — Sanger
- Score
- 58/100
- State rank
- #668
- US rank
- #20675
Category grades
Schools grade is shown separately in the Schools card above.
Census & demographics
- Census place
- Sanger, CA
- County
- Fresno County · 834,801 people
- City population
- 36,205
- Metro
- Fresno, CA
- Population (ZIP)
- 36,205
- Household income
- $78,904
- Rent vs Own
- Severe rent burden
- 878.0
Population outlook (Fresno County) Hauer SSP2
- Today (2025)
- 1,042,971 people
- By 2030
- 1,072,198 · +2.8%
- By 2040
- 1,122,408 · +7.6%
- By 2050
- 1,157,251 · +11.0%
- By 2075
- 1,182,575 · +13.4%
- By 2100
- 1,105,899 · +6.0%
Race, ethnicity, and origin ACS 2023
- Neighborhood character
- Predominantly Hispanic (68%)
- Race & ethnicity
- Hispanic / Latino 68% White 25% Two or more races 17% Asian 5% Native American 2%
- Hispanic origin (detail)
- Mexican 64%
- Common ancestry
- Russian 1% Italian 1% Iranian 1%
- Foreign-born
- 19% · Canada, China
- Languages at home
- 52% English-only · Spanish 44% Other Asian/Pacific 2% Other Indo-European 1%
Political lean MEDSL · Fresno
- 2024 margin
- Toss-up / Even · D 46.5% · R 50.9% · Other 2.6%
- 2008→2024 swing
- -6.5pp toward R · 2008: 2.1pp · 2024: -4.4pp
- All cycles
- 2024: R+4.4 2020: D+7.8 2016: D+3.9 2012: R+2.9 2008: D+2.1
Not yet ingested
- Civics
- —
Market trends
- HPI YoY
- ▼ -254.86%
- Current HPI
- 366.3783
- Rent YoY
- —
- Metro
- Fresno, CA
- State GDP YoY
- ▲ 3.21%
- F500 in state
- 116
Industry mix (Fortune 500 HQ in CA)
| Industry | F500 HQs | Revenue |
|---|---|---|
| Technology | 27 | $1,492B |
|
||
| Financial Services | 3 | $174B |
|
||
| Retail | 3 | $44B |
|
||
| Insurance | 3 | $26B |
|
||
| Media / Entertainment | 2 | $115B |
|
||
| Pharmaceuticals / Biotech | 2 | $62B |
|
||
Price history
+289.5% since first listed26 events — show timeline
- 2026-05-15 Listed $148,000 FSBO.com
- 2026-01-21 Listed $150,000 CRMLS
- 2022-05-26 Sold (MLS) $80,000 FRESNOMLS
- 2022-04-13 Pending — FRESNOMLS
- 2022-03-31 Listed $84,900 FRESNOMLS
- 2021-06-24 Price Changed $90,000 FRESNOMLS
- 2021-06-11 Sold (MLS) $90,000 FRESNOMLS
- 2021-05-03 Pending — FRESNOMLS
- 2021-05-03 Price Changed $92,000 FRESNOMLS
- 2021-04-16 Listed $92,000 FRESNOMLS
- 2017-01-27 Price Changed $44,500 FRESNOMLS
- 2017-01-26 Sold (MLS) $44,500 FRESNOMLS
- 2016-11-01 Pending — FRESNOMLS
- 2016-11-01 Listed $44,900 FRESNOMLS
- 2016-10-29 Price Changed $44,900 FRESNOMLS
- 2007-04-10 Price Changed $69,000 FRESNOMLS
- 2007-03-29 Sold (MLS) $69,500 FRESNOMLS
- 2007-02-07 Delisted — FRESNOMLS
- 2007-02-07 Listed $69,500 FRESNOMLS
- 2007-01-05 Sold (MLS) $75,000 FRESNOMLS
- 2006-11-16 Delisted — FRESNOMLS
- 2006-09-13 Listed $75,000 FRESNOMLS
- 2002-12-01 Sold (MLS) $38,000 FRESNOMLS
- 2002-10-16 Delisted — FRESNOMLS
- 2002-10-16 Price Changed $40,000 FRESNOMLS
- 2002-08-02 Listed $38,000 FRESNOMLS
Property tax history
+2.4%/yrLatest (2025): $18,601 · +5.9% YoY. Source: county tax records.
Cash-flow waterfall
monthlySold comps — $/sqft
last 12 mo · ≤1 miLoading sold comps…