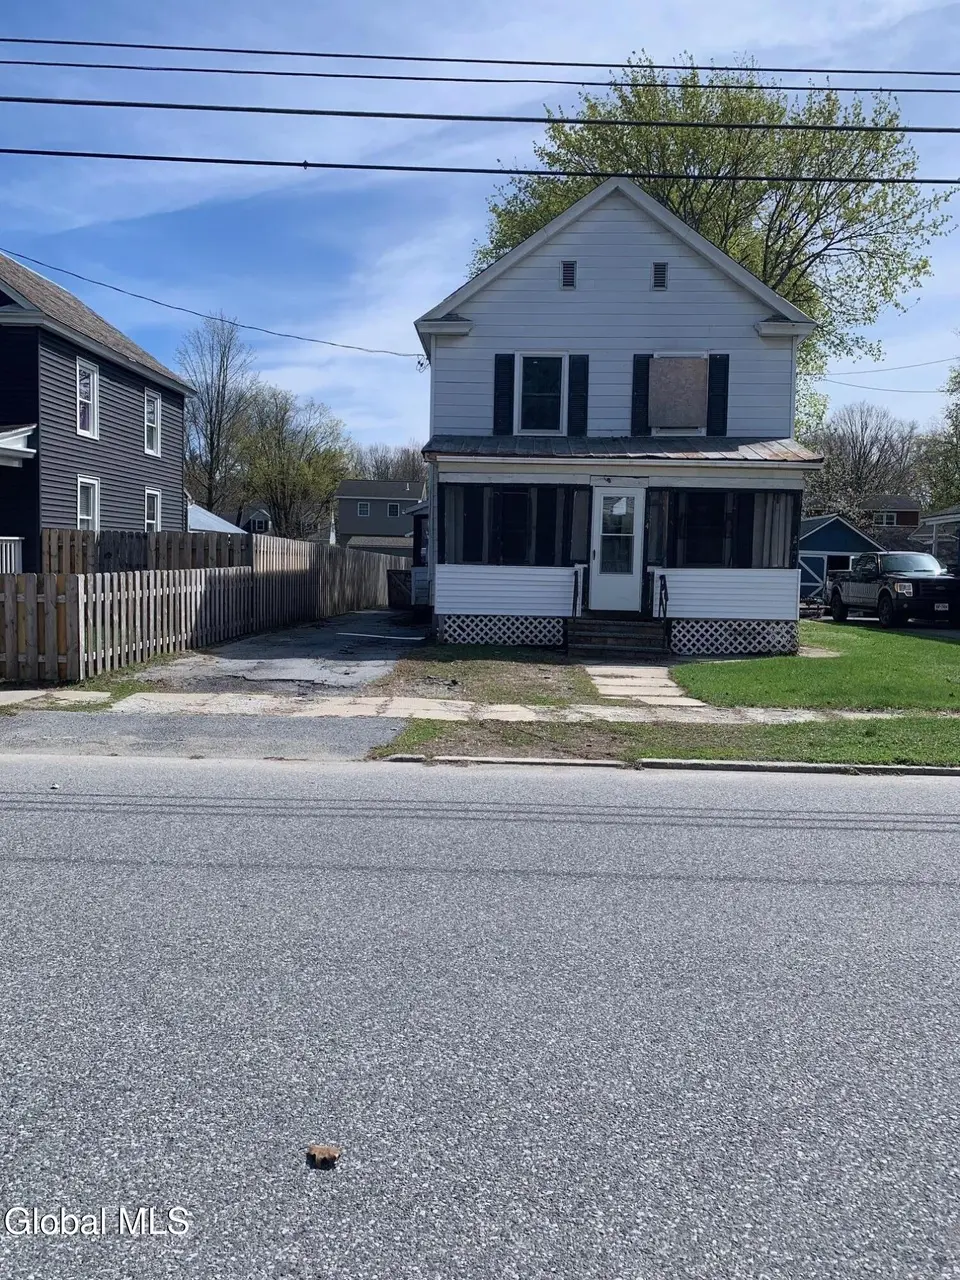
134 John St · Hudson Falls, NY
Flood risk 1/10 · Minimal
- FEMA flood zone
- —
- Chance of flooding over 30 yrs
- 0.0%
- Est. flood insurance / yr
- —
Fire risk 3/10 · Minor
- Est. fire insurance / yr
- $691 – $1,283
Heat risk 3/10 · Minor
- Hot days now (above 96°F)
- 7 days/yr
- Hot days in 30 yrs
- 16 days/yr
Wind risk 2/10 · Minimal
- Chance of severe wind over 30 yrs
- 3.0%
Air-quality risk 1/10 · Minimal
- Unhealthy air days now
- 0 days/yr
- Unhealthy air days in 30 yrs
- 0 days/yr
Risk factors via First Street. Map © Google.
Why this score? — see what drove the B+ grade
The composite is a weighted blend of 9 inputs, each scored 0–100. Each bar is that input's sub-score; the figure is the points it added to the 100-point composite (weight × sub-score).
- Cash flow +30.0/30.0
- 1% rule +10.0/10.0
- DSCR +10.0/10.0
- Appreciation +10.0/10.0
- ARV discount +7.5/15.0
- Schools +3.7/10.0
- Livability +3.5/5.0
- Rent growth +2.5/5.0
- Condition / age +2.5/5.0
$54,900
🖨 Deal sheet 📄 Offer letter ✓ Due diligence
Listing remarks MLS
Charming city home awaiting your special touches. BRING YOUR BUYERS AND LETS MAKE A DEAL.
Key facts
- 5,662 sq ft lot
- Built 1880
- Listed 27 days
Property features AI
Exterior
- Parking: Off-street parking; Stone parking surface; Other parking features
- Utilities: Public water; Public sewer
- Home design: Single-family residence; Living area approximately 1,420; Lot dimensions 42 x 133; Main road frontage 42
- Construction: Block foundation; Aluminum and vinyl siding; Other construction materials
- Exterior features: Pressure-treated deck; Enclosed porch; Front porch; Level, cleared lot
Interior
- Kitchen: Kitchen on the first floor
- Bedrooms: Four bedrooms on the second floor
- Flooring: Wood flooring
- Bathrooms: One full bathroom on the second floor
- Interior features: Storm door(s); Total of 10 rooms
- Laundry & utility: Main-level laundry; Unfinished basement
Neighborhood map
What this means for you Summary
Snapshot
- This is a 4-bed/1.0-bath single-family listed at $55k.
Deal economics
- At list price, monthly cash flow is $888 ($11k/yr) — positive.
- The deal already cash-flows at list — no discount required.
- Meets the 1% rule at list price ($2k rent vs $55k).
- Recommended offer: $54k (1.5% below list) — sets the bar for market timing.
- Cap rate 25.7% vs local median 4.3% in Hudson Falls — top-decile yield for the area; either an underpriced asset or a hidden risk that comps aren't pricing in. Stress-test before assuming the spread holds.
Location & tenants
- Location reads 69/100 on livability (#481 in NY) — a middle-class / working-renter tenant base. Strengths: housing A+, health & safety A+, cost of living A-; Watch: crime D, employment D, amenities F.
- Hudson Falls Central School District (suburban): math 39% / reading 47% proficiency, ranked #486 of 590 in NY (top 82%) — families likely to look elsewhere, expect single-tenant / working-renter base with shorter leases.
- Zoned schools: Hudson Falls High School (math 87% / reading 77%, grade A, #452 of 1,100 statewide, top 44%, 694 students, 38% FRL) — zoned schools at 38% FRL track the district average.
- Zoned-school proficiency averages 82% at this address vs 43% district-wide (+39 pts) — the actual schools serving this property are materially stronger than the Hudson Falls Central School District average implies; a family-tenant draw the district grade alone would hide.
- Market conditions: 55 active listings in the ZIP; 106 units permitted in Washington County in 2024 (0 in 5+ unit buildings).
Forward outlook
- In year one you build about $6k of equity ($380 loan paydown + $5k appreciation (10.0% local appreciation)).
- Washington County population projected at -20% by 2050 — secular population decline; favor cash flow + early exit over multi-decade hold.
- At projected returns (10.0% appreciation + 3.0% rent growth), your $15k cash investment doubles in ~1 year — after that, you're playing with house money.
- By year 6, paydown + projected appreciation supports a ~$35k cash-out refi (75% LTV) — recoverable capital for the next deal without selling this one.
Negotiation context
- It's been on market 27 days — a 2% lower offer ($54k) is reasonable based on typical stale-listing flexibility.
- 3 sale attempts since 24y ago; this cycle's ask has dropped $10k (15%) from the opening price — seller is motivated, your offer sets the floor, not the list.
Risks & watch-outs
- Watch-outs: built in 1880 — expect roof / HVAC / electrical / plumbing capex.
Questions for the listing agent
- Built in 1880 — when were the roof, HVAC, electrical panel, plumbing, and water heater last replaced?
- Is there a deadline driving the sale (1031 exchange, divorce, estate, relocation)? That informs how much negotiation room exists.
- Crime grade is D in this area — have there been break-ins, vandalism, or insurance claims at this property in the last 3 years? What carrier currently insures it and at what premium?
- What's the average days-on-market for RENTAL listings here right now (not sales)? A rising rental-DOM trend means longer vacancies and softer asking-rent achievability than the comps imply.
- What's the recent tenant-quality profile in this submarket — average credit score on applications, eviction rate, late-payment / NSF rate, and stable-employment percentage? A property-management company in the area should have these aggregated.
- How much new for-sale + rental construction is in the pipeline within 1–3 miles? Heavy new supply typically softens prices + rents 12–24 months out; constrained supply supports both.
Investment metrics
- 1% rule
- 2.92% ✓
- Cap rate
- 25.70%
- Cash-on-cash
- 69.31%
- DSCR
- 4.08
- GRM
- 2.9
CMA / ARV
- ARV (on-the-fly)
- $217,360
- Comps found
- 12
Show comp detail 12 sales within ~0.75 mi
| Address | Dist | Beds/Ba | Sqft | Sold | Price | $/sf | Match |
|---|---|---|---|---|---|---|---|
| 51 Coleman Ave | 0.24mi | 3/1.0 (-1) | 1,452 (+2%) | 2mo | $242,800 | $167 | 79 |
| 17 Liberty Pl | 0.23mi | 3/1.0 (-1) | 1,487 (+4%) | 2mo | $130,000 | $87 | 75 |
| 127 John St | 0.06mi | 3/2.0 (-1) | 1,515 (+6%) | 9mo | $150,000 | $99 | 71 |
| 27 Lincoln St | 0.37mi | 3/1.0 (-1) | 1,512 (+6%) | 2mo | $275,000 | $182 | 66 |
| 7 Willow St | 0.37mi | 4/2.0 | 1,495 (+4%) | 6mo | $245,000 | $164 | 66 |
| 63 Elm St | 0.30mi | 3/2.5 (-1) | 1,415 (-1%) | 9mo | $215,000 | $152 | 66 |
| 71 Elm St | 0.32mi | 3/1.0 (-1) | 1,352 (-6%) | 7mo | $77,000 | $57 | 65 |
| 15 Union St | 0.64mi | 4/2.0 | 1,404 (-2%) | 9mo | $235,000 | $167 | 56 |
| 444 Lower Main St | 0.48mi | 3/2.0 (-1) | 1,491 (+4%) | 9mo | $145,000 | $97 | 54 |
| 31 Parry St | 0.64mi | 3/1.5 (-1) | 1,522 (+6%) | 2mo | $228,000 | $150 | 51 |
| 587 Lower Allen St | 0.75mi | 4/2.0 | 1,357 (-5%) | 6mo | $95,900 | $71 | 48 |
| 32 Swan St | 0.74mi | 3/2.0 (-1) | 1,230 (-14%) | 7mo | $335,000 | $272 | 27 |
Match score weights: distance 35% · size 25% · config 20% · recency 20%. Top-matched comps best support the ARV.
Projected returns pro-forma
10.0% appreciation · 3.0% rent growth · sell at horizon
- IRR
- 80.4%
- Equity multiple
- 6.63×
- Total profit
- $86,474
- Equity at exit
- $49,458
- IRR
- 74.6%
- Equity multiple
- 14.68×
- Total profit
- $210,228
- Equity at exit
- $106,659
Cash invested: $15,372 (down + closing). Projections, not guarantees.
Landlord ↔ Tenant lean methodology
- Overall (STATE)
- 15 Strongly Tenant-Friendly
- State New York
- 15 Strongly Tenant-Friendly · D+10
- County
- — inherits STATE
- City
- — inherits STATE
ZIP-level market 12839
- Home prices YoY
- 8.5%
- Active inventory
- 55
- Price-to-rent
- 2.9×
Monthly cashflow live
- Estimated rent
- $1,604 medium interval (Pro) →
- Mortgage (P&I)
- −$288
- Tax est. 1.5%
- −$69 /mo · $824/yr
- Insurance
- −$23
- HOA
- −$0
- Vacancy / Maint / Mgmt
- −$337
- Net cashflow
- $888
Break-even live
UW: 25.0% down · 7.5% · 30yr · 1.5% tax · 5.0% vac · 8.0% maint · 8.0% mgmt
Financing live
Cash to close
- Down payment
- $13,725
- Closing costs
- $1,647
- Reserves months
- —
- Total cash needed
- —
Loan-product check · same deal, 3 products live
Conventional
25% down · 7.5% · 30yr
- Down + closing
- —
- Monthly P&I
- —
- Monthly cashflow
- —
- DSCR
- —
- Eligible?
- —
Personal DTI + credit; lowest rate.
DSCR
20% down · 8.5% · 30yr
- Down + closing
- —
- Monthly P&I
- —
- Monthly cashflow
- —
- DSCR
- —
- Eligible?
- —
No personal income docs; deal must DSCR.
Hard money
10% down · 12.0% · 12mo
- Down + closing
- —
- Monthly P&I
- —
- Monthly cashflow
- —
- DSCR
- —
- Eligible?
- —
Short-term bridge; refi at stabilization.
Listing history 22 events
-
2026-06-18days on market $54,900 Active 27 DOM
-
2026-06-17days on market $54,900 Active 26 DOM
-
2026-06-16days on market $54,900 Active 25 DOM
-
2026-06-15days on market $54,900 Active 24 DOM
-
2026-06-14days on market $54,900 Active 22 DOM
-
2026-06-13pricedays on market $54,900 Active 21 DOM
-
2026-06-10days on market $64,900 Active 19 DOM
-
2026-06-09days on market $64,900 Active 18 DOM
-
2026-06-08days on market $64,900 Active 17 DOM
-
2026-06-07days on market $64,900 Active 16 DOM
-
2026-06-03days on market $64,900 Active 12 DOM
-
2026-06-02days on market $64,900 Active 11 DOM
-
2026-06-01days on market $64,900 Active 10 DOM
-
2026-05-31days on market $64,900 Active 9 DOM
-
2026-05-31days on market $64,900 Active 8 DOM
-
2026-05-22$64,900 Active
-
2005-09-06soldstatus $63,600
-
2005-08-28soldstatus $63,600 89-char remark
Show marketing remark (89 chars)
Charming city home awaiting your special touches. BRING YOUR BUYERS AND LETS MAKE A DEAL.
-
2004-05-18$69,900 89-char remark
Show marketing remark (89 chars)
Charming city home awaiting your special touches. BRING YOUR BUYERS AND LETS MAKE A DEAL.
-
2003-02-07historical
-
2002-11-07$59,900
-
2001-10-24soldstatus $25,000
ⓘ Source: listings_history table (triggers on properties + properties_extension) + one-shot
backfill from property_details.listing_events for pre-trigger history.
Climate risk First Street
- Flood 1/10 Low 0% chance over 30 yrs
- Wildfire 3/10 Moderate
- Heat 3/10 Moderate 7 d/yr ≥96°F today · 16 d/yr by 30 yrs out
- Wind 2/10 Low 3% chance of damaging wind over 30 yrs
- Air quality 1/10 Low 0 unhealthy d/yr today · 0 by 30 yrs out
Nearby sold comps map
Loading sold comps map…
Walkable amenities ~0.75 mi
Loading nearby amenities…
Taxation est. · year 1
- Rental income
- $19,250
- − Mortgage interest
- −$3,075
- − Property taxes
- −$824
- − Insurance
- −$274
- − Repairs & maintenance
- −$1,540
- − Management
- −$1,540
- − Depreciation
- −$1,597
- Taxable income
- $10,399
- Est. tax owed @ 24.0%
- −$2,496
- After-tax cash flow
- $8,159/yr
For passive investors: Depreciation is non-cash, so a rental often shows a tax loss while cash-flowing — sheltering income. Rental losses are passive: they offset passive income freely, and up to $25,000/yr can offset ordinary (W-2) income if you actively participate and your MAGI is under $100k (phasing out to $0 by $150k); unused losses carry forward. On sale, claimed depreciation is recaptured at up to 25%, and gains may owe capital-gains tax (a 1031 exchange can defer both). Figures are a year-1 estimate at your 24.0% rate — not tax advice; consult a CPA.
Schools (NCES district)
- District
- Hudson Falls Central School District
- NCES district ID
- 3614970
- Math proficiency
- 39% ▼ -8.00%
- Reading proficiency
- 47% ▲ 6.00%
- Median HH income
- $46,019
- Composite
- 36.57/100
- National rank
- #4635
- State rank
- #486 of 590 in NY
Livability — Hudson Falls
- Score
- 69/100
- State rank
- #481
- US rank
- #8482
Category grades
Schools grade is shown separately in the Schools card above.
Census & demographics
- Census place
- Hudson Falls, NY
- Population (ZIP)
- 13,618
Population outlook (Washington County) Hauer SSP2
- Today (2025)
- 59,576 people
- By 2030
- 57,618 · -3.3%
- By 2040
- 52,751 · -11.5%
- By 2050
- 47,514 · -20.2%
- By 2075
- 35,690 · -40.1%
- By 2100
- 24,807 · -58.4%
Race, ethnicity, and origin ACS 2023
- Neighborhood character
- Predominantly White (89%)
- Race & ethnicity
- White 89% Hispanic / Latino 4% Two or more races 4%
- Common ancestry
- Lithuanian 8% Slovak 5% Estonian 3%
- Foreign-born
- 5% · Canada, Guatemala
- Languages at home
- 92% English-only · Spanish 4% Other Indo-European 2% German/W. Germanic 2%
Political lean MEDSL · Washington
- 2024 margin
- Strong R (+21.2) · D 39.4% · R 60.6%
- 2008→2024 swing
- -22.0pp toward R · 2008: 0.8pp · 2024: -21.2pp
- All cycles
- 2024: R+21.2 2020: R+15.6 2016: R+20.2 2012: D+1.6 2008: D+0.8
Not yet ingested
- Civics
- —
Market trends
- HPI YoY
- ▲ 25.92%
- Current HPI
- 331.6315
- Rent YoY
- —
- Metro
- —
- State GDP YoY
- ▲ 2.60%
- F500 in state
- 92
Industry mix (Fortune 500 HQ in NY)
| Industry | F500 HQs | Revenue |
|---|---|---|
| Financial Services | 10 | $950B |
|
||
| Consumer Goods | 9 | $162B |
|
||
| Insurance | 4 | $225B |
|
||
| Telecommunications | 2 | $144B |
|
||
| Pharmaceuticals | 2 | $112B |
|
||
| Media / Entertainment | 2 | $69B |
|
||
Price history
+159.6% since first listed7 events — show timeline
- 2026-05-22 Listed $64,900 Global MLS
- 2005-09-06 Sold (Public Records) $63,600 Public Records
- 2005-08-28 Sold (MLS) $63,600 Global MLS
- 2004-05-18 Listed $69,900 Global MLS
- 2003-02-07 Listing Removed — Global MLS
- 2002-11-07 Listed $59,900 Global MLS
- 2001-10-24 Sold (Public Records) $25,000 Public Records
Property tax history
+2.4%/yrLatest (2025): $4,336 · +2.3% YoY. Source: county tax records.
Cash-flow waterfall
monthlySold comps — $/sqft
last 12 mo · ≤1 miLoading sold comps…