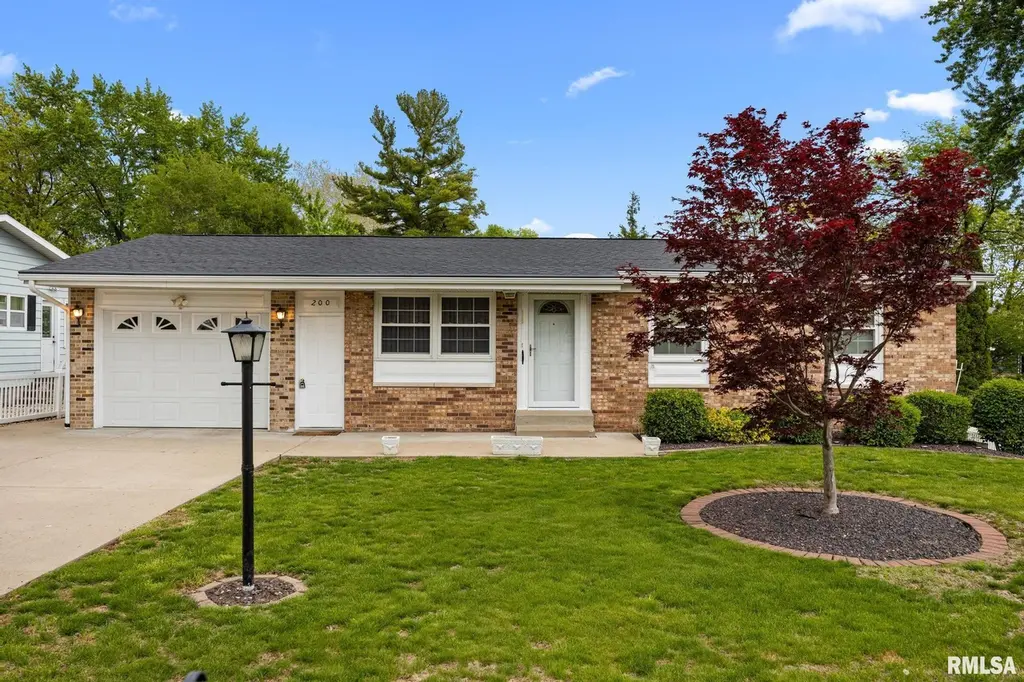
200 Bess St · East Peoria, IL
Flood risk 4/10 · Minor
- FEMA flood zone
- X (unshaded)
- Chance of flooding over 30 yrs
- 0.22%
- Est. flood insurance / yr
- $473 – $860
Fire risk 1/10 · Minimal
- Est. fire insurance / yr
- $804 – $1,492
Heat risk 3/10 · Minor
- Hot days now (above 104°F)
- 7 days/yr
- Hot days in 30 yrs
- 18 days/yr
Wind risk 2/10 · Minimal
- Chance of severe wind over 30 yrs
- 1.0%
Air-quality risk 2/10 · Minimal
- Unhealthy air days now
- 1 days/yr
- Unhealthy air days in 30 yrs
- 2 days/yr
Risk factors via First Street. Map © Google.
Why this score? — see what drove the D- grade
The composite is a weighted blend of 9 inputs, each scored 0–100. Each bar is that input's sub-score; the figure is the points it added to the 100-point composite (weight × sub-score).
- Cash flow +17.9/30.0
- DSCR +5.6/10.0
- Livability +3.8/5.0
- 1% rule +3.7/10.0
- Rent growth +2.5/5.0
- Condition / age +2.5/5.0
- Schools +1.1/10.0
- ARV discount +0.0/15.0
- Appreciation +0.0/10.0
$165,000
🖨 Deal sheet 📄 Offer letter ✓ Due diligence
Listing remarks
Welcome to this immaculately maintained 4-bedroom, 2-bath ranch in Sundale Subdivision, where pride of ownership shines inside and out. This home offers an amazing floor plan with a bright, inviting living room and an eat-in kitchen featuring appliances that stay. The main level includes three comfortable bedrooms and a full bath. The finished walk-out basement adds valuable living space with a family room, full bath, fourth bedroom (no egress), and a versatile bonus area with workshop. Enjoy the fenced backyard complete with a shed and raised garden bed—perfect for outdoor living and gardening. Updates include AC 2021, roof & driveway 2020, gutter guards 2015, furnace 2014. Ori
Key facts
- Eat-in kitchen
- Workshop
- Raised garden bed
Tags
Property features AI
Finance
- HOA & community: No association fee
Exterior
- Parking: Attached 1-car garage
- Utilities: Public water; Public sewer
- Home design: Single-family residence; Not new construction; Level lot; Paved road access
- Construction: Shingle roof; Built in 1963
- Exterior features: Fenced yard; Shed(s)
Interior
- Kitchen: Kitchen with vinyl flooring; Refrigerator; Microwave
- Bedrooms: Four bedrooms total (three on the main level; one in the basement)
- Flooring: Carpet in most living areas and bedrooms; Vinyl flooring in kitchen and laundry
- Bathrooms: Two full bathrooms
- Heating & cooling: Forced air heating; Central air conditioning
- Interior features: Cable available; Wood-burning fireplace in the family room; Finished daylight, full basement with walk-out access; Workshop in the basement
- Laundry & utility: Basement laundry room (vinyl flooring); Washer; Dryer; Gas water heater
Neighborhood map
What this means for you Summary
Snapshot
- This is a 3-bed/1.0-bath single-family listed at $165k.
Deal economics
- At list price, monthly cash flow is $140 ($2k/yr) — positive.
- The deal already cash-flows at list — no discount required.
- To meet the 1% rule (rent ≥ 1% of price), the offer needs to be $144k (12.8% below list).
- Recommended offer: $144k (12.8% below list) — sets the bar for 1% rule.
- Cap rate 7.3% vs local median 4.6% in East Peoria — top-decile yield for the area; either an underpriced asset or a hidden risk that comps aren't pricing in. Stress-test before assuming the spread holds.
Location & tenants
- Location reads 75/100 on livability (#209 in IL, #3,927 nationally) — a middle-class / working-renter tenant base. Strengths: cost of living A+, housing A+, health & safety A+; Watch: amenities D, commute F.
- District 50 Schools (suburban): math 12% / reading 11% proficiency, ranked #553 of 620 in IL (top 89%) — low school quality limits family demand, transient renter base, plan for 1-2y turnover.
- Zoned schools: Beverly Manor Elementary School (math 10% / reading 12%, grade F, #574 of 665 statewide, top 87%, 340 students, 0% FRL) — zoned schools average 0% FRL vs 45% district-wide (45 pts lower); this property's tenant base skews higher-income than the district average.
- Market conditions: 129 active listings in the ZIP; 3 comparable units currently listed for rent nearby; rentals leasing fast (median 14d on market — plan ~1-2 weeks tenant-placement turnaround); 77 units permitted in Tazewell County in 2024 (0 in 5+ unit buildings).
Forward outlook
- Local home prices are declining (-3.0%/yr); year-one equity from $1k of loan paydown is wiped out by about $5k of value loss. Plan a longer hold.
- Tazewell County population projected at -15% by 2050 — secular population decline; favor cash flow + early exit over multi-decade hold.
Negotiation context
- Only 2 days on market — expect competitive offers; lowballing is unlikely to land.
Questions for the listing agent
- Built in 1963 — when were the roof, HVAC, electrical panel, plumbing, and water heater last replaced?
- Is there a deadline driving the sale (1031 exchange, divorce, estate, relocation)? That informs how much negotiation room exists.
- Schools are F-rated, which usually means shorter tenancies and higher turnover. Who's the typical renter profile here, and what's been the actual vacancy rate?
- The area grade is low — what's the realistic commute time and amenity access for the typical tenant pool here? Any planned neighborhood developments (good or bad) we should know about?
- What's the average days-on-market for RENTAL listings here right now (not sales)? A rising rental-DOM trend means longer vacancies and softer asking-rent achievability than the comps imply.
- What's the recent tenant-quality profile in this submarket — average credit score on applications, eviction rate, late-payment / NSF rate, and stable-employment percentage? A property-management company in the area should have these aggregated.
- How much new for-sale + rental construction is in the pipeline within 1–3 miles? Heavy new supply typically softens prices + rents 12–24 months out; constrained supply supports both.
Investment metrics
- 1% rule
- 0.87% ✗
- Cap rate
- 7.31%
- Cash-on-cash
- 3.65%
- DSCR
- 1.16
- GRM
- 9.6
CMA / ARV
- ARV (on-the-fly)
- $139,464
- Comps found
- 12
Show comp detail 12 sales within ~0.75 mi
| Address | Dist | Beds/Ba | Sqft | Sold | Price | $/sf | Match |
|---|---|---|---|---|---|---|---|
| 408 Rosewood Dr | 0.28mi | 3/1.0 | 925 (-1%) | 1mo | $153,000 | $165 | 84 |
| 207 Rosewood Dr | 0.28mi | 3/1.0 | 928 (-1%) | 2mo | $159,900 | $172 | 84 |
| 121 Bess St | 0.03mi | 2/1.0 (-1) | 1,008 (+8%) | 1mo | $150,000 | $149 | 80 |
| 403 Rosewood Dr | 0.30mi | 3/1.0 | 925 (-1%) | 5mo | $125,000 | $135 | 80 |
| 107 Oriental Dr | 0.32mi | 3/1.0 | 912 (-3%) | 4mo | $110,000 | $121 | 78 |
| 306 Monterey Dr | 0.59mi | 3/1.0 | 912 (-3%) | 8mo | $143,000 | $157 | 62 |
| 305 Mary St | 0.17mi | 3/1.5 | 1,073 (+15%) | 5mo | $142,000 | $132 | 61 |
| 112 Briargate Rd | 0.28mi | 2/1.0 (-1) | 816 (-13%) | 2mo | $150,000 | $184 | 59 |
| 103 S Meadowview Ln | 0.71mi | 3/1.0 | 972 (+4%) | 6mo | $106,000 | $109 | 56 |
| 230 Stahl Ave | 0.63mi | 2/1.0 (-1) | 884 (-6%) | 3mo | $108,000 | $122 | 54 |
| 2252 Northridge Ln | 0.71mi | 3/1.0 | 825 (-12%) | 1mo | $130,000 | $158 | 46 |
| 104 Cherry Ln | 0.58mi | 2/1.0 (-1) | 1,048 (+12%) | 6mo | $128,000 | $122 | 43 |
Match score weights: distance 35% · size 25% · config 20% · recency 20%. Top-matched comps best support the ARV.
Projected returns pro-forma
-3.0% appreciation · 3.0% rent growth · sell at horizon
- IRR
- -10.6%
- Equity multiple
- 0.61×
- Total profit
- $-17,861
- Equity at exit
- $24,602
- IRR
- -1.4%
- Equity multiple
- 0.91×
- Total profit
- $-4,309
- Equity at exit
- $14,266
Cash invested: $46,200 (down + closing). Projections, not guarantees.
Landlord ↔ Tenant lean methodology
- Overall (STATE)
- 43 Moderately Tenant-Leaning
- State Illinois
- 43 Moderately Tenant-Leaning · D+7
- County
- — inherits STATE
- City
- — inherits STATE
ZIP-level market 61571
- Active inventory
- 129
- Price-to-rent
- 9.6×
Monthly cashflow live
- Estimated rent
- $1,438 medium interval (Pro) →
- Mortgage (P&I)
- −$865
- Tax from tax record
- −$62 /mo · $739/yr
- Insurance
- −$69
- HOA
- −$0
- Vacancy / Maint / Mgmt
- −$302
- Net cashflow
- $140
Break-even live
UW: 25.0% down · 7.5% · 30yr · 1.5% tax · 5.0% vac · 8.0% maint · 8.0% mgmt
Financing live
Cash to close
- Down payment
- $41,250
- Closing costs
- $4,950
- Reserves months
- —
- Total cash needed
- —
Loan-product check · same deal, 3 products live
Conventional
25% down · 7.5% · 30yr
- Down + closing
- —
- Monthly P&I
- —
- Monthly cashflow
- —
- DSCR
- —
- Eligible?
- —
Personal DTI + credit; lowest rate.
DSCR
20% down · 8.5% · 30yr
- Down + closing
- —
- Monthly P&I
- —
- Monthly cashflow
- —
- DSCR
- —
- Eligible?
- —
No personal income docs; deal must DSCR.
Hard money
10% down · 12.0% · 12mo
- Down + closing
- —
- Monthly P&I
- —
- Monthly cashflow
- —
- DSCR
- —
- Eligible?
- —
Short-term bridge; refi at stabilization.
Rent comps 3 comps
| Address | Beds | Baths | Sqft | Rent | $/sqft | DOM | Units | Dist |
|---|---|---|---|---|---|---|---|---|
| 2244 Northridge Ln Washington, IL | 3.0 | 1.0 | 825 | $1,500 | $1.82 | 13d | 1 | 0.75mi |
| 924 School St Washington, IL | 2.0 | 2.0 | 1000 | $1,250 | $1.25 | 13d | 1 | 0.88mi |
| 100 Pheasant Run Washington, IL | 2.0 | 2.0 | 1121 | $1,612 | $1.44 | 13d | 6 | 1.15mi |
Listing history 2 events
-
2026-04-30status Pending
-
2026-04-28$165,000 Active
ⓘ Source: listings_history table (triggers on properties + properties_extension) + one-shot
backfill from property_details.listing_events for pre-trigger history.
Tax reassessment forecast IL · Partial reset (capped growth)
- Current annual tax
- $739 · $62/mo
- Projected year-2 tax
- $2,242 · $187/mo
- Expected delta
- +$1,503/yr (+$125/mo · 203.5%)
ⓘ Screening estimate from a state-policy table — verify with the county assessor before closing.
Climate risk First Street
- Flood 4/10 Moderate FEMA zone X (unshaded) · 22% chance over 30 yrs
- Wildfire 1/10 Low
- Heat 3/10 Moderate 7 d/yr ≥104°F today · 18 d/yr by 30 yrs out
- Wind 2/10 Low 100% chance of damaging wind over 30 yrs
- Air quality 2/10 Low 1 unhealthy d/yr today · 2 by 30 yrs out
Nearby sold comps map
Loading sold comps map…
Walkable amenities ~0.75 mi
Loading nearby amenities…
Taxation est. · year 1
- Rental income
- $17,256
- − Mortgage interest
- −$9,243
- − Property taxes
- −$739
- − Insurance
- −$825
- − Repairs & maintenance
- −$1,380
- − Management
- −$1,380
- − Depreciation
- −$4,800
- Taxable loss
- −$1,111
- Est. tax savings @ 24.0%
- +$267
- After-tax cash flow
- $1,952/yr
For passive investors: Depreciation is non-cash, so a rental often shows a tax loss while cash-flowing — sheltering income. Rental losses are passive: they offset passive income freely, and up to $25,000/yr can offset ordinary (W-2) income if you actively participate and your MAGI is under $100k (phasing out to $0 by $150k); unused losses carry forward. On sale, claimed depreciation is recaptured at up to 25%, and gains may owe capital-gains tax (a 1031 exchange can defer both). Figures are a year-1 estimate at your 24.0% rate — not tax advice; consult a CPA.
Schools (NCES district)
- District
- District 50 Schools
- NCES district ID
- 1741010
- Math proficiency
- 12% ▼ -2.00%
- Reading proficiency
- 11% ▼ -7.00%
- Median HH income
- $50,613
- Composite
- 10.93/100
- National rank
- #9748
- State rank
- #553 of 620 in IL
Livability — East Peoria
- Score
- 75/100
- State rank
- #209
- US rank
- #3927
Category grades
Schools grade is shown separately in the Schools card above.
Census & demographics
- Census place
- East Peoria, IL
- City population
- 23,698
- Population (ZIP)
- 24,544
Population outlook (Tazewell County) Hauer SSP2
- Today (2025)
- 131,252 people
- By 2030
- 128,028 · -2.5%
- By 2040
- 120,443 · -8.2%
- By 2050
- 111,872 · -14.8%
- By 2075
- 89,843 · -31.5%
- By 2100
- 66,468 · -49.4%
Race, ethnicity, and origin ACS 2023
- Neighborhood character
- Predominantly White (93%)
- Race & ethnicity
- White 93% Hispanic / Latino 3% Two or more races 3% Asian 1%
- Common ancestry
- Lithuanian 4% Italian 3% Iranian 2%
- Foreign-born
- 2% · Canada, China
- Languages at home
- 97% English-only · Spanish 2%
Political lean MEDSL · Tazewell
- 2024 margin
- Strong R (+26.7) · D 35.8% · R 62.5% · Other 1.8%
- 2008→2024 swing
- -20.6pp toward R · 2008: -6.0pp · 2024: -26.7pp
- All cycles
- 2024: R+26.7 2020: R+25.6 2016: R+28.5 2012: R+17.9 2008: R+6.0
Not yet ingested
- Civics
- —
Market trends
- HPI YoY
- ▼ -135.85%
- Current HPI
- 149.5627
- Rent YoY
- —
- Metro
- —
- State GDP YoY
- ▲ 1.59%
- F500 in state
- 60
Industry mix (Fortune 500 HQ in IL)
| Industry | F500 HQs | Revenue |
|---|---|---|
| Insurance | 4 | $201B |
|
||
| Consumer Goods | 4 | $87B |
|
||
| Industrial Machinery | 3 | $64B |
|
||
| Healthcare | 2 | $55B |
|
||
| Retail / Pharmacy | 1 | $148B |
|
||
| Agriculture / Food | 1 | $86B |
|
||
Price history
2 events — show timeline
- 2026-04-30 Pending — RMLSA as Distributed by MLS Grid
- 2026-04-28 Listed $165,000 RMLSA as Distributed by MLS Grid
Property tax history
+0.4%/yrLatest (2024): $739 · -2.4% YoY. Source: county tax records.
Cash-flow waterfall
monthlySold comps — $/sqft
last 12 mo · ≤1 miLoading sold comps…