 🏷️ Likely Rental
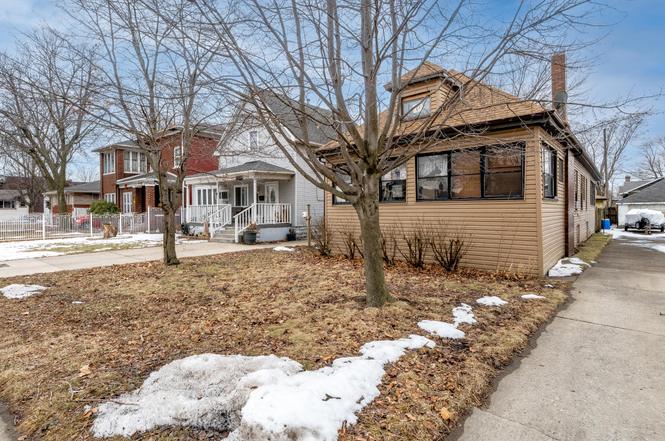
4136 Baring Ave · East Chicago, IN
Flood risk 4/10 · Minor
- FEMA flood zone
- X (unshaded)
- Chance of flooding over 30 yrs
- 0.24%
- Est. flood insurance / yr
- $473 – $860
Fire risk 1/10 · Minimal
- Est. fire insurance / yr
- $717 – $1,331
Heat risk 3/10 · Minor
- Hot days now (above 101°F)
- 7 days/yr
- Hot days in 30 yrs
- 15 days/yr
Wind risk 2/10 · Minimal
- Chance of severe wind over 30 yrs
- 1.0%
Air-quality risk 4/10 · Minor
- Unhealthy air days now
- 5 days/yr
- Unhealthy air days in 30 yrs
- 6 days/yr
Risk factors via First Street. Map © Google.
Why this score? — see what drove the A- grade
The composite is a weighted blend of 9 inputs, each scored 0–100. Each bar is that input's sub-score; the figure is the points it added to the 100-point composite (weight × sub-score).
- Cash flow +30.0/30.0
- ARV discount +15.0/15.0
- 1% rule +10.0/10.0
- DSCR +10.0/10.0
- Appreciation +4.8/10.0
- Rent growth +4.5/5.0
- Livability +3.2/5.0
- Condition / age +2.5/5.0
- Schools +0.8/10.0
$75,000
🖨 Deal sheet (PDF) 📄 Offer letter ✓ Due diligence
Listing remarks
Investor special! Tenant-occupied property priced to sell and ready to add to your portfolio. This income-producing home offers immediate rental potential with an established tenant already in place. Conveniently located near Indianapolis Ave with easy access to major roads, shopping, dining, and local amenities. Ideal opportunity for investors looking for a value-add or long-term hold in East Chicago. Being sold as-is.
Key facts
- Established tenant
- Long term hold
- 3,500 sq ft lot
Tags
Neighborhood map
What this means for you Summary
Snapshot
- This is a 3-bed/1.0-bath single-family listed at $75k.
Deal economics
- At list price, monthly cash flow is $504 ($6k/yr) — positive.
- The deal already cash-flows at list — no discount required.
- Meets the 1% rule at list price ($1k rent vs $75k).
- Recommended offer: $74k (1.5% below list) — sets the bar for market timing.
- Cap rate 14.4% vs local median 8.2% in East Chicago — top-decile yield for the area; either an underpriced asset or a hidden risk that comps aren't pricing in. Stress-test before assuming the spread holds.
Location & tenants
- Location reads 64/100 on livability (#371 in IN) — a middle-class / working-renter tenant base. Strengths: commute A+, cost of living A+, housing A; Watch: health & safety D+, crime F, amenities F.
- School City Of East Chicago (suburban): math 7% / reading 15% proficiency, ranked #293 of 301 in IN (top 97%) — low school quality limits family demand, transient renter base, plan for 1-2y turnover; 89% free/reduced lunch — lower-income household profile, screen leases tightly.
- Zoned schools: Benjamin Harrison Elementary Sch (math 4% / reading 5%, grade F, #983 of 994 statewide, top 99%, 396 students, 82% FRL); Joseph Block Middle School (math 3% / reading 13%, grade F, #317 of 330 statewide, top 96%, 487 students, 82% FRL); East Chicago Central High School (math 23% / reading 56%, grade F, #221 of 369 statewide, top 63%, 1,079 students, 77% FRL).
- Market conditions: Rents rising fast (+8.1%/yr); 79 active listings in the ZIP; 5 comparable units currently listed for rent nearby; rentals at typical pace (median 27d on market — plan ~3-4 weeks tenant-placement turnaround); lower-income renter base — watch delinquency; 1,642 units permitted in Lake County in 2024 (14 in 5+ unit buildings).
- This rent runs 37% of the median local income ($42k/yr) — at the standard rent-burdened threshold; future hikes will face affordability resistance.
Forward outlook
- In year one you build about $291 of equity ($519 loan paydown + $-228 appreciation (-0.3% local appreciation)).
- Lake County population projected to shrink 7% by 2050 — rents likely to lag national; underwrite the cash flow, not the appreciation.
- At projected returns (-0.3% appreciation + 8.0% rent growth), your $21k cash investment doubles in ~3 years — after that, you're playing with house money.
Negotiation context
- It's been on market 17 days — a 2% lower offer ($74k) is reasonable based on typical stale-listing flexibility.
Risks & watch-outs
- Watch-outs: built in 1914 — expect roof / HVAC / electrical / plumbing capex.
Questions for the listing agent
- Built in 1914 — when were the roof, HVAC, electrical panel, plumbing, and water heater last replaced?
- Is there a deadline driving the sale (1031 exchange, divorce, estate, relocation)? That informs how much negotiation room exists.
- Schools are F-rated, which usually means shorter tenancies and higher turnover. Who's the typical renter profile here, and what's been the actual vacancy rate?
- Crime grade is F in this area — have there been break-ins, vandalism, or insurance claims at this property in the last 3 years? What carrier currently insures it and at what premium?
- What's the average days-on-market for RENTAL listings here right now (not sales)? A rising rental-DOM trend means longer vacancies and softer asking-rent achievability than the comps imply.
- What's the recent tenant-quality profile in this submarket — average credit score on applications, eviction rate, late-payment / NSF rate, and stable-employment percentage? A property-management company in the area should have these aggregated.
- How much new for-sale + rental construction is in the pipeline within 1–3 miles? Heavy new supply typically softens prices + rents 12–24 months out; constrained supply supports both.
Investment metrics
- 1% rule
- 1.71% ✓
- Cap rate
- 14.36%
- Cash-on-cash
- 28.80%
- DSCR
- 2.28
- GRM
- 4.9
CMA / ARV
- ARV (on-the-fly)
- $131,760
- Comps found
- 6
Show comp detail 6 sales within ~0.75 mi
| Address | Dist | Beds/Ba | Sqft | Sold | Price | $/sf | Match |
|---|---|---|---|---|---|---|---|
| 4217 Northcote Ave | 0.09mi | 3/1.0 | 1,242 (+2%) | 7mo | $110,000 | $89 | 87 |
| 4227 Baring Ave | 0.11mi | 3/1.0 | 1,259 (+3%) | 5mo | $83,000 | $66 | 86 |
| 534 Penrhyn Pl | 0.32mi | 3/1.0 | 1,248 (+2%) | 7mo | $152,000 | $122 | 75 |
| 510 W 142nd St | 0.37mi | 2/1.0 (-1) | 1,256 (+3%) | 4mo | $78,000 | $62 | 69 |
| 4230 Tod Ave | 0.30mi | 2/1.0 (-1) | 1,336 (+10%) | 1mo | $144,000 | $108 | 64 |
| 4105 Homerlee Ave | 0.13mi | 3/1.5 | 1,056 (-13%) | 21mo | $116,000 | $110 | 52 |
Match score weights: distance 35% · size 25% · config 20% · recency 20%. Top-matched comps best support the ARV.
Projected returns pro-forma
-0.3% appreciation · 8.0% rent growth · sell at horizon
- IRR
- 33.4%
- Equity multiple
- 2.70×
- Total profit
- $35,634
- Equity at exit
- $20,646
- IRR
- 39.8%
- Equity multiple
- 6.33×
- Total profit
- $111,904
- Equity at exit
- $23,932
Cash invested: $21,000 (down + closing). Projections, not guarantees.
Landlord ↔ Tenant lean methodology
- Overall (STATE)
- 90 Strongly Landlord-Friendly
- State Indiana
- 90 Strongly Landlord-Friendly · R+11
- County
- — inherits STATE
- City
- — inherits STATE
ZIP-level market 46312
- Home prices YoY
- -0.1%
- Rents YoY
- 8.1%
- Active inventory
- 79
- Price-to-rent
- 4.9×
Monthly cashflow live
- Estimated rent
- $1,282 high interval (Pro) →
- Mortgage (P&I)
- −$393
- Tax from tax record
- −$84 /mo · $1,006/yr
- Insurance
- −$31
- HOA
- −$0
- Vacancy / Maint / Mgmt
- −$269
- Net cashflow
- $504
Break-even live
Sensitivity live
| Price | -10% $547 | -5% $525 | +0% $504 | +5% $483 | +10% $462 |
|---|---|---|---|---|---|
| Rent | -10% $403 | -5% $453 | +0% $504 | +5% $555 | +10% $605 |
| Rate | -1.0pp $542 | -0.5pp $523 | base $504 | +0.5pp $485 | +1.0pp $465 |
UW: 25.0% down · 7.5% · 30yr · 1.5% tax · 5.0% vac · 8.0% maint · 8.0% mgmt
Financing live
Cash to close
- Down payment
- $18,750
- Closing costs
- $2,250
- Reserves months
- —
- Total cash needed
- —
Loan-product check · same deal, 3 products live
Conventional
25% down · 7.5% · 30yr
- Down + closing
- —
- Monthly P&I
- —
- Monthly cashflow
- —
- DSCR
- —
- Eligible?
- —
Personal DTI + credit; lowest rate.
DSCR
20% down · 8.5% · 30yr
- Down + closing
- —
- Monthly P&I
- —
- Monthly cashflow
- —
- DSCR
- —
- Eligible?
- —
No personal income docs; deal must DSCR.
Hard money
10% down · 12.0% · 12mo
- Down + closing
- —
- Monthly P&I
- —
- Monthly cashflow
- —
- DSCR
- —
- Eligible?
- —
Short-term bridge; refi at stabilization.
Rent comps 5 comps
| Address | Beds | Baths | Sqft | Rent | $/sqft | DOM | Units | Dist |
|---|---|---|---|---|---|---|---|---|
| 523 E Columbus Dr East Chicago, IN | 2.0 | 1.0 | 750 | $1,050 | $1.40 | 26d | 1 | 0.35mi |
| 4436 Olcott Ave Unit B East Chicago, IN | 2.0 | 1.0 | 850 | $1,400 | $1.65 | 26d | 1 | 0.43mi |
| 220-2 E Chicago Ave Unit Chicago Ave unit 2F East Chicago, IN | 2.0 | 1.0 | 750 | $1,100 | $1.47 | 26d | 1 | 0.79mi |
| 4001 McCook Ave Unit 2 East Chicago, IN | 3.0 | 1.0 | 960 | $1,650 | $1.72 | 4d | 1 | 1.01mi |
| 1311 E # E Unit Columbus Dr unit 1 East Chicago, IN | 3.0 | 1.5 | 1056 | $1,350 | $1.28 | 9d | 1 | 1.50mi |
Listing history 9 events
-
2026-06-21days on market $75,000 Active 17 DOM
-
2026-06-18days on market $75,000 Active 14 DOM
-
2026-06-17days on market $75,000 Active 13 DOM
-
2026-06-16days on market $75,000 Active 12 DOM
-
2026-06-15days on market $75,000 Active 11 DOM
-
2026-06-13days on market $75,000 Active 9 DOM
-
2026-06-13statusdays on market $75,000 Active 8 DOM
-
2026-02-23status Pending
-
2026-02-17$75,000 Active
ⓘ Source: listings_history table (triggers on properties + properties_extension) + one-shot
backfill from property_details.listing_events for pre-trigger history.
Tax reassessment forecast IN · Partial reset (capped growth)
- Current annual tax
- $1,006 · $84/mo
- Projected year-2 tax
- $1,006 · $84/mo
- Expected delta
- $0/yr ($0/mo · 0.0%)
ⓘ Screening estimate from a state-policy table — verify with the county assessor before closing.
Climate risk First Street
- Flood 4/10 Moderate FEMA zone X (unshaded) · 24% chance over 30 yrs
- Wildfire 1/10 Low
- Heat 3/10 Moderate 7 d/yr ≥101°F today · 15 d/yr by 30 yrs out
- Wind 2/10 Low 100% chance of damaging wind over 30 yrs
- Air quality 4/10 Moderate 5 unhealthy d/yr today · 6 by 30 yrs out
Nearby sold comps map
Loading sold comps map…
Walkable amenities ~0.75 mi
Loading nearby amenities…
Taxation est. · year 1
- Rental income
- $15,379
- − Mortgage interest
- −$4,201
- − Property taxes
- −$1,006
- − Insurance
- −$375
- − Repairs & maintenance
- −$1,230
- − Management
- −$1,230
- − Depreciation
- −$2,182
- Taxable income
- $5,155
- Est. tax owed @ 24.0%
- −$1,237
- After-tax cash flow
- $4,812/yr
For passive investors: Depreciation is non-cash, so a rental often shows a tax loss while cash-flowing — sheltering income. Rental losses are passive: they offset passive income freely, and up to $25,000/yr can offset ordinary (W-2) income if you actively participate and your MAGI is under $100k (phasing out to $0 by $150k); unused losses carry forward. On sale, claimed depreciation is recaptured at up to 25%, and gains may owe capital-gains tax (a 1031 exchange can defer both). Figures are a year-1 estimate at your 24.0% rate — not tax advice; consult a CPA.
Schools (NCES district)
- District
- School City Of East Chicago
- NCES district ID
- 1802880
- Math proficiency
- 7% ▼ -10.00%
- Reading proficiency
- 15% ▼ -7.00%
- Median HH income
- $28,423
- Composite
- 8.36/100
- National rank
- #9909
- State rank
- #293 of 301 in IN
Livability — East Chicago
- Score
- 64/100
- State rank
- #371
- US rank
- #13869
Category grades
Schools grade is shown separately in the Schools card above.
Census & demographics
- Census place
- East Chicago, IN
- County
- Lake County · 422,878 people
- City population
- 26,022
- Metro
- Chicago-Naperville-Elgin, IL-IN-WI
- Population (ZIP)
- 26,022
- Household income
- $42,125
- Rent vs Own
- Severe rent burden
- 1227.0
Population outlook (Lake County) Hauer SSP2
- Today (2025)
- 484,026 people
- By 2030
- 478,091 · -1.2%
- By 2040
- 462,974 · -4.3%
- By 2050
- 449,894 · -7.1%
- By 2075
- 436,169 · -9.9%
- By 2100
- 426,607 · -11.9%
Race, ethnicity, and origin ACS 2023
- Neighborhood character
- Majority Hispanic (56%)
- Race & ethnicity
- Hispanic / Latino 56% Black 36% Two or more races 11% White 7%
- Hispanic origin (detail)
- Mexican 45% Puerto Rican 6%
- Common ancestry
- Romanian 2%
- Foreign-born
- 16% · Canada
- Languages at home
- 59% English-only · Spanish 40%
Political lean MEDSL · Lake
- 2024 margin
- Lean D (+5.6) · D 52.1% · R 46.5% · Other 1.5%
- 2008→2024 swing
- -28.6pp toward R · 2008: 34.3pp · 2024: 5.6pp
- All cycles
- 2024: D+5.6 2020: D+15.1 2016: D+20.6 2012: D+31.0 2008: D+34.3
Not yet ingested
- Civics
- —
Market trends
- HPI YoY
- ▼ -0.30%
- Current HPI
- 267.9232
- Rent YoY
- ▲ 8.06%
- Metro
- Chicago-Naperville-Elgin, IL-IN-WI
- State GDP YoY
- ▲ 2.90%
- F500 in state
- 18
Industry mix (Fortune 500 HQ in IN)
| Industry | F500 HQs | Revenue |
|---|---|---|
| Industrial Machinery | 2 | $37B |
|
||
| Healthcare | 1 | $177B |
|
||
| Pharmaceuticals | 1 | $45B |
|
||
| Metals / Steel | 1 | $18B |
|
||
| Agriculture | 1 | $17B |
|
||
| Packaging | 1 | $12B |
|
||
Price history
2 events — show timeline
- 2026-02-23 Pending — NIRA MLS as Distributed by MLS Grid
- 2026-02-17 Listed $75,000 NIRA MLS as Distributed by MLS Grid
Property tax history
+3.0%/yrLatest (2024): $1,006 · +5.1% YoY. Source: county tax records.
Cash-flow waterfall
monthlySold comps — $/sqft
last 12 mo · ≤1 miLoading sold comps…