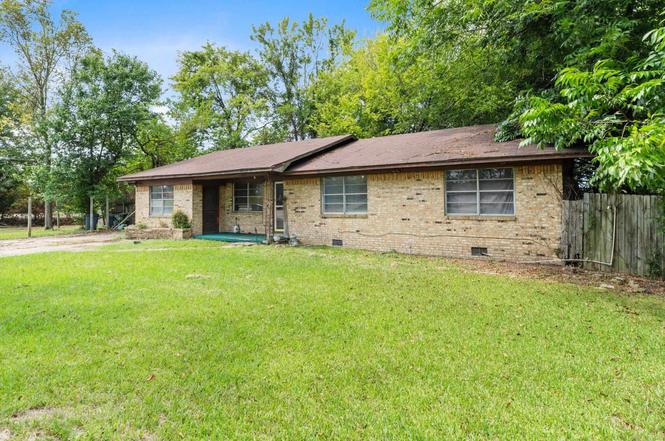
923 California St · Texarkana, AR
Flood risk 1/10 · Minimal
- FEMA flood zone
- X (unshaded)
- Chance of flooding over 30 yrs
- 0.0%
- Est. flood insurance / yr
- $507 – $1,088
Fire risk 3/10 · Minor
- Est. fire insurance / yr
- $1,499 – $2,785
Heat risk 7/10 · Major
- Hot days now (above 112°F)
- 7 days/yr
- Hot days in 30 yrs
- 23 days/yr
Wind risk 5/10 · Moderate
- Chance of severe wind over 30 yrs
- 24.0%
Air-quality risk 2/10 · Minimal
- Unhealthy air days now
- 0 days/yr
- Unhealthy air days in 30 yrs
- 1 days/yr
Risk factors via First Street. Map © Google.
Why this score? — see what drove the C+ grade
The composite is a weighted blend of 9 inputs, each scored 0–100. Each bar is that input's sub-score; the figure is the points it added to the 100-point composite (weight × sub-score).
- Cash flow +30.0/30.0
- 1% rule +10.0/10.0
- DSCR +10.0/10.0
- Livability +3.2/5.0
- Rent growth +2.5/5.0
- Condition / age +2.5/5.0
- Schools +2.1/10.0
- ARV discount +0.0/15.0
- Appreciation +0.0/10.0
$69,900
🖨 Deal sheet 📄 Offer letter ✓ Due diligence
Listing remarks
Investor Special – Motivated Seller! This is your chance to snag a solid fixer-upper with serious upside! Featuring a separate dining room, generously sized bedrooms, a carport, and a fenced backyard with a storage shed, this property is packed with potential. Whether you're looking to flip or hold, this one checks the boxes. Seller is open and ready to make a deal – bring us an offer! Opportunities like this don’t last—schedule your showing today and let’s talk numbers!
Key facts
- Separate dining room
- Carport
- Storage shed
Tags
Property features AI
Exterior
- Parking: Carport for 2 cars
- Utilities: Public sewer; Public water; Municipal electric service (Entergy)
- Home design: Single-family property
- Construction: 3‑tab shingle roof; Slab foundation
- Exterior features: Brick exterior; Level lot in a subdivision; Paved road access
Interior
- Kitchen: Free‑standing stove; Dishwasher; Refrigerator stays
- Flooring: Carpet; Tile
- Bathrooms: 2 full bathrooms
- Heating & cooling: Central electric heating; Central electric cooling
- Interior features: Carpet and tile flooring; Laundry room
- Laundry & utility: Laundry room
Neighborhood map
What this means for you Summary
Snapshot
- This is a 3-bed/2.0-bath single-family listed at $70k.
Deal economics
- At list price, monthly cash flow is $858 ($10k/yr) — positive.
- The deal already cash-flows at list — no discount required.
- Meets the 1% rule at list price ($2k rent vs $70k).
- Recommended offer: $68k (3.0% below list) — sets the bar for market timing.
- Cap rate 21.0% vs local median 4.5% in Texarkana — top-decile yield for the area; either an underpriced asset or a hidden risk that comps aren't pricing in. Stress-test before assuming the spread holds.
Location & tenants
- Location reads 64/100 on livability (#177 in AR) — a middle-class / working-renter tenant base. Strengths: cost of living A+, housing A+, health & safety A-; Watch: schools D, crime F, amenities F.
- Texarkana School District (suburban): math 27% / reading 24% proficiency, ranked #181 of 238 in AR (top 76%) — low school quality limits family demand, transient renter base, plan for 1-2y turnover; 64% free/reduced lunch — lower-income household profile, screen leases tightly.
- Market conditions: 273 active listings in the ZIP; 2 comparable units currently listed for rent nearby; 21 units permitted in Miller County in 2024 (0 in 5+ unit buildings).
- This rent runs 42% of the median local income ($47k/yr) — at the standard rent-burdened threshold; future hikes will face affordability resistance.
Forward outlook
- Local home prices are declining (-3.0%/yr); year-one equity from $483 of loan paydown is wiped out by about $2k of value loss. Plan a longer hold.
- Miller County population projected to shrink 7% by 2050 — rents likely to lag national; underwrite the cash flow, not the appreciation.
- At projected returns (-3.0% appreciation + 3.0% rent growth), your $20k cash investment doubles in ~3 years — after that, you're playing with house money.
Negotiation context
- It's been on market 40 days — a 3% lower offer ($68k) is reasonable based on typical stale-listing flexibility.
- 8 sale attempts with the ask held roughly flat each time — persistent listings suggest the price (not the market) is what's stuck; bring a comps-based counter.
Risks & watch-outs
- Climate carrying-cost: moderate wind risk, 24% chance of damaging wind over 30y; extreme-heat days projected 7→23/yr by 2055 (HVAC capex compounding) — expect insurance premiums to compound above CPI over the hold.
Questions for the listing agent
- It's been on market 40 days. Have you received any prior offers? Is the seller open to a 3% concession, seller financing, or rate buy-down credit?
- Is there a deadline driving the sale (1031 exchange, divorce, estate, relocation)? That informs how much negotiation room exists.
- Schools are D-rated, which usually means shorter tenancies and higher turnover. Who's the typical renter profile here, and what's been the actual vacancy rate?
- Crime grade is F in this area — have there been break-ins, vandalism, or insurance claims at this property in the last 3 years? What carrier currently insures it and at what premium?
- What's the average days-on-market for RENTAL listings here right now (not sales)? A rising rental-DOM trend means longer vacancies and softer asking-rent achievability than the comps imply.
- What's the recent tenant-quality profile in this submarket — average credit score on applications, eviction rate, late-payment / NSF rate, and stable-employment percentage? A property-management company in the area should have these aggregated.
- How much new for-sale + rental construction is in the pipeline within 1–3 miles? Heavy new supply typically softens prices + rents 12–24 months out; constrained supply supports both.
Investment metrics
- 1% rule
- 2.35% ✓
- Cap rate
- 21.03%
- Cash-on-cash
- 52.63%
- DSCR
- 3.34
- GRM
- 3.5
CMA / ARV
- ARV (on-the-fly)
- $53,176
- Comps found
- 2
Show comp detail 2 sales within ~0.75 mi
| Address | Dist | Beds/Ba | Sqft | Sold | Price | $/sf | Match |
|---|---|---|---|---|---|---|---|
| 923 California St | 0.00mi | 3/2.0 | 1,564 (0%) | 1mo | $43,000 | $27 | 99 |
| 2125 Walter St | 0.15mi | 3/2.0 | 1,596 (+2%) | 2mo | $54,000 | $34 | 88 |
Match score weights: distance 35% · size 25% · config 20% · recency 20%. Top-matched comps best support the ARV.
Projected returns pro-forma
-3.0% appreciation · 3.0% rent growth · sell at horizon
- IRR
- 50.6%
- Equity multiple
- 3.21×
- Total profit
- $43,342
- Equity at exit
- $10,422
- IRR
- 56.0%
- Equity multiple
- 6.53×
- Total profit
- $108,136
- Equity at exit
- $6,044
Cash invested: $19,572 (down + closing). Projections, not guarantees.
Landlord ↔ Tenant lean methodology
- Overall (STATE)
- 92 Strongly Landlord-Friendly
- State Arkansas
- 92 Strongly Landlord-Friendly · R+14
- County
- — inherits STATE
- City
- — inherits STATE
ZIP-level market 71854
- Home prices YoY
- -16.9%
- Active inventory
- 273
- Price-to-rent
- 3.5×
Monthly cashflow live
- Estimated rent
- $1,646 medium interval (Pro) →
- Mortgage (P&I)
- −$367
- Tax from tax record
- −$46 /mo · $556/yr
- Insurance
- −$29
- HOA
- −$0
- Vacancy / Maint / Mgmt
- −$346
- Net cashflow
- $858
Break-even live
UW: 25.0% down · 7.5% · 30yr · 1.5% tax · 5.0% vac · 8.0% maint · 8.0% mgmt
Financing live
Cash to close
- Down payment
- $17,475
- Closing costs
- $2,097
- Reserves months
- —
- Total cash needed
- —
Loan-product check · same deal, 3 products live
Conventional
25% down · 7.5% · 30yr
- Down + closing
- —
- Monthly P&I
- —
- Monthly cashflow
- —
- DSCR
- —
- Eligible?
- —
Personal DTI + credit; lowest rate.
DSCR
20% down · 8.5% · 30yr
- Down + closing
- —
- Monthly P&I
- —
- Monthly cashflow
- —
- DSCR
- —
- Eligible?
- —
No personal income docs; deal must DSCR.
Hard money
10% down · 12.0% · 12mo
- Down + closing
- —
- Monthly P&I
- —
- Monthly cashflow
- —
- DSCR
- —
- Eligible?
- —
Short-term bridge; refi at stabilization.
Rent comps 2 comps
| Address | Beds | Baths | Sqft | Rent | $/sqft | DOM | Units | Dist |
|---|---|---|---|---|---|---|---|---|
| 2405 Tyler Ln Texarkana, AR | 3.0 | 2.0 | 1905 | $1,890 | $0.99 | 44d | 1 | 1.21mi |
| 2101 Pecan St Texarkana, AR | 3.0 | 1.0 | 1453 | $1,125 | $0.77 | 44d | 1 | 1.39mi |
Listing history 21 events
-
2026-04-14status Under Contract
-
2026-04-07historical Take Backups
-
2026-04-07historical
-
2026-03-05$69,900 New Listing
-
2026-03-05historical
-
2026-02-05price $69,900
-
2026-02-02$75,000 New Listing
-
2026-02-02historical
-
2026-01-08price $75,000
-
2026-01-01$79,999 New Listing
-
2026-01-01historical
-
2025-12-16status Back on Market
-
2025-12-01status Under Contract
-
2025-10-14$79,999 New Listing
-
2025-10-14historical
-
2025-09-18price $79,999
-
2025-09-10$85,000 New Listing
-
2025-09-10historical
-
2025-07-19$85,000 New Listing
-
2025-07-19historical
-
2025-05-14$99,000 New Listing
ⓘ Source: listings_history table (triggers on properties + properties_extension) + one-shot
backfill from property_details.listing_events for pre-trigger history.
Tax reassessment forecast AR · Resets to sale price
- Current annual tax
- $556 · $46/mo
- Projected year-2 tax
- $556 · $46/mo
- Expected delta
- $0/yr ($0/mo · 0.0%)
ⓘ Screening estimate from a state-policy table — verify with the county assessor before closing.
Climate risk First Street
- Flood 1/10 Low FEMA zone X (unshaded) · 0% chance over 30 yrs
- Wildfire 3/10 Moderate
- Heat 7/10 Severe 7 d/yr ≥112°F today · 23 d/yr by 30 yrs out
- Wind 5/10 Major 24% chance of damaging wind over 30 yrs
- Air quality 2/10 Low 0 unhealthy d/yr today · 1 by 30 yrs out
Nearby sold comps map
Loading sold comps map…
Walkable amenities ~0.75 mi
Loading nearby amenities…
Taxation est. · year 1
- Rental income
- $19,753
- − Mortgage interest
- −$3,915
- − Property taxes
- −$556
- − Insurance
- −$350
- − Repairs & maintenance
- −$1,580
- − Management
- −$1,580
- − Depreciation
- −$2,033
- Taxable income
- $9,738
- Est. tax owed @ 24.0%
- −$2,337
- After-tax cash flow
- $7,963/yr
For passive investors: Depreciation is non-cash, so a rental often shows a tax loss while cash-flowing — sheltering income. Rental losses are passive: they offset passive income freely, and up to $25,000/yr can offset ordinary (W-2) income if you actively participate and your MAGI is under $100k (phasing out to $0 by $150k); unused losses carry forward. On sale, claimed depreciation is recaptured at up to 25%, and gains may owe capital-gains tax (a 1031 exchange can defer both). Figures are a year-1 estimate at your 24.0% rate — not tax advice; consult a CPA.
Schools (NCES district)
- District
- Texarkana School District
- NCES district ID
- 0513110
- Math proficiency
- 27% ▼ -12.00%
- Reading proficiency
- 24% ▼ -9.00%
- Median HH income
- $39,320
- Composite
- 21.47/100
- National rank
- #8332
- State rank
- #181 of 238 in AR
Livability — Texarkana
- Score
- 64/100
- State rank
- #177
- US rank
- #14514
Category grades
Schools grade is shown separately in the Schools card above.
Census & demographics
- Census place
- Texarkana, AR
- County
- Miller County · 35,720 people
- City population
- 35,720
- Metro
- Texarkana, TX-AR
- Population (ZIP)
- 35,720
- Household income
- $46,878
- Rent vs Own
- Severe rent burden
- 1388.0
Population outlook (Miller County) Hauer SSP2
- Today (2025)
- 44,197 people
- By 2030
- 43,844 · -0.8%
- By 2040
- 42,680 · -3.4%
- By 2050
- 41,024 · -7.2%
- By 2075
- 35,685 · -19.3%
- By 2100
- 28,325 · -35.9%
Race, ethnicity, and origin ACS 2023
- Neighborhood character
- Majority White (62%)
- Race & ethnicity
- White 62% Black 30% Hispanic / Latino 4% Two or more races 3%
- Common ancestry
- Lithuanian 1% Slovak 1%
- Foreign-born
- 2% · Canada
- Languages at home
- 98% English-only · Spanish 2%
Political lean MEDSL · Miller
- 2024 margin
- Solid R (+51.1) · D 23.9% · R 74.9% · Other 1.2%
- 2008→2024 swing
- -17.6pp toward R · 2008: -33.5pp · 2024: -51.1pp
- All cycles
- 2024: R+51.1 2020: R+46.4 2016: R+43.8 2012: R+39.8 2008: R+33.5
Not yet ingested
- Civics
- —
Market trends
- HPI YoY
- ▼ -40.00%
- Current HPI
- 196.7615
- Rent YoY
- —
- Metro
- Texarkana, TX-AR
- State GDP YoY
- ▲ 3.80%
- F500 in state
- 10
Industry mix (Fortune 500 HQ in AR)
| Industry | F500 HQs | Revenue |
|---|---|---|
| Retail | 1 | $681B |
|
||
| Food / Agriculture | 1 | $53B |
|
||
| Retail / Energy | 1 | $22B |
|
||
| Transportation / Logistics | 1 | $12B |
|
||
| Energy | 1 | $4B |
|
||
Price history
-29.4% since first listed21 events — show timeline
- 2026-04-14 Pending — CARMLS
- 2026-04-07 Contingent — CARMLS
- 2026-04-07 Listing Removed — CARMLS
- 2026-03-05 Listed $69,900 CARMLS
- 2026-03-05 Listing Removed — CARMLS
- 2026-02-05 Price Changed $69,900 CARMLS
- 2026-02-02 Listed $75,000 CARMLS
- 2026-02-02 Listing Removed — CARMLS
- 2026-01-08 Price Changed $75,000 CARMLS
- 2026-01-01 Listing Removed — CARMLS
- 2026-01-01 Listed $79,999 CARMLS
- 2025-12-16 Relisted — CARMLS
- 2025-12-01 Pending — CARMLS
- 2025-10-14 Listing Removed — CARMLS
- 2025-10-14 Listed $79,999 CARMLS
- 2025-09-18 Price Changed $79,999 CARMLS
- 2025-09-10 Listing Removed — CARMLS
- 2025-09-10 Listed $85,000 CARMLS
- 2025-07-19 Listing Removed — CARMLS
- 2025-07-19 Listed $85,000 CARMLS
- 2025-05-14 Listed $99,000 CARMLS
Property tax history
+10.0%/yrLatest (2025): $556 · +10.0% YoY. Source: county tax records.
Cash-flow waterfall
monthlySold comps — $/sqft
last 12 mo · ≤1 miLoading sold comps…