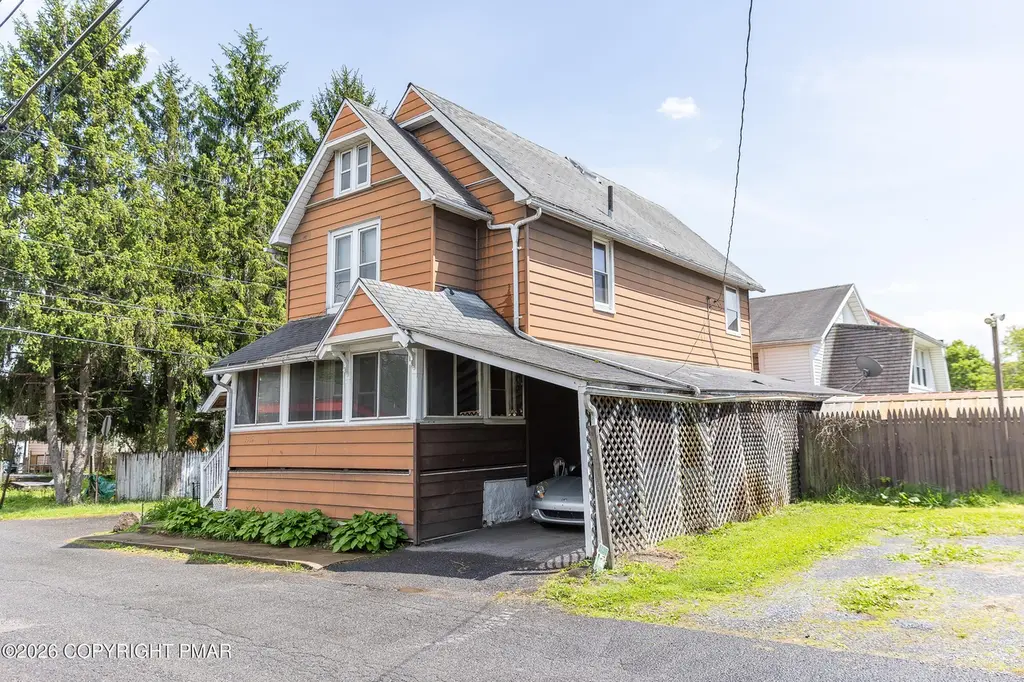
1315 Aubrey Pl · Williamsport, PA
Flood risk 1/10 · Minimal
- FEMA flood zone
- X (shaded)
- Chance of flooding over 30 yrs
- 0.0%
- Est. flood insurance / yr
- $473 – $860
Fire risk 3/10 · Minor
- Est. fire insurance / yr
- $511 – $949
Heat risk 4/10 · Minor
- Hot days now (above 97°F)
- 7 days/yr
- Hot days in 30 yrs
- 16 days/yr
Wind risk 2/10 · Minimal
- Chance of severe wind over 30 yrs
- 1.0%
Air-quality risk 2/10 · Minimal
- Unhealthy air days now
- 0 days/yr
- Unhealthy air days in 30 yrs
- 1 days/yr
Risk factors via First Street. Map © Google.
Why this score? — see what drove the B- grade
The composite is a weighted blend of 9 inputs, each scored 0–100. Each bar is that input's sub-score; the figure is the points it added to the 100-point composite (weight × sub-score).
- Cash flow +25.3/30.0
- ARV discount +15.0/15.0
- DSCR +8.3/10.0
- 1% rule +7.3/10.0
- Livability +3.7/5.0
- Rent growth +3.6/5.0
- Schools +3.5/10.0
- Condition / age +2.5/5.0
- Appreciation +0.0/10.0
$114,900
🖨 Deal sheet 📄 Offer letter ✓ Due diligence
Listing remarks
Welcome to 1315 Aubrey Place a charming colonial-style home located in the heart of Williamsport. This 3-bedroom, 1-bath property offers over 1,100 square feet of living space featuring a spacious living room, formal dining room, and functional kitchen layout perfect for everyday living. Enjoy the character of hardwood and vinyl flooring, a covered front porch, and a fenced yard ideal for outdoor enjoyment. Additional highlights include public utilities, basement storage space, and a convenient 2-car carport. Centrally located near shopping, dining, and major roadways, this home is a great opportunity for homeowners or investors alike!
Key facts
- Covered front porch
- Formal dining room
- Colonial-style home
Tags
Property features AI
Exterior
- Parking: 2 covered spaces; 2 carport spaces; 2 open parking spaces; Off-street paved parking
- Utilities: Public water; Public sewer; 100 amp electric service
- Home design: Single-family house; Residential zoning (R-1); No shared/common walls
- Construction: Built with concrete, glass, stone, and vinyl siding; Stone and concrete perimeter foundation; Fiberglass, shingle, and wood roofing
- Exterior features: Enclosed porch; Partial fencing; Garden area; Paved surfaces (drive/paths); Road frontage on a city street; Publicly maintained road
Interior
- Kitchen: Electric range; Refrigerator
- Bedrooms: Total of 7 rooms (bedroom count not specified)
- Flooring: Carpet; Hardwood; Simulated wood; Vinyl; Other
- Bathrooms: 1 full bathroom
- Heating & cooling: Baseboard heating (oil); Window air conditioning units
- Interior features: Laminate countertops; Storage space; Aluminum-framed windows with blinds; Unfurnished
- Laundry & utility: Laundry in basement; Washer hookup; Gas dryer hookup
Neighborhood map
What this means for you Summary
Snapshot
- This is a 4-bed/1.0-bath single-family listed at $115k.
Deal economics
- At list price, monthly cash flow is $261 ($3k/yr) — positive.
- The deal already cash-flows at list — no discount required.
- Meets the 1% rule at list price ($1k rent vs $115k).
- Recommended offer: $111k (3.0% below list) — sets the bar for market timing.
- Cap rate 9.0% vs local median 5.6% in Williamsport — top-decile yield for the area; either an underpriced asset or a hidden risk that comps aren't pricing in. Stress-test before assuming the spread holds.
Location & tenants
- Location reads 74/100 on livability (#523 in PA, #4,841 nationally) — a middle-class / working-renter tenant base. Strengths: cost of living A+, housing A+, health & safety A+; Watch: crime C-, employment D, amenities F.
- Williamsport Area SD (urban): math 38% / reading 45% proficiency, ranked #349 of 539 in PA (top 65%) — families likely to look elsewhere, expect single-tenant / working-renter base with shorter leases.
- Market conditions: Rents rising fast (+4.4%/yr); 188 active listings in the ZIP; 2 comparable units currently listed for rent nearby; 73 units permitted in Lycoming County in 2024 (15 in 5+ unit buildings).
- This rent runs 32% of the median local income ($53k/yr) — at the standard rent-burdened threshold; future hikes will face affordability resistance.
Forward outlook
- Local home prices are declining (-3.0%/yr); year-one equity from $794 of loan paydown is wiped out by about $3k of value loss. Plan a longer hold.
- Lycoming County population projected to shrink 10% by 2050 — rents likely to lag national; underwrite the cash flow, not the appreciation.
- At projected returns (-3.0% appreciation + 4.4% rent growth), your $32k cash investment doubles in ~10 years — after that, you're playing with house money.
Negotiation context
- It's been on market 37 days — a 3% lower offer ($111k) is reasonable based on typical stale-listing flexibility.
- 4 sale attempts since 11y ago; this cycle's ask has dropped $10k (8%) from the opening price — seller is motivated, your offer sets the floor, not the list.
- Current owner paid $67k; list at $115k implies a 71% gain — meaningful room to come down on a strong offer.
Questions for the listing agent
- It's been on market 37 days. Have you received any prior offers? Is the seller open to a 3% concession, seller financing, or rate buy-down credit?
- Built in 1963 — when were the roof, HVAC, electrical panel, plumbing, and water heater last replaced?
- Is there a deadline driving the sale (1031 exchange, divorce, estate, relocation)? That informs how much negotiation room exists.
- What's the average days-on-market for RENTAL listings here right now (not sales)? A rising rental-DOM trend means longer vacancies and softer asking-rent achievability than the comps imply.
- What's the recent tenant-quality profile in this submarket — average credit score on applications, eviction rate, late-payment / NSF rate, and stable-employment percentage? A property-management company in the area should have these aggregated.
- How much new for-sale + rental construction is in the pipeline within 1–3 miles? Heavy new supply typically softens prices + rents 12–24 months out; constrained supply supports both.
Investment metrics
- 1% rule
- 1.23% ✓
- Cap rate
- 9.02%
- Cash-on-cash
- 9.75%
- DSCR
- 1.43
- GRM
- 6.8
CMA / ARV
- ARV (median comp)
- $210,034
- List price
- $114,900
- Delta
- -45.29%
- Verdict
- UNDERPRICED
- Comps
- 3 within 1.0 mi
Show comp detail 2 sales within ~0.75 mi
| Address | Dist | Beds/Ba | Sqft | Sold | Price | $/sf | Match |
|---|---|---|---|---|---|---|---|
| 925 Cemetery St | 0.29mi | 3/1.5 (-1) | 1,532 (+6%) | 22mo | $230,000 | $150 | 51 |
| 1026 Rural Ave | 0.54mi | 3/2.0 (-1) | 1,560 (+8%) | 15mo | $275,000 | $176 | 40 |
Match score weights: distance 35% · size 25% · config 20% · recency 20%. Top-matched comps best support the ARV.
Projected returns pro-forma
-3.0% appreciation · 4.43% rent growth · sell at horizon
- IRR
- 0.1%
- Equity multiple
- 1.00×
- Total profit
- $142
- Equity at exit
- $17,132
- IRR
- 11.3%
- Equity multiple
- 1.95×
- Total profit
- $30,475
- Equity at exit
- $9,934
Cash invested: $32,172 (down + closing). Projections, not guarantees.
Landlord ↔ Tenant lean methodology
- Overall (STATE)
- 62 Landlord-Friendly
- State Pennsylvania
- 62 Landlord-Friendly · EVEN
- County
- — inherits STATE
- City
- — inherits STATE
ZIP-level market 17701
- Rents YoY
- 4.4%
- Active inventory
- 188
- Price-to-rent
- 6.8×
Monthly cashflow live
- Estimated rent
- $1,408 medium interval (Pro) →
- Mortgage (P&I)
- −$603
- Tax from tax record
- −$201 /mo · $2,410/yr
- Insurance
- −$48
- HOA
- −$0
- Vacancy / Maint / Mgmt
- −$296
- Net cashflow
- $261
Break-even live
UW: 25.0% down · 7.5% · 30yr · 1.5% tax · 5.0% vac · 8.0% maint · 8.0% mgmt
Financing live
Cash to close
- Down payment
- $28,725
- Closing costs
- $3,447
- Reserves months
- —
- Total cash needed
- —
Loan-product check · same deal, 3 products live
Conventional
25% down · 7.5% · 30yr
- Down + closing
- —
- Monthly P&I
- —
- Monthly cashflow
- —
- DSCR
- —
- Eligible?
- —
Personal DTI + credit; lowest rate.
DSCR
20% down · 8.5% · 30yr
- Down + closing
- —
- Monthly P&I
- —
- Monthly cashflow
- —
- DSCR
- —
- Eligible?
- —
No personal income docs; deal must DSCR.
Hard money
10% down · 12.0% · 12mo
- Down + closing
- —
- Monthly P&I
- —
- Monthly cashflow
- —
- DSCR
- —
- Eligible?
- —
Short-term bridge; refi at stabilization.
Rent comps 2 comps
| Address | Beds | Baths | Sqft | Rent | $/sqft | DOM | Units | Dist |
|---|---|---|---|---|---|---|---|---|
| 675 Cemetery St Williamsport, PA | 3.0 | 1.0 | 1185 | $1,200 | $1.01 | 44d | 1 | 0.03mi |
| 1610 Scott St Williamsport, PA | 3.0 | 1.5 | 1680 | $1,350 | $0.80 | 44d | 1 | 0.37mi |
Listing history 21 events
-
2026-06-19days on market $114,900 Active 37 DOM
-
2026-06-18days on market $114,900 Active 36 DOM
-
2026-06-17days on market $114,900 Active 35 DOM
-
2026-06-16days on market $114,900 Active 34 DOM
-
2026-06-15days on market $114,900 Active 33 DOM
-
2026-06-14days on market $114,900 Active 31 DOM
-
2026-06-12days on market $114,900 Active 30 DOM
-
2026-06-09days on market $114,900 Active 27 DOM
-
2026-06-08days on market $114,900 Active 26 DOM
-
2026-06-07days on market $114,900 Active 25 DOM
-
2026-06-05days on market $114,900 Active 22 DOM
-
2026-06-02days on market $114,900 Active 20 DOM
-
2026-06-01days on market $114,900 Active 19 DOM
-
2026-05-31days on market $114,900 Active 18 DOM
-
2026-05-30days on market $114,900 Active 17 DOM
-
2026-05-12$124,900 Active 643-char remark
-
2021-07-22soldstatus $67,000
-
2019-04-26$79,900
-
2018-11-27soldstatus
-
2018-04-04$42,000
-
2015-06-08$44,900
ⓘ Source: listings_history table (triggers on properties + properties_extension) + one-shot
backfill from property_details.listing_events for pre-trigger history.
Tax reassessment forecast PA · Partial reset (capped growth)
- Current annual tax
- $2,410 · $201/mo
- Projected year-2 tax
- $2,410 · $201/mo
- Expected delta
- $0/yr ($0/mo · 0.0%)
ⓘ Screening estimate from a state-policy table — verify with the county assessor before closing.
Climate risk First Street
- Flood 1/10 Low FEMA zone X (shaded) · 0% chance over 30 yrs
- Wildfire 3/10 Moderate
- Heat 4/10 Moderate 7 d/yr ≥97°F today · 16 d/yr by 30 yrs out
- Wind 2/10 Low 100% chance of damaging wind over 30 yrs
- Air quality 2/10 Low 0 unhealthy d/yr today · 1 by 30 yrs out
Nearby sold comps map
Loading sold comps map…
Walkable amenities ~0.75 mi
Loading nearby amenities…
Taxation est. · year 1
- Rental income
- $16,901
- − Mortgage interest
- −$6,436
- − Property taxes
- −$2,410
- − Insurance
- −$574
- − Repairs & maintenance
- −$1,352
- − Management
- −$1,352
- − Depreciation
- −$3,343
- Taxable income
- $1,434
- Est. tax owed @ 24.0%
- −$344
- After-tax cash flow
- $2,793/yr
For passive investors: Depreciation is non-cash, so a rental often shows a tax loss while cash-flowing — sheltering income. Rental losses are passive: they offset passive income freely, and up to $25,000/yr can offset ordinary (W-2) income if you actively participate and your MAGI is under $100k (phasing out to $0 by $150k); unused losses carry forward. On sale, claimed depreciation is recaptured at up to 25%, and gains may owe capital-gains tax (a 1031 exchange can defer both). Figures are a year-1 estimate at your 24.0% rate — not tax advice; consult a CPA.
Schools (NCES district)
- District
- Williamsport Area SD
- NCES district ID
- 4226460
- Math proficiency
- 38% ▼ -9.00%
- Reading proficiency
- 45% ▼ -12.00%
- Median HH income
- $38,637
- Composite
- 34.63/100
- National rank
- #5150
- State rank
- #349 of 539 in PA
Livability — Williamsport
- Score
- 74/100
- State rank
- #523
- US rank
- #4841
Category grades
Schools grade is shown separately in the Schools card above.
Census & demographics
- Census place
- Williamsport, PA
- County
- Lycoming County · 43,104 people
- City population
- 43,104
- Metro
- Williamsport, PA
- Population (ZIP)
- 43,104
- Household income
- $53,237
- Rent vs Own
- Severe rent burden
- 2178.0
Population outlook (Lycoming County) Hauer SSP2
- Today (2025)
- 114,164 people
- By 2030
- 112,221 · -1.7%
- By 2040
- 107,613 · -5.7%
- By 2050
- 102,950 · -9.8%
- By 2075
- 92,987 · -18.5%
- By 2100
- 80,924 · -29.1%
Race, ethnicity, and origin ACS 2023
- Neighborhood character
- Predominantly White (80%)
- Race & ethnicity
- White 80% Black 10% Two or more races 7% Hispanic / Latino 3% Asian 1%
- Common ancestry
- Romanian 3% Lithuanian 2% Slovak 2%
- Foreign-born
- 2% · Canada
- Languages at home
- 96% English-only · Spanish 1% French/Haitian/Cajun 1% German/W. Germanic 1%
Political lean MEDSL · Lycoming
- 2024 margin
- Solid R (+41.5) · D 28.8% · R 70.3%
- 2008→2024 swing
- -17.3pp toward R · 2008: -24.2pp · 2024: -41.5pp
- All cycles
- 2024: R+41.5 2020: R+41.3 2016: R+44.8 2012: R+33.3 2008: R+24.2
Not yet ingested
- Civics
- —
Market trends
- HPI YoY
- ▼ -142.61%
- Current HPI
- 216.7203
- Rent YoY
- ▲ 4.43%
- Metro
- Williamsport, PA
- State GDP YoY
- ▲ 1.68%
- F500 in state
- 34
Industry mix (Fortune 500 HQ in PA)
| Industry | F500 HQs | Revenue |
|---|---|---|
| Healthcare | 2 | $309B |
|
||
| Insurance | 2 | $27B |
|
||
| Telecommunications / Media | 1 | $124B |
|
||
| Industrial Distribution | 1 | $22B |
|
||
| Financial Services | 1 | $20B |
|
||
| Chemicals / Materials | 1 | $18B |
|
||
Price history
+155.9% since first listed7 events — show timeline
- 2026-05-27 Price Changed $114,900 PMAR
- 2026-05-12 Listed $124,900 PMAR
- 2021-07-22 Sold (Public Records) $67,000 Public Records
- 2019-04-26 Listed $79,900 CSVBR
- 2018-11-27 Sold (MLS) — WBVAR
- 2018-04-04 Listed $42,000 WBVAR
- 2015-06-08 Listed $44,900 CSVBR
Property tax history
+2.0%/yrLatest (2026): $2,410 · +2.5% YoY. Source: county tax records.
Cash-flow waterfall
monthlySold comps — $/sqft
last 12 mo · ≤1 miLoading sold comps…