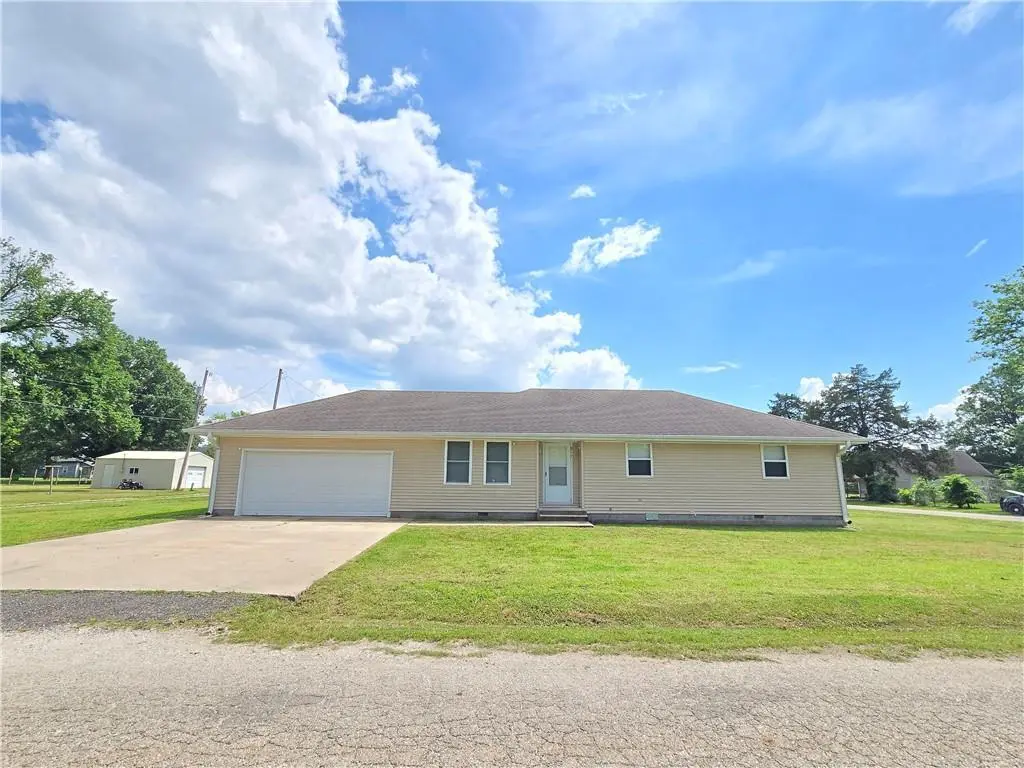
817 W Park St · Cherryvale, KS
Flood risk 1/10 · Minimal
- FEMA flood zone
- X (unshaded)
- Chance of flooding over 30 yrs
- 0.0%
- Est. flood insurance / yr
- $507 – $1,088
Fire risk 6/10 · Moderate
- Est. fire insurance / yr
- $1,154 – $2,142
Heat risk 5/10 · Moderate
- Hot days now (above 108°F)
- 7 days/yr
- Hot days in 30 yrs
- 19 days/yr
Wind risk 2/10 · Minimal
- Chance of severe wind over 30 yrs
- 2.0%
Air-quality risk 2/10 · Minimal
- Unhealthy air days now
- 1 days/yr
- Unhealthy air days in 30 yrs
- 2 days/yr
Risk factors via First Street. Map © Google.
Why this score? — see what drove the D grade
The composite is a weighted blend of 9 inputs, each scored 0–100. Each bar is that input's sub-score; the figure is the points it added to the 100-point composite (weight × sub-score).
- Cash flow +14.4/30.0
- Appreciation +7.2/10.0
- DSCR +4.4/10.0
- 1% rule +4.0/10.0
- Livability +3.4/5.0
- Rent growth +2.5/5.0
- Schools +2.5/10.0
- Condition / age +2.2/5.0
- ARV discount +0.0/15.0
$120,000
🖨 Deal sheet 📄 Offer letter ✓ Due diligence
Listing remarks MLS
For sale in Cherryvale is a three bedroom two bathroom home on a corner lot! New carpet assures the house is fresh and clean for the new owners and the attached garage makes parking hassle free. Check it out today.
Key facts
- Master suite
- Large corner lot
- Dining area
Tags
Property features AI
Finance
- Other: Located inside city limits
- HOA & community: No association fees
Exterior
- Parking: Attached 2-car garage
- Utilities: Public water; Public sewer
- Home design: Single-family residence; Residential property; Ranch style; One story
- Construction: Frame construction; Composition roof; Built approximately 21–30 years ago
- Exterior features: City lot; Paved road with public maintenance; Not in a flood plain
Interior
- Bedrooms: 3 bedrooms (bedroom-level laundry)
- Bathrooms: 2 full bathrooms
- Heating & cooling: Natural gas heating; Electric cooling (central cooling present)
- Interior features: Ranch floor plan; Crawl space basement
- Laundry & utility: Laundry closet on bedroom level
Neighborhood map
What this means for you Summary
Snapshot
- This is a 3-bed/2.0-bath single-family listed at $120k. Condition is rated fair.
Deal economics
- At list price, monthly cash flow is $23 ($278/yr) — positive.
- The deal already cash-flows at list — no discount required.
- To meet the 1% rule (rent ≥ 1% of price), the offer needs to be $108k (10.0% below list).
- Recommended offer: $108k (10.0% below list) — sets the bar for 1% rule.
Location & tenants
- Location reads 68/100 on livability (#214 in KS) — a middle-class / working-renter tenant base. Strengths: cost of living A+, housing A+, health & safety A+; Watch: crime D+, schools F, amenities F.
- Cherryvale (rural): math 24% / reading 35% proficiency, ranked #108 of 169 in KS (top 64%) — low school quality limits family demand, transient renter base, plan for 1-2y turnover.
- Market conditions: 16 active listings in the ZIP; 10 units permitted in Montgomery County in 2024 (0 in 5+ unit buildings).
Forward outlook
- In year one you build about $6k of equity ($830 loan paydown + $5k appreciation (4.3% local appreciation)).
- Montgomery County population projected at -28% by 2050 — secular population decline; favor cash flow + early exit over multi-decade hold.
- At projected returns (4.3% appreciation + 3.0% rent growth), your $34k cash investment doubles in ~5 years — after that, you're playing with house money.
- By year 6, paydown + projected appreciation supports a ~$32k cash-out refi (75% LTV) — recoverable capital for the next deal without selling this one.
Negotiation context
- It's been on market 23 days — a 2% lower offer ($118k) is reasonable based on typical stale-listing flexibility.
- 3 sale attempts since 18y ago with the ask held roughly flat each time — persistent listings suggest the price (not the market) is what's stuck; bring a comps-based counter.
Risks & watch-outs
- Climate carrying-cost: major wildfire risk; extreme-heat days projected 7→19/yr by 2055 (HVAC capex compounding) — expect insurance premiums to compound above CPI over the hold.
Questions for the listing agent
- Have any recent inspections been done? Can we get a copy of the seller's disclosures and any deferred-maintenance estimates?
- Is there a deadline driving the sale (1031 exchange, divorce, estate, relocation)? That informs how much negotiation room exists.
- Schools are F-rated, which usually means shorter tenancies and higher turnover. Who's the typical renter profile here, and what's been the actual vacancy rate?
- Crime grade is D in this area — have there been break-ins, vandalism, or insurance claims at this property in the last 3 years? What carrier currently insures it and at what premium?
- The area grade is low — what's the realistic commute time and amenity access for the typical tenant pool here? Any planned neighborhood developments (good or bad) we should know about?
- What's the average days-on-market for RENTAL listings here right now (not sales)? A rising rental-DOM trend means longer vacancies and softer asking-rent achievability than the comps imply.
- What's the recent tenant-quality profile in this submarket — average credit score on applications, eviction rate, late-payment / NSF rate, and stable-employment percentage? A property-management company in the area should have these aggregated.
- How much new for-sale + rental construction is in the pipeline within 1–3 miles? Heavy new supply typically softens prices + rents 12–24 months out; constrained supply supports both.
Investment metrics
- 1% rule
- 0.90% ✗
- Cap rate
- 6.52%
- Cash-on-cash
- 0.83%
- DSCR
- 1.04
- GRM
- 9.3
CMA / ARV
- ARV (on-the-fly)
- $102,718
- Comps found
- 10
Show comp detail 10 sales within ~0.75 mi
| Address | Dist | Beds/Ba | Sqft | Sold | Price | $/sf | Match |
|---|---|---|---|---|---|---|---|
| 409 S May St | 0.04mi | 3/2.0 | 1,362 (+2%) | 4mo | $120,000 | $88 | 91 |
| 510 W Walnut St Unit S | 0.16mi | 3/2.0 | 1,293 (-3%) | 7mo | $160,000 | $124 | 82 |
| 405 May St | 0.02mi | 3/2.0 | 1,334 (0%) | 21mo | $120,000 | $90 | 81 |
| 904 W 4th St | 0.20mi | 3/2.0 | 1,293 (-3%) | 6mo | $160,000 | $124 | 80 |
| 520 Park St | 0.20mi | 3/1.0 | 1,260 (-6%) | 5mo | $95,000 | $75 | 73 |
| 415 W 2nd St | 0.45mi | 3/2.0 | 1,399 (+5%) | 8mo | $69,000 | $49 | 65 |
| 300 E 3rd St | 0.75mi | 3/1.0 | 1,270 (-5%) | 2mo | $98,000 | $77 | 52 |
| 320 N Liberty St | 0.50mi | 3/1.0 | 1,216 (-9%) | 13mo | $52,000 | $43 | 47 |
| 120 N Liberty St | 0.41mi | 3/2.0 | 1,468 (+10%) | 22mo | $60,000 | $41 | 46 |
| 413 W 2nd St | 0.43mi | 2/1.0 (-1) | 1,480 (+11%) | 21mo | $50,000 | $34 | 35 |
Match score weights: distance 35% · size 25% · config 20% · recency 20%. Top-matched comps best support the ARV.
Projected returns pro-forma
4.31% appreciation · 3.0% rent growth · sell at horizon
- IRR
- 11.8%
- Equity multiple
- 1.73×
- Total profit
- $24,504
- Equity at exit
- $63,057
- IRR
- 13.2%
- Equity multiple
- 3.24×
- Total profit
- $75,233
- Equity at exit
- $104,943
Cash invested: $33,600 (down + closing). Projections, not guarantees.
Landlord ↔ Tenant lean methodology
- Overall (STATE)
- 83 Strongly Landlord-Friendly
- State Kansas
- 83 Strongly Landlord-Friendly · R+10
- County
- — inherits STATE
- City
- — inherits STATE
ZIP-level market 67335
- Home prices YoY
- 3.5%
- Active inventory
- 16
- Price-to-rent
- 9.3×
Monthly cashflow live
- Estimated rent
- $1,080 medium interval (Pro) →
- Mortgage (P&I)
- −$629
- Tax from tax record
- −$151 /mo · $1,813/yr
- Insurance
- −$50
- HOA
- −$0
- Vacancy / Maint / Mgmt
- −$227
- Net cashflow
- $23
Break-even live
UW: 25.0% down · 7.5% · 30yr · 1.5% tax · 5.0% vac · 8.0% maint · 8.0% mgmt
Financing live
Cash to close
- Down payment
- $30,000
- Closing costs
- $3,600
- Reserves months
- —
- Total cash needed
- —
Loan-product check · same deal, 3 products live
Conventional
25% down · 7.5% · 30yr
- Down + closing
- —
- Monthly P&I
- —
- Monthly cashflow
- —
- DSCR
- —
- Eligible?
- —
Personal DTI + credit; lowest rate.
DSCR
20% down · 8.5% · 30yr
- Down + closing
- —
- Monthly P&I
- —
- Monthly cashflow
- —
- DSCR
- —
- Eligible?
- —
No personal income docs; deal must DSCR.
Hard money
10% down · 12.0% · 12mo
- Down + closing
- —
- Monthly P&I
- —
- Monthly cashflow
- —
- DSCR
- —
- Eligible?
- —
Short-term bridge; refi at stabilization.
Listing history 21 events
-
2026-06-18days on market $120,000 Active 23 DOM
-
2026-06-17days on market $120,000 Active 22 DOM
-
2026-06-16days on market $120,000 Active 21 DOM
-
2026-06-15days on market $120,000 Active 20 DOM
-
2026-06-13days on market $120,000 Active 18 DOM
-
2026-06-12days on market $120,000 Active 17 DOM
-
2026-06-09days on market $120,000 Active 14 DOM
-
2026-06-08days on market $120,000 Active 13 DOM
-
2026-06-07days on market $120,000 Active 12 DOM
-
2026-06-05days on market $120,000 Active 10 DOM
-
2026-06-04days on market $120,000 Active 8 DOM
-
2026-06-02days on market $120,000 Active 7 DOM
-
2026-06-01days on market $120,000 Active 6 DOM
-
2026-05-31days on market $120,000 Active 5 DOM
-
2026-05-31days on market $120,000 Active 4 DOM
-
2026-05-27$120,000 Active
-
2026-02-12soldstatus Closed 214-char remark
Show marketing remark (214 chars)
For sale in Cherryvale is a three bedroom two bathroom home on a corner lot! New carpet assures the house is fresh and clean for the new owners and the attached garage makes parking hassle free. Check it out today.
-
2026-01-06status Pending 214-char remark
Show marketing remark (214 chars)
For sale in Cherryvale is a three bedroom two bathroom home on a corner lot! New carpet assures the house is fresh and clean for the new owners and the attached garage makes parking hassle free. Check it out today.
-
2025-10-24$120,000 Active 214-char remark
Show marketing remark (214 chars)
For sale in Cherryvale is a three bedroom two bathroom home on a corner lot! New carpet assures the house is fresh and clean for the new owners and the attached garage makes parking hassle free. Check it out today.
-
2023-10-25historical
-
2008-11-11$72,900
ⓘ Source: listings_history table (triggers on properties + properties_extension) + one-shot
backfill from property_details.listing_events for pre-trigger history.
Tax reassessment forecast KS · Resets to sale price
- Current annual tax
- $1,813 · $151/mo
- Projected year-2 tax
- $1,813 · $151/mo
- Expected delta
- $0/yr ($0/mo · 0.0%)
ⓘ Screening estimate from a state-policy table — verify with the county assessor before closing.
Climate risk First Street
- Flood 1/10 Low FEMA zone X (unshaded) · 0% chance over 30 yrs
- Wildfire 6/10 Major
- Heat 5/10 Major 7 d/yr ≥108°F today · 19 d/yr by 30 yrs out
- Wind 2/10 Low 2% chance of damaging wind over 30 yrs
- Air quality 2/10 Low 1 unhealthy d/yr today · 2 by 30 yrs out
Nearby sold comps map
Loading sold comps map…
Walkable amenities ~0.75 mi
Loading nearby amenities…
Taxation est. · year 1
- Rental income
- $12,965
- − Mortgage interest
- −$6,722
- − Property taxes
- −$1,813
- − Insurance
- −$600
- − Repairs & maintenance
- −$1,037
- − Management
- −$1,037
- − Depreciation
- −$3,491
- Taxable loss
- −$1,735
- Est. tax savings @ 24.0%
- +$416
- After-tax cash flow
- $695/yr
For passive investors: Depreciation is non-cash, so a rental often shows a tax loss while cash-flowing — sheltering income. Rental losses are passive: they offset passive income freely, and up to $25,000/yr can offset ordinary (W-2) income if you actively participate and your MAGI is under $100k (phasing out to $0 by $150k); unused losses carry forward. On sale, claimed depreciation is recaptured at up to 25%, and gains may owe capital-gains tax (a 1031 exchange can defer both). Figures are a year-1 estimate at your 24.0% rate — not tax advice; consult a CPA.
Condition & rehab AI · 12 photos
This home requires moderate repairs and updates to its exterior and interior, but presents a good opportunity for renovation to increase its value.
Repairs flagged
- Moderate Exterior siding — Weathered and in need of replacement
- Moderate Roof — Aged and may need replacement
Value-add opportunities
- Both Paint interior walls — Fresh paint enhances curb appeal and interior aesthetics
- Both Replace carpet in living areas — New carpet improves comfort and appearance
- Both Update kitchen cabinets and appliances — Modern kitchen enhances functionality and appeal
- Both Update bathrooms — Fresh bathrooms improve functionality and aesthetics
Renovation cost estimate screening
| Repair item | Severity | Est. cost |
|---|---|---|
| Exterior siding · Weathered and in need of replacement | Moderate | $3,000–15,000 |
| Roof · Aged and may need replacement | Moderate | $3,000–15,000 |
| Total estimated repair cost · 2 items | $6,000–30,000 |
Value-add ROI direction
- Both Paint interior walls — Fresh paint enhances curb appeal and interior aesthetics ↑
- Both Replace carpet in living areas — New carpet improves comfort and appearance ↑
- Both Update kitchen cabinets and appliances — Modern kitchen enhances functionality and appeal ↑
- Both Update bathrooms — Fresh bathrooms improve functionality and aesthetics ↑
ⓘ Cost ranges are severity-bucket heuristics (US national rule-of-thumb). Get contractor quotes + a written scope before underwriting a rehab budget.
Schools (NCES district)
- District
- Cherryvale
- NCES district ID
- 2004740
- Math proficiency
- 24% ▲ 1.00%
- Reading proficiency
- 35% ▲ 6.00%
- Median HH income
- $43,161
- Composite
- 25.1/100
- National rank
- #7531
- State rank
- #108 of 169 in KS
Livability — Cherryvale
- Score
- 68/100
- State rank
- #214
- US rank
- #9510
Category grades
Schools grade is shown separately in the Schools card above.
Census & demographics
- Census place
- Cherryvale, KS
- Population (ZIP)
- 3,300
Population outlook (Montgomery County) Hauer SSP2
- Today (2025)
- 29,729 people
- By 2030
- 27,786 · -6.5%
- By 2040
- 24,201 · -18.6%
- By 2050
- 21,280 · -28.4%
- By 2075
- 16,754 · -43.6%
- By 2100
- 14,088 · -52.6%
Race, ethnicity, and origin ACS 2023
- Neighborhood character
- Predominantly White (94%)
- Race & ethnicity
- White 94% Two or more races 4% Hispanic / Latino 2% Native American 1%
- Common ancestry
- Slovak 2% Iranian 2% Italian 1%
- Foreign-born
- 1% · Canada
- Languages at home
- 98% English-only · Spanish 1% Arabic 1%
Political lean MEDSL · Montgomery
- 2024 margin
- Solid R (+51.1) · D 23.6% · R 74.7% · Other 1.8%
- 2008→2024 swing
- -15.3pp toward R · 2008: -35.8pp · 2024: -51.1pp
- All cycles
- 2024: R+51.1 2020: R+50.2 2016: R+50.8 2012: R+41.4 2008: R+35.8
Not yet ingested
- Civics
- —
Market trends
- HPI YoY
- ▲ 4.31%
- Current HPI
- 128.0231
- Rent YoY
- —
- Metro
- —
- State GDP YoY
- —
- F500 in state
- 0
Price history
+64.6% since first listed6 events — show timeline
- 2026-05-27 Listed $120,000 Heartland MLS as Distributed by MLS Grid
- 2026-02-12 Sold (MLS) — Heartland MLS as Distributed by MLS Grid
- 2026-01-06 Pending — Heartland MLS as Distributed by MLS Grid
- 2025-10-24 Listed $120,000 Heartland MLS as Distributed by MLS Grid
- 2023-10-25 Listing Removed — Heartland MLS as Distributed by MLS Grid
- 2008-11-11 Listed $72,900 Heartland MLS as Distributed by MLS Grid
Cash-flow waterfall
monthlySold comps — $/sqft
last 12 mo · ≤1 miLoading sold comps…