427 Capitol St · Palmona Park, FL
Flood risk 3/10 · Minor
- FEMA flood zone
- A
- Chance of flooding over 30 yrs
- 0.12%
- Est. flood insurance / yr
- $1,009 – $1,996
Fire risk 3/10 · Minor
- Est. fire insurance / yr
- $947 – $1,759
Heat risk 10/10 · Severe
- Hot days now (above 106°F)
- 6 days/yr
- Hot days in 30 yrs
- 23 days/yr
Wind risk 10/10 · Severe
- Chance of severe wind over 30 yrs
- 99.0%
Air-quality risk 2/10 · Minimal
- Unhealthy air days now
- 1 days/yr
- Unhealthy air days in 30 yrs
- 1 days/yr
Risk factors via First Street. Map © Google.
Why this score? — see what drove the B- grade
The composite is a weighted blend of 9 inputs, each scored 0–100. Each bar is that input's sub-score; the figure is the points it added to the 100-point composite (weight × sub-score).
- Cash flow +29.3/30.0
- DSCR +10.0/10.0
- 1% rule +7.7/10.0
- ARV discount +7.5/15.0
- Schools +4.1/10.0
- Livability +2.8/5.0
- Condition / age +2.5/5.0
- Rent growth +2.0/5.0
- Appreciation +0.0/10.0
$147,500
🖨 Deal sheet 📄 Offer letter ✓ Due diligence
Listing remarks MLS
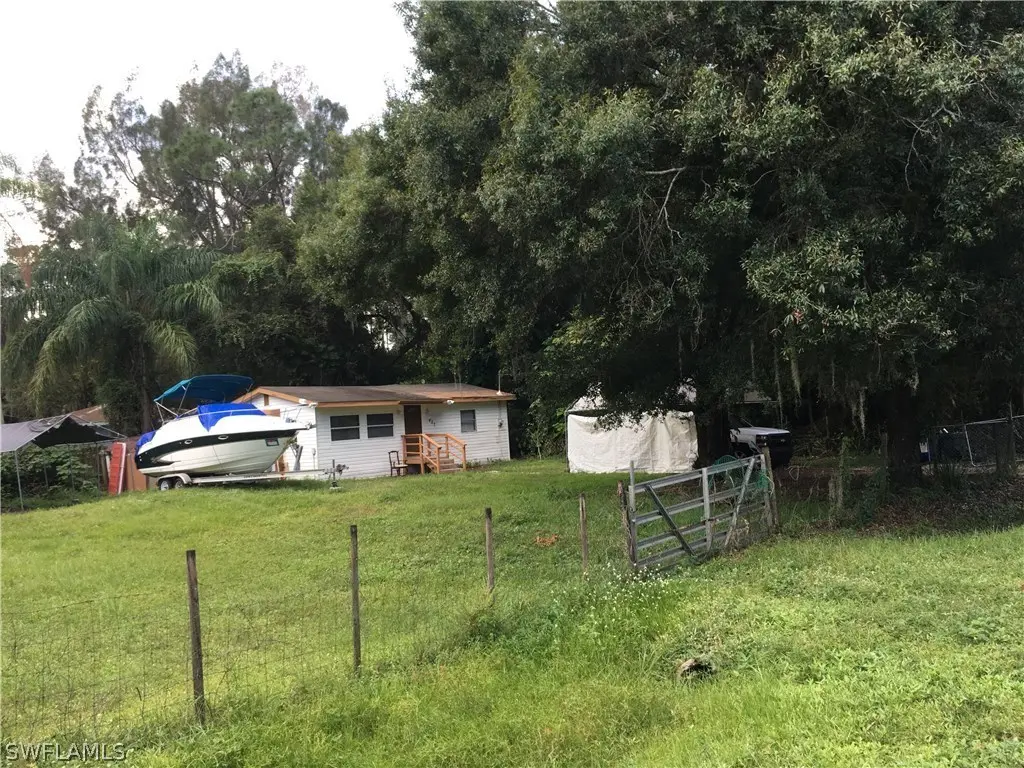
EXCELLENT LOCATION AT NORTH FORT MYERS, EXTRA SIZED CORNER LOT IN ATLANTIC AVE WITH CAPITOL STREET. BEAUTIFUL RENOVATED HOUSE, INTERIOR AREA: 660 S/F UNDER A/C. 2.5 TON NEW A/C. RENOVATED KITCHEN WITH NICE WHITE CABINETS, MUST SEE IT. THE LOT IS BIG ENOUGH TO KEEP BOATS OR MAYBE TO BUILD ANOTHER HOUSE. CLOSE TO WALMART, RESTAURANTS AND COMMERCIAL AREA. CITY WATER AND CLOSE TO THE BUS STOP.
Key facts
- Tile throughout
- Fully fenced in yard
- 0.23 acre lot
Tags
Property features AI
Finance
- Other: Zoning: RS-1; Oversize lot; Lot dimensions approx. 100 x 100; Lot area approx. 0.2298 acres; Source of lot dimensions: Property Appraiser Office; Possession at closing
- HOA & community: No HOA maintenance or amenities; Non-gated community; Subdivision: Palmona Park
Exterior
- Utilities: Central water; Central sewer; Cable available
- Home design: Single family residence; 1-story ranch; South rear exposure; Residential property
- Construction: Wood frame construction; Vinyl siding exterior; Shingle roof; Built in 1962
- Exterior features: Fence; Room for pool; Landscaped view
Interior
- Kitchen: Range; Microwave; Refrigerator/Freezer
- Bedrooms: 2 bedrooms
- Flooring: Tile
- Bathrooms: 1 full bathroom; No master bathroom
- Heating & cooling: Central electric heating; Central electric cooling
- Interior features: High-speed internet available; Smoke detectors; Great room floor plan; Balcony
- Laundry & utility: Washer; Dryer
Neighborhood map
What this means for you Summary
Snapshot
- This is a 2-bed/1.0-bath single-family listed at $148k.
Deal economics
- At list price, monthly cash flow is $395 ($5k/yr) — positive.
- The deal already cash-flows at list — no discount required.
- Meets the 1% rule at list price ($2k rent vs $148k).
- Recommended offer: $139k (6.0% below list) — sets the bar for market timing.
Location & tenants
- Location reads 55/100 on livability (#875 in FL) — a working-class tenant base; expect higher turnover. Strengths: cost of living A+, crime A, health & safety A; Watch: schools F, amenities F, commute F.
- Lee (suburban): math 47% / reading 50% proficiency, ranked #42 of 73 in FL (top 58%) — families likely to look elsewhere, expect single-tenant / working-renter base with shorter leases.
- Market conditions: Rents soft (-1.9%/yr); 472 active listings in the ZIP; 4 comparable units currently listed for rent nearby; rentals at typical pace (median 24d on market — plan ~3-4 weeks tenant-placement turnaround); 15,411 units permitted in Lee County in 2024 (4,686 in 5+ unit buildings).
- This rent runs 39% of the median local income ($57k/yr) — at the standard rent-burdened threshold; future hikes will face affordability resistance.
Forward outlook
- Local home prices are declining (-3.0%/yr); year-one equity from $1k of loan paydown is wiped out by about $4k of value loss. Plan a longer hold.
- Lee County population projected at +44% by 2050 — long-run rental-demand tailwind backs the buy-and-hold thesis.
Negotiation context
- It's been on market 70 days — a 6% lower offer ($139k) is reasonable based on typical stale-listing flexibility.
- 6 sale attempts since 28y ago with the ask held roughly flat each time — persistent listings suggest the price (not the market) is what's stuck; bring a comps-based counter.
- Current owner paid $78k; list at $148k implies a 90% gain — meaningful room to come down on a strong offer.
Risks & watch-outs
- Watch-outs: flood insurance adds $125/mo.
- Climate carrying-cost: in FEMA flood zone A (mandatory federal flood insurance); severe wind risk, 99% chance of damaging wind over 30y; extreme-heat days projected 6→23/yr by 2055 (HVAC capex compounding) — expect insurance premiums to compound above CPI over the hold.
Questions for the listing agent
- It's been on market 70 days. Have you received any prior offers? Is the seller open to a 6% concession, seller financing, or rate buy-down credit?
- Built in 1962 — when were the roof, HVAC, electrical panel, plumbing, and water heater last replaced?
- What's the actual annual flood-insurance premium (NFIP or private), and is the property in a SFHA with mandatory coverage?
- Why hasn't it sold? Are there any deal-killer items the seller is aware of (foundation, flood, title, zoning, code violations)?
- Is there a deadline driving the sale (1031 exchange, divorce, estate, relocation)? That informs how much negotiation room exists.
- Schools are F-rated, which usually means shorter tenancies and higher turnover. Who's the typical renter profile here, and what's been the actual vacancy rate?
- What's the average days-on-market for RENTAL listings here right now (not sales)? A rising rental-DOM trend means longer vacancies and softer asking-rent achievability than the comps imply.
- What's the recent tenant-quality profile in this submarket — average credit score on applications, eviction rate, late-payment / NSF rate, and stable-employment percentage? A property-management company in the area should have these aggregated.
- How much new for-sale + rental construction is in the pipeline within 1–3 miles? Heavy new supply typically softens prices + rents 12–24 months out; constrained supply supports both.
Investment metrics
- 1% rule
- 1.27% ✓
- Cap rate
- 10.52%
- Cash-on-cash
- 15.11%
- DSCR
- 1.67
- GRM
- 6.6
CMA / ARV
No comps found within radius.
Projected returns pro-forma
-3.0% appreciation · 0.0% rent growth · sell at horizon
- IRR
- -2.8%
- Equity multiple
- 0.90×
- Total profit
- $-4,164
- Equity at exit
- $21,993
- IRR
- 3.1%
- Equity multiple
- 1.19×
- Total profit
- $7,846
- Equity at exit
- $12,753
Cash invested: $41,300 (down + closing). Projections, not guarantees.
Landlord ↔ Tenant lean methodology
- Overall (STATE)
- 87 Strongly Landlord-Friendly
- State Florida
- 87 Strongly Landlord-Friendly · R+3
- County
- — inherits STATE
- City
- — inherits STATE
ZIP-level market 33903
- Rents YoY
- -1.9%
- Active inventory
- 472
- Price-to-rent
- 6.6×
Monthly cashflow live
- Estimated rent
- $1,871 medium interval (Pro) →
- Mortgage (P&I)
- −$774
- Tax from tax record
- −$123 /mo · $1,477/yr
- Insurance
- −$61
- Flood insurance flood zone
- −$125 /mo · $1,502/yr
- HOA
- −$0
- Vacancy / Maint / Mgmt
- −$393
- Net cashflow
- $395
Break-even live
UW: 25.0% down · 7.5% · 30yr · 1.5% tax · 5.0% vac · 8.0% maint · 8.0% mgmt
Financing live
Cash to close
- Down payment
- $36,875
- Closing costs
- $4,425
- Reserves months
- —
- Total cash needed
- —
Loan-product check · same deal, 3 products live
Conventional
25% down · 7.5% · 30yr
- Down + closing
- —
- Monthly P&I
- —
- Monthly cashflow
- —
- DSCR
- —
- Eligible?
- —
Personal DTI + credit; lowest rate.
DSCR
20% down · 8.5% · 30yr
- Down + closing
- —
- Monthly P&I
- —
- Monthly cashflow
- —
- DSCR
- —
- Eligible?
- —
No personal income docs; deal must DSCR.
Hard money
10% down · 12.0% · 12mo
- Down + closing
- —
- Monthly P&I
- —
- Monthly cashflow
- —
- DSCR
- —
- Eligible?
- —
Short-term bridge; refi at stabilization.
Rent comps 4 comps
| Address | Beds | Baths | Sqft | Rent | $/sqft | DOM | Units | Dist |
|---|---|---|---|---|---|---|---|---|
| 3260 Stockton St North Fort Myers, FL | 3.0 | 1.0–2.0 | 976 | $2,371 | $2.43 | 2d | 27 | 0.39mi |
| 240 W Mariana Ave Apt B North Fort Myers, FL | 1.0 | 1.0 | 600 | $1,295 | $2.16 | 24d | 1 | 0.72mi |
| 2700 Diplomat Pkwy E Cape Coral, FL | 1.0–3.0 | 1.0–2.0 | 1116 | $2,382 | $2.13 | 3d | 41 | 0.99mi |
| 1640 Daniels Dr Unit B North Fort Myers, FL | 1.0 | 1.0 | 400 | $1,099 | $2.75 | 24d | 1 | 1.32mi |
Listing history 25 events
-
2026-04-10price $147,500
-
2026-04-03price $149,000
-
2026-03-17$150,000 Active
-
2025-10-06soldstatus $77,500
-
2024-12-07historical
-
2024-11-28price $122,990
-
2024-11-21price $124,990
-
2024-11-15$139,990 Active
-
2017-02-24price $63,000 392-char remark
Show marketing remark (392 chars)
EXCELLENT LOCATION AT NORTH FORT MYERS, EXTRA SIZED CORNER LOT IN ATLANTIC AVE WITH CAPITOL STREET. BEAUTIFUL RENOVATED HOUSE, INTERIOR AREA: 660 S/F UNDER A/C. 2.5 TON NEW A/C. RENOVATED KITCHEN WITH NICE WHITE CABINETS, MUST SEE IT. THE LOT IS BIG ENOUGH TO KEEP BOATS OR MAYBE TO BUILD ANOTHER HOUSE. CLOSE TO WALMART, RESTAURANTS AND COMMERCIAL AREA. CITY WATER AND CLOSE TO THE BUS STOP.
-
2017-02-17soldstatus $63,000
-
2017-02-16soldstatus $63,000 Sold 392-char remark
Show marketing remark (392 chars)
EXCELLENT LOCATION AT NORTH FORT MYERS, EXTRA SIZED CORNER LOT IN ATLANTIC AVE WITH CAPITOL STREET. BEAUTIFUL RENOVATED HOUSE, INTERIOR AREA: 660 S/F UNDER A/C. 2.5 TON NEW A/C. RENOVATED KITCHEN WITH NICE WHITE CABINETS, MUST SEE IT. THE LOT IS BIG ENOUGH TO KEEP BOATS OR MAYBE TO BUILD ANOTHER HOUSE. CLOSE TO WALMART, RESTAURANTS AND COMMERCIAL AREA. CITY WATER AND CLOSE TO THE BUS STOP.
-
2017-02-16price $67,000 392-char remark
Show marketing remark (392 chars)
EXCELLENT LOCATION AT NORTH FORT MYERS, EXTRA SIZED CORNER LOT IN ATLANTIC AVE WITH CAPITOL STREET. BEAUTIFUL RENOVATED HOUSE, INTERIOR AREA: 660 S/F UNDER A/C. 2.5 TON NEW A/C. RENOVATED KITCHEN WITH NICE WHITE CABINETS, MUST SEE IT. THE LOT IS BIG ENOUGH TO KEEP BOATS OR MAYBE TO BUILD ANOTHER HOUSE. CLOSE TO WALMART, RESTAURANTS AND COMMERCIAL AREA. CITY WATER AND CLOSE TO THE BUS STOP.
-
2017-01-17status Pending 392-char remark
Show marketing remark (392 chars)
EXCELLENT LOCATION AT NORTH FORT MYERS, EXTRA SIZED CORNER LOT IN ATLANTIC AVE WITH CAPITOL STREET. BEAUTIFUL RENOVATED HOUSE, INTERIOR AREA: 660 S/F UNDER A/C. 2.5 TON NEW A/C. RENOVATED KITCHEN WITH NICE WHITE CABINETS, MUST SEE IT. THE LOT IS BIG ENOUGH TO KEEP BOATS OR MAYBE TO BUILD ANOTHER HOUSE. CLOSE TO WALMART, RESTAURANTS AND COMMERCIAL AREA. CITY WATER AND CLOSE TO THE BUS STOP.
-
2017-01-16price $67,000 392-char remark
Show marketing remark (392 chars)
EXCELLENT LOCATION AT NORTH FORT MYERS, EXTRA SIZED CORNER LOT IN ATLANTIC AVE WITH CAPITOL STREET. BEAUTIFUL RENOVATED HOUSE, INTERIOR AREA: 660 S/F UNDER A/C. 2.5 TON NEW A/C. RENOVATED KITCHEN WITH NICE WHITE CABINETS, MUST SEE IT. THE LOT IS BIG ENOUGH TO KEEP BOATS OR MAYBE TO BUILD ANOTHER HOUSE. CLOSE TO WALMART, RESTAURANTS AND COMMERCIAL AREA. CITY WATER AND CLOSE TO THE BUS STOP.
-
2017-01-16status Active 392-char remark
Show marketing remark (392 chars)
EXCELLENT LOCATION AT NORTH FORT MYERS, EXTRA SIZED CORNER LOT IN ATLANTIC AVE WITH CAPITOL STREET. BEAUTIFUL RENOVATED HOUSE, INTERIOR AREA: 660 S/F UNDER A/C. 2.5 TON NEW A/C. RENOVATED KITCHEN WITH NICE WHITE CABINETS, MUST SEE IT. THE LOT IS BIG ENOUGH TO KEEP BOATS OR MAYBE TO BUILD ANOTHER HOUSE. CLOSE TO WALMART, RESTAURANTS AND COMMERCIAL AREA. CITY WATER AND CLOSE TO THE BUS STOP.
-
2016-11-16status Pending 392-char remark
Show marketing remark (392 chars)
EXCELLENT LOCATION AT NORTH FORT MYERS, EXTRA SIZED CORNER LOT IN ATLANTIC AVE WITH CAPITOL STREET. BEAUTIFUL RENOVATED HOUSE, INTERIOR AREA: 660 S/F UNDER A/C. 2.5 TON NEW A/C. RENOVATED KITCHEN WITH NICE WHITE CABINETS, MUST SEE IT. THE LOT IS BIG ENOUGH TO KEEP BOATS OR MAYBE TO BUILD ANOTHER HOUSE. CLOSE TO WALMART, RESTAURANTS AND COMMERCIAL AREA. CITY WATER AND CLOSE TO THE BUS STOP.
-
2016-10-21$68,900 Active 392-char remark
Show marketing remark (392 chars)
EXCELLENT LOCATION AT NORTH FORT MYERS, EXTRA SIZED CORNER LOT IN ATLANTIC AVE WITH CAPITOL STREET. BEAUTIFUL RENOVATED HOUSE, INTERIOR AREA: 660 S/F UNDER A/C. 2.5 TON NEW A/C. RENOVATED KITCHEN WITH NICE WHITE CABINETS, MUST SEE IT. THE LOT IS BIG ENOUGH TO KEEP BOATS OR MAYBE TO BUILD ANOTHER HOUSE. CLOSE TO WALMART, RESTAURANTS AND COMMERCIAL AREA. CITY WATER AND CLOSE TO THE BUS STOP.
-
2005-12-03historical
-
2005-10-13$114,900
-
2002-12-17soldstatus $50,000
-
2002-12-10soldstatus $50,000
-
2002-11-06price $55,000
-
1999-03-09soldstatus $29,000
-
1998-07-24$29,900
-
1990-10-03soldstatus $25,900
ⓘ Source: listings_history table (triggers on properties + properties_extension) + one-shot
backfill from property_details.listing_events for pre-trigger history.
Tax reassessment forecast FL · Resets to sale price
- Current annual tax
- $1,477 · $123/mo
- Projected year-2 tax
- $1,477 · $123/mo
- Expected delta
- $0/yr ($0/mo · 0.0%)
ⓘ Screening estimate from a state-policy table — verify with the county assessor before closing.
Climate risk First Street
- Flood 3/10 Moderate FEMA zone A · 12% chance over 30 yrs
- Wildfire 3/10 Moderate
- Heat 10/10 Extreme 6 d/yr ≥106°F today · 23 d/yr by 30 yrs out
- Wind 10/10 Extreme 99% chance of damaging wind over 30 yrs
- Air quality 2/10 Low 1 unhealthy d/yr today · 1 by 30 yrs out
Nearby sold comps map
Loading sold comps map…
Walkable amenities ~0.75 mi
Loading nearby amenities…
Taxation est. · year 1
- Rental income
- $22,453
- − Mortgage interest
- −$8,262
- − Property taxes
- −$1,477
- − Insurance
- −$2,240
- − Repairs & maintenance
- −$1,796
- − Management
- −$1,796
- − Depreciation
- −$4,291
- Taxable income
- $2,591
- Est. tax owed @ 24.0%
- −$622
- After-tax cash flow
- $4,117/yr
For passive investors: Depreciation is non-cash, so a rental often shows a tax loss while cash-flowing — sheltering income. Rental losses are passive: they offset passive income freely, and up to $25,000/yr can offset ordinary (W-2) income if you actively participate and your MAGI is under $100k (phasing out to $0 by $150k); unused losses carry forward. On sale, claimed depreciation is recaptured at up to 25%, and gains may owe capital-gains tax (a 1031 exchange can defer both). Figures are a year-1 estimate at your 24.0% rate — not tax advice; consult a CPA.
Schools (NCES district)
- District
- Lee
- NCES district ID
- 1201080
- Math proficiency
- 47% ▼ -11.00%
- Reading proficiency
- 50% ▼ -4.00%
- Median HH income
- $49,518
- Composite
- 41.49/100
- National rank
- #3458
- State rank
- #42 of 73 in FL
Livability — Palmona Park
- Score
- 55/100
- State rank
- #875
- US rank
- #23153
Category grades
Schools grade is shown separately in the Schools card above.
Census & demographics
- Census place
- Palmona Park, FL
- County
- Lee County · 788,662 people
- Metro
- Cape Coral-Fort Myers, FL
- Population (ZIP)
- 23,655
- Household income
- $56,993
- Rent vs Own
- Severe rent burden
- 468.0
Population outlook (Lee County) Hauer SSP2
- Today (2025)
- 871,946 people
- By 2030
- 955,468 · +9.6%
- By 2040
- 1,113,587 · +27.7%
- By 2050
- 1,256,891 · +44.1%
- By 2075
- 1,560,270 · +78.9%
- By 2100
- 1,726,848 · +98.0%
Race, ethnicity, and origin ACS 2023
- Neighborhood character
- Predominantly White (81%)
- Race & ethnicity
- White 81% Hispanic / Latino 14% Two or more races 8% Black 2%
- Hispanic origin (detail)
- Mexican 3% Puerto Rican 3% Cuban 3%
- Common ancestry
- Lithuanian 4% Romanian 4% Italian 3%
- Foreign-born
- 11% · Canada
- Languages at home
- 88% English-only · Spanish 9% Other Indo-European 1%
Political lean MEDSL · Lee
- 2024 margin
- Strong R (+28.4) · D 35.5% · R 63.9%
- 2008→2024 swing
- -18.0pp toward R · 2008: -10.4pp · 2024: -28.4pp
- All cycles
- 2024: R+28.4 2020: R+19.2 2016: R+20.4 2012: R+16.6 2008: R+10.4
Not yet ingested
- Civics
- —
Market trends
- HPI YoY
- ▼ -172.26%
- Current HPI
- 256.773
- Rent YoY
- ▼ -1.94%
- Metro
- Cape Coral-Fort Myers, FL
- State GDP YoY
- ▲ 3.28%
- F500 in state
- 36
Industry mix (Fortune 500 HQ in FL)
| Industry | F500 HQs | Revenue |
|---|---|---|
| Industrial Technology | 2 | $29B |
|
||
| Insurance | 2 | $17B |
|
||
| Retail | 1 | $60B |
|
||
| Technology Distribution | 1 | $58B |
|
||
| Homebuilding | 1 | $35B |
|
||
| Technology Manufacturing | 1 | $35B |
|
||
Price history
+469.5% since first listed25 events — show timeline
- 2026-04-10 Price Changed $147,500 NAPLESMLS
- 2026-04-03 Price Changed $149,000 NAPLESMLS
- 2026-03-17 Listed $150,000 NAPLESMLS
- 2025-10-06 Sold (Public Records) $77,500 Public Records
- 2024-12-07 Listing Removed — FORTMLS
- 2024-11-28 Price Changed $122,990 FORTMLS
- 2024-11-21 Price Changed $124,990 FORTMLS
- 2024-11-15 Listed $139,990 FORTMLS
- 2017-02-24 Price Changed $63,000 FORTMLS
- 2017-02-17 Sold (Public Records) $63,000 Public Records
- 2017-02-16 Price Changed $67,000 FORTMLS
- 2017-02-16 Sold (MLS) $63,000 FORTMLS
- 2017-01-17 Pending — FORTMLS
- 2017-01-16 Price Changed $67,000 FORTMLS
- 2017-01-16 Relisted — FORTMLS
- 2016-11-16 Pending — FORTMLS
- 2016-10-21 Listed $68,900 FORTMLS
- 2005-12-03 Listing Removed — FORTMLS
- 2005-10-13 Listed $114,900 FORTMLS
- 2002-12-17 Sold (Public Records) $50,000 Public Records
- 2002-12-10 Sold (MLS) $50,000 FORTMLS
- 2002-11-06 Price Changed $55,000 FORTMLS
- 1999-03-09 Sold (Public Records) $29,000 Public Records
- 1998-07-24 Listed $29,900 FORTMLS
- 1990-10-03 Sold (Public Records) $25,900 Public Records
Property tax history
+11.5%/yrLatest (2025): $1,477 · +2.7% YoY. Source: county tax records.
Cash-flow waterfall
monthlySold comps — $/sqft
last 12 mo · ≤1 miLoading sold comps…