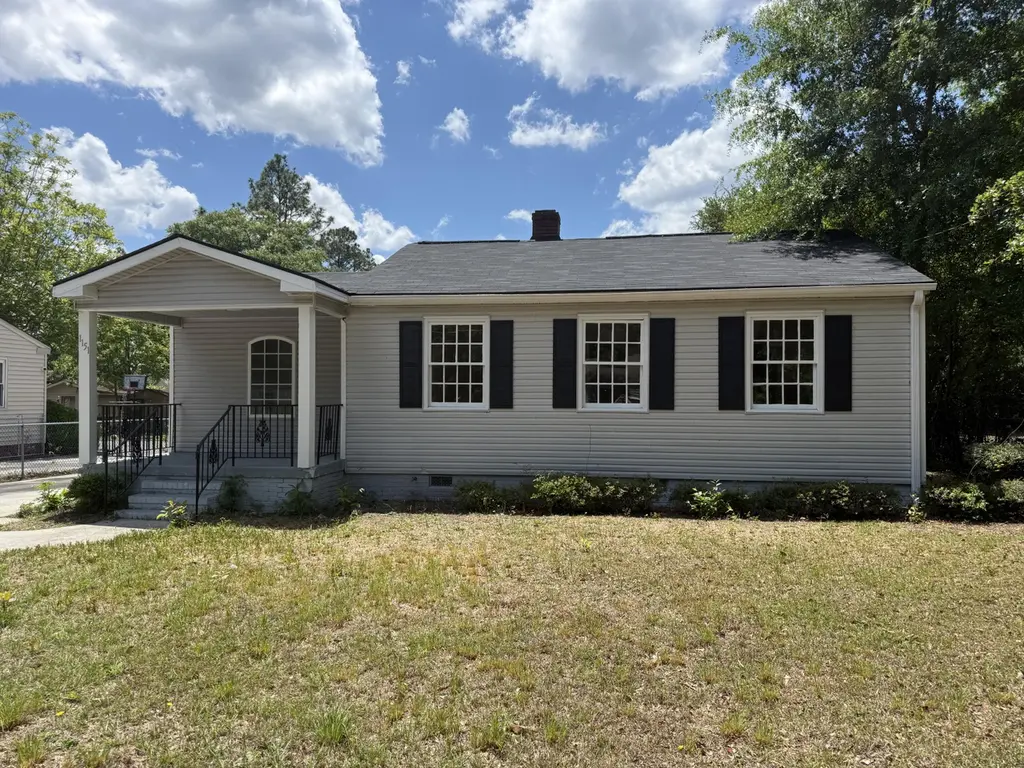
1151 Abbeville Ave NW · Aiken, SC
Flood risk 1/10 · Minimal
- FEMA flood zone
- X (unshaded)
- Chance of flooding over 30 yrs
- 0.0%
- Est. flood insurance / yr
- $507 – $1,088
Fire risk 4/10 · Minor
- Est. fire insurance / yr
- $783 – $1,453
Heat risk 7/10 · Major
- Hot days now (above 109°F)
- 7 days/yr
- Hot days in 30 yrs
- 17 days/yr
Wind risk 7/10 · Major
- Chance of severe wind over 30 yrs
- 78.0%
Air-quality risk 3/10 · Minor
- Unhealthy air days now
- 3 days/yr
- Unhealthy air days in 30 yrs
- 3 days/yr
Risk factors via First Street. Map © Google.
Why this score? — see what drove the D- grade
The composite is a weighted blend of 9 inputs, each scored 0–100. Each bar is that input's sub-score; the figure is the points it added to the 100-point composite (weight × sub-score).
- Cash flow +14.2/30.0
- DSCR +4.3/10.0
- Rent growth +3.8/5.0
- 1% rule +3.7/10.0
- Livability +3.4/5.0
- Schools +3.2/10.0
- Condition / age +2.5/5.0
- ARV discount +0.6/15.0
- Appreciation +0.0/10.0
$149,900
🖨 Deal sheet (PDF) 📄 Offer letter ✓ Due diligence
Listing remarks
Step into this remodeled 2 bedroom, 1 bathroom home featuring hardwood floors and a warm, inviting layout. Enjoy the convenience of a detached one-car garage and a spacious yard. New roof installed in 2024 and a brand new HVAC system will be installed, giving buyers added peace of mind. Whether you're looking for your first home or downsizing, this move-in ready home is one you won't want to miss!
Key facts
- Spacious yard
- Remodeled
- Hardwood floors
Tags
Property features AI
Exterior
- Parking: Detached garage; Driveway; 1 garage space
- Utilities: Public water; Public sewer; Other utilities
- Home design: Single-family residence; One level; Residential property; Raised foundation
- Construction: Vinyl siding; Composition roof; Raised foundation; Built as a single-family home
- Exterior features: Porch; Level lot; Paved road access
Interior
- Kitchen: Includes appliances (other)
- Bedrooms: 5 total rooms (includes bedrooms and living spaces)
- Flooring: Laminate flooring; Hardwood flooring
- Bathrooms: 1 full bathroom
- Heating & cooling: Forced air heating; Electric cooling
- Interior features: Other appliances; Laminate and hardwood flooring; No basement
- Laundry & utility: Washer hookup; Electric dryer hookup
Neighborhood map
What this means for you Summary
Snapshot
- This is a 2-bed/1.0-bath single-family listed at $150k.
Deal economics
- At list price, monthly cash flow is $25 ($299/yr) — positive.
- The deal already cash-flows at list — no discount required.
- To meet the 1% rule (rent ≥ 1% of price), the offer needs to be $130k (13.0% below list).
- Recommended offer: $130k (13.0% below list) — sets the bar for 1% rule.
- Cap rate 6.5% vs local median 4.1% in Aiken — top-decile yield for the area; either an underpriced asset or a hidden risk that comps aren't pricing in. Stress-test before assuming the spread holds.
Location & tenants
- Location reads 67/100 on livability (#93 in SC) — a middle-class / working-renter tenant base. Strengths: housing A+, health & safety A+, cost of living A; Watch: crime F, commute F.
- Aiken 01 (suburban): math 31% / reading 44% proficiency, ranked #36 of 80 in SC (top 45%) — families likely to look elsewhere, expect single-tenant / working-renter base with shorter leases.
- Zoned schools: Aiken Elementary (math 34% / reading 40%, grade F, #315 of 597 statewide, top 55%, 524 students, 100% FRL); South Aiken High (math 42% / reading 88%, grade B, #85 of 196 statewide, top 45%, 1,356 students, 42% FRL) — zoned schools average 71% FRL vs 54% district-wide (17 pts higher); higher-poverty schools than district average — tighter screening recommended.
- Zoned-school proficiency averages 51% at this address vs 38% district-wide (+14 pts) — the actual schools serving this property are materially stronger than the Aiken 01 average implies; a family-tenant draw the district grade alone would hide.
- Market conditions: Rents rising fast (+5.1%/yr); 522 active listings in the ZIP; 5 comparable units currently listed for rent nearby; rentals at typical pace (median 26d on market — plan ~3-4 weeks tenant-placement turnaround); 2,500 units permitted in Aiken County in 2024 (1,023 in 5+ unit buildings).
Forward outlook
- Local home prices are declining (-3.0%/yr); year-one equity from $1k of loan paydown is wiped out by about $4k of value loss. Plan a longer hold.
- Aiken County population projected at +9% by 2050 — modest demand growth; plan on rents tracking national, not racing it.
Negotiation context
- It's been on market 38 days — a 3% lower offer ($145k) is reasonable based on typical stale-listing flexibility.
- Current owner paid $38k; list at $150k implies a 290% gain — meaningful room to come down on a strong offer.
Risks & watch-outs
- Watch-outs: built in 1952 — expect roof / HVAC / electrical / plumbing capex.
- Climate carrying-cost: major wind risk, 78% chance of damaging wind over 30y; extreme-heat days projected 7→17/yr by 2055 (HVAC capex compounding) — expect insurance premiums to compound above CPI over the hold.
Questions for the listing agent
- It's been on market 38 days. Have you received any prior offers? Is the seller open to a 13% concession, seller financing, or rate buy-down credit?
- Built in 1952 — when were the roof, HVAC, electrical panel, plumbing, and water heater last replaced?
- Is there a deadline driving the sale (1031 exchange, divorce, estate, relocation)? That informs how much negotiation room exists.
- Schools are B-rated — typically a magnet for longer-tenancy family renters. What's the average tenant stay here, and is there a school-zone premium baked into asking?
- Crime grade is F in this area — have there been break-ins, vandalism, or insurance claims at this property in the last 3 years? What carrier currently insures it and at what premium?
- The area grade is low — what's the realistic commute time and amenity access for the typical tenant pool here? Any planned neighborhood developments (good or bad) we should know about?
- What's the average days-on-market for RENTAL listings here right now (not sales)? A rising rental-DOM trend means longer vacancies and softer asking-rent achievability than the comps imply.
- What's the recent tenant-quality profile in this submarket — average credit score on applications, eviction rate, late-payment / NSF rate, and stable-employment percentage? A property-management company in the area should have these aggregated.
- How much new for-sale + rental construction is in the pipeline within 1–3 miles? Heavy new supply typically softens prices + rents 12–24 months out; constrained supply supports both.
Investment metrics
- 1% rule
- 0.87% ✗
- Cap rate
- 6.49%
- Cash-on-cash
- 0.71%
- DSCR
- 1.03
- GRM
- 9.6
CMA / ARV
- ARV (on-the-fly)
- $130,060
- Comps found
- 12
Show comp detail 12 sales within ~0.75 mi
| Address | Dist | Beds/Ba | Sqft | Sold | Price | $/sf | Match |
|---|---|---|---|---|---|---|---|
| 1163 Abbeville Ave NW | 0.03mi | 2/1.0 | 929 (0%) | 3mo | $144,000 | $155 | 96 |
| 437 Morgan St | 0.27mi | 3/1.0 (+1) | 941 (+1%) | 9mo | $60,000 | $64 | 73 |
| 3010 Mohawk Dr | 0.35mi | 2/1.0 | 999 (+8%) | 6mo | $82,000 | $82 | 66 |
| 424 NW Mccormick St | 0.36mi | 2/2.0 | 964 (+4%) | 10mo | $193,500 | $201 | 65 |
| 702 Hampton Ave NE | 0.44mi | 2/1.0 | 952 (+2%) | 18mo | $79,000 | $83 | 60 |
| 810 Dillon Ave NW | 0.27mi | 2/1.0 | 836 (-10%) | 21mo | $139,000 | $166 | 54 |
| 318 Mccormick St NW | 0.38mi | 3/1.0 (+1) | 828 (-11%) | 8mo | $168,500 | $204 | 53 |
| 710 Tennessee Ave NW | 0.54mi | 3/1.5 (+1) | 1,000 (+8%) | 4mo | $68,000 | $68 | 51 |
| 1201 Pine Dr NW | 0.22mi | 2/1.0 | 1,056 (+14%) | 20mo | $129,500 | $123 | 50 |
| 1346 President Dr NW | 0.35mi | 3/1.5 (+1) | 1,000 (+8%) | 23mo | $140,000 | $140 | 45 |
| 512 NE Hampton Ave | 0.58mi | 3/1.0 (+1) | 1,068 (+15%) | 8mo | $55,000 | $51 | 36 |
| 618 NW Edgefield Ave | 0.47mi | 3/2.0 (+1) | 1,056 (+14%) | 20mo | $185,000 | $175 | 29 |
Match score weights: distance 35% · size 25% · config 20% · recency 20%. Top-matched comps best support the ARV.
Projected returns pro-forma
-3.0% appreciation · 5.06% rent growth · sell at horizon
- IRR
- -12.9%
- Equity multiple
- 0.52×
- Total profit
- $-19,944
- Equity at exit
- $22,351
- IRR
- -1.1%
- Equity multiple
- 0.92×
- Total profit
- $-3,513
- Equity at exit
- $12,961
Cash invested: $41,972 (down + closing). Projections, not guarantees.
Landlord ↔ Tenant lean methodology
- Overall (STATE)
- 90 Strongly Landlord-Friendly
- State South Carolina
- 90 Strongly Landlord-Friendly · R+6
- County
- — inherits STATE
- City
- — inherits STATE
ZIP-level market 29801
- Rents YoY
- 5.1%
- Active inventory
- 522
- Price-to-rent
- 9.6×
Monthly cashflow live
- Estimated rent
- $1,304 high interval (Pro) →
- Mortgage (P&I)
- −$786
- Tax from tax record
- −$157 /mo · $1,882/yr
- Insurance
- −$62
- HOA
- −$0
- Vacancy / Maint / Mgmt
- −$274
- Net cashflow
- $25
Break-even live
Sensitivity live
| Price | -10% $110 | -5% $67 | +0% $25 | +5% $-18 | +10% $-60 |
|---|---|---|---|---|---|
| Rent | -10% $-78 | -5% $-27 | +0% $25 | +5% $76 | +10% $128 |
| Rate | -1.0pp $100 | -0.5pp $63 | base $25 | +0.5pp $-14 | +1.0pp $-53 |
UW: 25.0% down · 7.5% · 30yr · 1.5% tax · 5.0% vac · 8.0% maint · 8.0% mgmt
Financing live
Cash to close
- Down payment
- $37,475
- Closing costs
- $4,497
- Reserves months
- —
- Total cash needed
- —
Loan-product check · same deal, 3 products live
Conventional
25% down · 7.5% · 30yr
- Down + closing
- —
- Monthly P&I
- —
- Monthly cashflow
- —
- DSCR
- —
- Eligible?
- —
Personal DTI + credit; lowest rate.
DSCR
20% down · 8.5% · 30yr
- Down + closing
- —
- Monthly P&I
- —
- Monthly cashflow
- —
- DSCR
- —
- Eligible?
- —
No personal income docs; deal must DSCR.
Hard money
10% down · 12.0% · 12mo
- Down + closing
- —
- Monthly P&I
- —
- Monthly cashflow
- —
- DSCR
- —
- Eligible?
- —
Short-term bridge; refi at stabilization.
Rent comps 5 comps
| Address | Beds | Baths | Sqft | Rent | $/sqft | DOM | Units | Dist |
|---|---|---|---|---|---|---|---|---|
| 630 Morgan St NW Unit A Aiken, SC | 3.0 | 1.0 | 950 | $1,100 | $1.16 | 25d | 1 | 0.38mi |
| 811 Laurens St NW Aiken, SC | 3.0 | 1.5 | 986 | $1,379 | $1.40 | 25d | 1 | 0.67mi |
| 146 Westwinds DR Aiken, SC | 1.0 | 1.0 | 600 | $1,300 | $2.17 | 25d | 1 | 1.07mi |
| 140 Weaver St Aiken, SC | 3.0 | 1.0 | 1000 | $1,200 | $1.20 | 23d | 1 | 1.32mi |
| 108 Wallace Green St Aiken, SC | 3.0 | 1.0 | 1000 | $1,200 | $1.20 | 25d | 1 | 1.43mi |
Listing history 19 events
-
2026-06-21days on market $149,900 Active 38 DOM
-
2026-06-18days on market $149,900 Active 35 DOM
-
2026-06-17days on market $149,900 Active 34 DOM
-
2026-06-16days on market $149,900 Active 33 DOM
-
2026-06-15days on market $149,900 Active 32 DOM
-
2026-06-14days on market $149,900 Active 30 DOM
-
2026-06-13days on market $149,900 Active 29 DOM
-
2026-06-10days on market $149,900 Active 27 DOM
-
2026-06-09days on market $149,900 Active 26 DOM
-
2026-06-08days on market $149,900 Active 25 DOM
-
2026-06-07days on market $149,900 Active 24 DOM
-
2026-06-03days on market $149,900 Active 20 DOM
-
2026-06-02days on market $149,900 Active 19 DOM
-
2026-06-01days on market $149,900 Active 18 DOM
-
2026-05-31days on market $149,900 Active 17 DOM
-
2026-05-30days on market $149,900 Active 16 DOM
-
2026-05-14$149,900 Active
-
1990-06-01soldstatus $38,450
-
1984-04-01soldstatus $29,500
ⓘ Source: listings_history table (triggers on properties + properties_extension) + one-shot
backfill from property_details.listing_events for pre-trigger history.
Tax reassessment forecast SC · Resets to sale price
- Current annual tax
- $1,882 · $157/mo
- Projected year-2 tax
- $1,882 · $157/mo
- Expected delta
- $0/yr ($0/mo · 0.0%)
ⓘ Screening estimate from a state-policy table — verify with the county assessor before closing.
Climate risk First Street
- Flood 1/10 Low FEMA zone X (unshaded) · 0% chance over 30 yrs
- Wildfire 4/10 Moderate
- Heat 7/10 Severe 7 d/yr ≥109°F today · 17 d/yr by 30 yrs out
- Wind 7/10 Severe 78% chance of damaging wind over 30 yrs
- Air quality 3/10 Moderate 3 unhealthy d/yr today · 3 by 30 yrs out
Nearby sold comps map
Loading sold comps map…
Walkable amenities ~0.75 mi
Loading nearby amenities…
Taxation est. · year 1
- Rental income
- $15,650
- − Mortgage interest
- −$8,397
- − Property taxes
- −$1,882
- − Insurance
- −$750
- − Repairs & maintenance
- −$1,252
- − Management
- −$1,252
- − Depreciation
- −$4,361
- Taxable loss
- −$2,243
- Est. tax savings @ 24.0%
- +$538
- After-tax cash flow
- $837/yr
For passive investors: Depreciation is non-cash, so a rental often shows a tax loss while cash-flowing — sheltering income. Rental losses are passive: they offset passive income freely, and up to $25,000/yr can offset ordinary (W-2) income if you actively participate and your MAGI is under $100k (phasing out to $0 by $150k); unused losses carry forward. On sale, claimed depreciation is recaptured at up to 25%, and gains may owe capital-gains tax (a 1031 exchange can defer both). Figures are a year-1 estimate at your 24.0% rate — not tax advice; consult a CPA.
Schools (NCES district)
- District
- Aiken 01
- NCES district ID
- 4500720
- Math proficiency
- 31% ▼ -11.00%
- Reading proficiency
- 44% ▼ -1.00%
- Median HH income
- $45,081
- Composite
- 31.91/100
- National rank
- #5857
- State rank
- #36 of 80 in SC
Livability — Aiken
- Score
- 67/100
- State rank
- #93
- US rank
- #10443
Category grades
Schools grade is shown separately in the Schools card above.
Census & demographics
- Census place
- Aiken, SC
- County
- Aiken County · 116,534 people
- City population
- 71,807
- Metro
- Augusta-Richmond County, GA-SC
- Population (ZIP)
- 31,108
- Household income
- $59,573
- Rent vs Own
- Severe rent burden
- 1260.0
Population outlook (Aiken County) Hauer SSP2
- Today (2025)
- 178,003 people
- By 2030
- 182,876 · +2.7%
- By 2040
- 189,970 · +6.7%
- By 2050
- 193,840 · +8.9%
- By 2075
- 199,453 · +12.1%
- By 2100
- 192,403 · +8.1%
Race, ethnicity, and origin ACS 2023
- Neighborhood character
- Diverse neighborhood (Simpson 0.57)
- Race & ethnicity
- White 50% Black 42% Hispanic / Latino 5% Two or more races 4% Asian 1%
- Hispanic origin (detail)
- Mexican 1% Puerto Rican 2%
- Common ancestry
- Slovak 2% Italian 1% Serbian 1%
- Foreign-born
- 3% · Canada, Jamaica
- Languages at home
- 95% English-only · Spanish 3% Other Indo-European 1%
Political lean MEDSL · Aiken
- 2024 margin
- Strong R (+25.9) · D 36.4% · R 62.2% · Other 1.4%
- 2008→2024 swing
- -1.9pp toward R · 2008: -24.0pp · 2024: -25.9pp
- All cycles
- 2024: R+25.9 2020: R+22.7 2016: R+27.5 2012: R+26.0 2008: R+24.0
Not yet ingested
- Civics
- —
Market trends
- HPI YoY
- ▼ -278.52%
- Current HPI
- 173.7944
- Rent YoY
- ▲ 5.06%
- Metro
- Augusta-Richmond County, GA-SC
- State GDP YoY
- ▲ 4.51%
- F500 in state
- 2
Industry mix (Fortune 500 HQ in SC)
| Industry | F500 HQs | Revenue |
|---|---|---|
| Packaging | 1 | $7B |
|
||
Price history
+408.1% since first listed3 events — show timeline
- 2026-05-14 Listed $149,900 AMLS
- 1990-06-01 Sold (Public Records) $38,450 Public Records
- 1984-04-01 Sold (Public Records) $29,500 Public Records
Property tax history
+19.7%/yrLatest (2025): $1,882 · +8.5% YoY. Source: county tax records.
Cash-flow waterfall
monthlySold comps — $/sqft
last 12 mo · ≤1 miLoading sold comps…