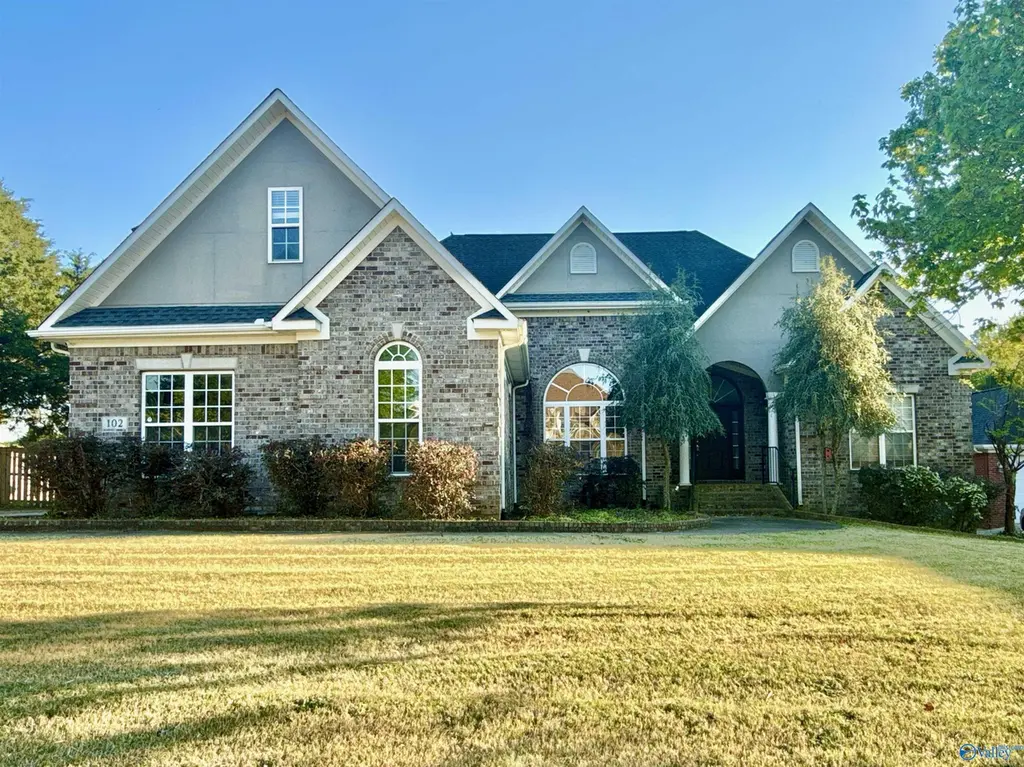
102 Casey Dr · Huntsville, AL
Flood risk 1/10 · Minimal
- FEMA flood zone
- X (unshaded)
- Chance of flooding over 30 yrs
- 0.0%
- Est. flood insurance / yr
- $507 – $1,088
Fire risk 3/10 · Minor
- Est. fire insurance / yr
- $916 – $1,700
Heat risk 5/10 · Moderate
- Hot days now (above 106°F)
- 7 days/yr
- Hot days in 30 yrs
- 19 days/yr
Wind risk 4/10 · Minor
- Chance of severe wind over 30 yrs
- 21.0%
Air-quality risk 2/10 · Minimal
- Unhealthy air days now
- 0 days/yr
- Unhealthy air days in 30 yrs
- 1 days/yr
Risk factors via First Street. Map © Google.
Why this score? — see what drove the D+ grade
The composite is a weighted blend of 9 inputs, each scored 0–100. Each bar is that input's sub-score; the figure is the points it added to the 100-point composite (weight × sub-score).
- ARV discount +15.0/15.0
- Appreciation +10.0/10.0
- Cash flow +7.4/30.0
- Livability +4.1/5.0
- Schools +3.7/10.0
- Rent growth +3.1/5.0
- Condition / age +2.5/5.0
- DSCR +1.6/10.0
- 1% rule +0.9/10.0
$445,000
🖨 Deal sheet (PDF) 📄 Offer letter ✓ Due diligence
Listing remarks
Location! This full brick home is ready for your touches. With 4 beds and 3.5 baths, a large great room, a formal dining room, a big kitchen with a breakfast nook, and a downstairs study, it has plenty of space for everyone. The downstairs master features a glamour bath. Upstairs, the spacious and private bedroom has lots of space and a full bath of its own. Outside, the privacy-fenced yard has a pool ready for summer fun. Situated just outside Madison and Huntsville, it is a short drive to shopping and work. Call today for your tour.
Key facts
- Breakfast nook
- Formal dining room
- Downstairs study
Tags
Property features AI
Finance
- HOA & community: No homeowners association; Subdivision: Ambers Crossing
Exterior
- Parking: Attached two-car garage that faces the side
- Utilities: Septic tank sewer
- Home design: Single-family residence; Two stories; Built in 2003; Brick construction
- Construction: Slab foundation
- Exterior features: Public water
Interior
- Bathrooms: Three full bathrooms; One half bathroom
- Heating & cooling: Central heating; Central cooling
- Interior features: Crawl space basement; One fireplace
Neighborhood map
What this means for you Summary
Snapshot
- This is a 4-bed/2.5-bath single-family listed at $445k.
Deal economics
- At list price, monthly cash flow is $-570 ($-7k/yr) — negative.
- To cash-flow at today's rent, offer at most $344k (22.6% below list).
- To meet the 1% rule (rent ≥ 1% of price), the offer needs to be $264k (40.8% below list).
- Recommended offer: $264k (40.8% below list) — sets the bar for 1% rule.
- Cap rate 4.8% vs local median 3.8% in Huntsville — meaningfully above typical; check what's discounted (condition, days-on-market, listing class) to confirm the premium yield is real.
Location & tenants
- Location reads 82/100 on livability (#3 in AL, #1,082 nationally) — a professional / high-income tenant draw. Strengths: commute A+, cost of living A+, housing A+; Watch: crime F.
- Madison County (rural): math 27% / reading 56% proficiency, ranked #19 of 129 in AL (top 15%) — families likely to look elsewhere, expect single-tenant / working-renter base with shorter leases.
- Zoned schools: Monrovia Elementary School (math 37% / reading 69%, grade C, #100 of 627 statewide, top 16%, 495 students, 29% FRL); Monrovia Middle School (math 29% / reading 66%, grade C-, #32 of 257 statewide, top 12%, 1,003 students, 31% FRL); Sparkman High School (math 28% / reading 37%, grade F, #58 of 305 statewide, top 19%, 1,738 students, 37% FRL) — zoned schools at 32% FRL track the district average.
- Market conditions: Rents rising (+2.6%/yr); 216 active listings in the ZIP; 6 comparable units currently listed for rent nearby; rentals lingering (median 46d on market — plan ~5-8 weeks vacancy on turnover, expect pricing pressure); 50% of comp listings sitting > 30 days — soft ceiling on asking rent; solid renter incomes; 4,709 units permitted in Madison County in 2024 (1,186 in 5+ unit buildings).
- This rent runs 36% of the median local income ($87k/yr) — at the standard rent-burdened threshold; future hikes will face affordability resistance.
Forward outlook
- In year one you build about $48k of equity ($3k loan paydown + $44k appreciation (10.0% local appreciation)).
- Madison County population projected at +18% by 2050 — long-run rental-demand tailwind backs the buy-and-hold thesis.
- By year 2, paydown + projected appreciation supports a ~$76k cash-out refi (75% LTV) — recoverable capital for the next deal without selling this one.
Negotiation context
- It's been on market 22 days — a 2% lower offer ($438k) is reasonable based on typical stale-listing flexibility.
- 2 sale attempts since 2y ago with the ask held roughly flat each time — persistent listings suggest the price (not the market) is what's stuck; bring a comps-based counter.
- Current owner paid $52k; list at $445k implies a 748% gain — meaningful room to come down on a strong offer.
Risks & watch-outs
- Climate carrying-cost: extreme-heat days projected 7→19/yr by 2055 (HVAC capex compounding) — expect insurance premiums to compound above CPI over the hold.
Questions for the listing agent
- What do current leases actually rent for vs. the listed asking? Can we see a recent rent roll and the last 12 months of T-12 income?
- Is there a deadline driving the sale (1031 exchange, divorce, estate, relocation)? That informs how much negotiation room exists.
- Crime grade is F in this area — have there been break-ins, vandalism, or insurance claims at this property in the last 3 years? What carrier currently insures it and at what premium?
- The area grade is low — what's the realistic commute time and amenity access for the typical tenant pool here? Any planned neighborhood developments (good or bad) we should know about?
- What's the average days-on-market for RENTAL listings here right now (not sales)? A rising rental-DOM trend means longer vacancies and softer asking-rent achievability than the comps imply.
- What's the recent tenant-quality profile in this submarket — average credit score on applications, eviction rate, late-payment / NSF rate, and stable-employment percentage? A property-management company in the area should have these aggregated.
- How much new for-sale + rental construction is in the pipeline within 1–3 miles? Heavy new supply typically softens prices + rents 12–24 months out; constrained supply supports both.
Investment metrics
- 1% rule
- 0.59% ✗
- Cap rate
- 4.76%
- Cash-on-cash
- -5.49%
- DSCR
- 0.76
- GRM
- 14.1
CMA / ARV
- ARV (on-the-fly)
- $778,122
- Comps found
- 12
Show comp detail 12 sales within ~0.75 mi
| Address | Dist | Beds/Ba | Sqft | Sold | Price | $/sf | Match |
|---|---|---|---|---|---|---|---|
| 222 Lee Bowden Dr | 0.31mi | 4/3.0 | 2,910 (+4%) | 5mo | $516,000 | $177 | 73 |
| 120 Preswick Pl | 0.53mi | 4/3.5 | 2,817 (+1%) | 6mo | $520,000 | $185 | 65 |
| 14 Eddy St NW | 0.68mi | 4/3.5 | 2,718 (-3%) | 1mo | $875,000 | $322 | 58 |
| 78 Hillcrest Ave NW | 0.72mi | 4/3.0 | 2,690 (-4%) | 2mo | $748,000 | $278 | 56 |
| 12 Angell St NW | 0.62mi | 3/3.5 (-1) | 2,916 (+4%) | 2mo | $1,051,000 | $360 | 54 |
| 38 Peace St NW | 0.57mi | 3/3.5 (-1) | 3,034 (+8%) | 1mo | $1,250,000 | $412 | 49 |
| 103 Nobleton Ln NW | 0.56mi | 3/2.5 (-1) | 3,004 (+7%) | 9mo | $435,000 | $145 | 49 |
| 1 NW Chalkstone St NW | 0.67mi | 4/2.5 | 3,193 (+14%) | 2mo | $777,900 | $244 | 43 |
| 9 Angell St NW | 0.65mi | 4/3.5 | 2,522 (-10%) | 10mo | $885,000 | $351 | 41 |
| 25 Angell St NW | 0.67mi | 3/3.5 (-1) | 3,029 (+8%) | 9mo | $1,304,489 | $431 | 39 |
| 74 Hillcrest Ave NW | 0.74mi | 4/3.5 | 3,113 (+11%) | 8mo | $769,000 | $247 | 36 |
| 109 Hillcrest Ave NW | 0.62mi | 4/3.5 | 3,208 (+15%) | 8mo | $892,500 | $278 | 36 |
Match score weights: distance 35% · size 25% · config 20% · recency 20%. Top-matched comps best support the ARV.
Projected returns pro-forma
10.0% appreciation · 2.57% rent growth · sell at horizon
- IRR
- 20.3%
- Equity multiple
- 2.64×
- Total profit
- $204,704
- Equity at exit
- $400,891
- IRR
- 18.4%
- Equity multiple
- 6.05×
- Total profit
- $628,663
- Equity at exit
- $864,537
Cash invested: $124,600 (down + closing). Projections, not guarantees.
Landlord ↔ Tenant lean methodology
- Overall (STATE)
- 90 Strongly Landlord-Friendly
- State Alabama
- 90 Strongly Landlord-Friendly · R+15
- County
- — inherits STATE
- City
- — inherits STATE
ZIP-level market 35806
- Home prices YoY
- 20.0%
- Rents YoY
- 2.6%
- Active inventory
- 216
- Price-to-rent
- 14.1×
Monthly cashflow live
- Estimated rent
- $2,635 high interval (Pro) →
- Mortgage (P&I)
- −$2,334
- Tax from tax record
- −$133 /mo · $1,592/yr
- Insurance
- −$185
- HOA
- −$0
- Vacancy / Maint / Mgmt
- −$553
- Net cashflow
- $-570
Break-even live
Sensitivity live
| Price | -10% $-318 | -5% $-444 | +0% $-570 | +5% $-696 | +10% $-822 |
|---|---|---|---|---|---|
| Rent | -10% $-778 | -5% $-674 | +0% $-570 | +5% $-466 | +10% $-362 |
| Rate | -1.0pp $-346 | -0.5pp $-457 | base $-570 | +0.5pp $-685 | +1.0pp $-803 |
UW: 25.0% down · 7.5% · 30yr · 1.5% tax · 5.0% vac · 8.0% maint · 8.0% mgmt
Financing live
Cash to close
- Down payment
- $111,250
- Closing costs
- $13,350
- Reserves months
- —
- Total cash needed
- —
Loan-product check · same deal, 3 products live
Conventional
25% down · 7.5% · 30yr
- Down + closing
- —
- Monthly P&I
- —
- Monthly cashflow
- —
- DSCR
- —
- Eligible?
- —
Personal DTI + credit; lowest rate.
DSCR
20% down · 8.5% · 30yr
- Down + closing
- —
- Monthly P&I
- —
- Monthly cashflow
- —
- DSCR
- —
- Eligible?
- —
No personal income docs; deal must DSCR.
Hard money
10% down · 12.0% · 12mo
- Down + closing
- —
- Monthly P&I
- —
- Monthly cashflow
- —
- DSCR
- —
- Eligible?
- —
Short-term bridge; refi at stabilization.
Rent comps 6 comps
| Address | Beds | Baths | Sqft | Rent | $/sqft | DOM | Units | Dist |
|---|---|---|---|---|---|---|---|---|
| 102 Fred Atkinson Rd Huntsville, AL | 4.0 | 3.0 | 3022 | $2,700 | $0.89 | 45d | 1 | 0.94mi |
| 67 Town Center Dr NW Huntsville, AL | 3.0 | 2.5 | 2970 | $2,495 | $0.84 | 45d | 1 | 1.01mi |
| 171 Kingswood Dr Huntsville, AL | 4.0 | 2.5 | 2850 | $2,500 | $0.88 | 15d | 1 | 1.05mi |
| 445 Providence Main St NW Unit 409a Huntsville, AL | 3.0 | 2.5 | 2797 | $3,995 | $1.43 | 45d | 1 | 1.11mi |
| 204 Roy Dr Madison, AL | 5.0 | 4.0 | 3195 | $3,450 | $1.08 | 25d | 1 | 1.42mi |
| 351 Lofton Rd NW Huntsville, AL | 4.0 | 2.5 | 2186 | $2,315 | $1.06 | 15d | 1 | 1.47mi |
Listing history 15 events
-
2026-06-22days on market $445,000 Active 22 DOM
-
2026-06-18days on market $445,000 Active 19 DOM
-
2026-06-17days on market $445,000 Active 18 DOM
-
2026-06-16days on market $445,000 Active 17 DOM
-
2026-06-15days on market $445,000 Active 16 DOM
-
2026-06-14days on market $445,000 Active 14 DOM
-
2026-06-10days on market $445,000 Active 11 DOM
-
2026-06-09days on market $445,000 Active 10 DOM
-
2026-06-08days on market $445,000 Active 9 DOM
-
2026-06-07days on market $445,000 Active 8 DOM
-
2026-06-03days on market $445,000 Active 4 DOM
-
2026-06-02days on market $445,000 Active 3 DOM
-
2026-06-01days on market $445,000 Active 2 DOM
-
2026-05-31remarks 541-char remark
-
2026-05-31$445,000 Active 1 DOM
ⓘ Source: listings_history table (triggers on properties + properties_extension) + one-shot
backfill from property_details.listing_events for pre-trigger history.
Tax reassessment forecast AL · Resets to sale price
- Current annual tax
- $1,592 · $133/mo
- Projected year-2 tax
- $1,825 · $152/mo
- Expected delta
- +$233/yr (+$19/mo · 14.6%)
ⓘ Screening estimate from a state-policy table — verify with the county assessor before closing.
Climate risk First Street
- Flood 1/10 Low FEMA zone X (unshaded) · 0% chance over 30 yrs
- Wildfire 3/10 Moderate
- Heat 5/10 Major 7 d/yr ≥106°F today · 19 d/yr by 30 yrs out
- Wind 4/10 Moderate 21% chance of damaging wind over 30 yrs
- Air quality 2/10 Low 0 unhealthy d/yr today · 1 by 30 yrs out
Nearby sold comps map
Loading sold comps map…
Walkable amenities ~0.75 mi
Loading nearby amenities…
Taxation est. · year 1
- Rental income
- $31,622
- − Mortgage interest
- −$24,927
- − Property taxes
- −$1,592
- − Insurance
- −$2,225
- − Repairs & maintenance
- −$2,530
- − Management
- −$2,530
- − Depreciation
- −$12,945
- Taxable loss
- −$15,127
- Est. tax savings @ 24.0%
- +$3,630
- After-tax cash flow
- $-3,209/yr
For passive investors: Depreciation is non-cash, so a rental often shows a tax loss while cash-flowing — sheltering income. Rental losses are passive: they offset passive income freely, and up to $25,000/yr can offset ordinary (W-2) income if you actively participate and your MAGI is under $100k (phasing out to $0 by $150k); unused losses carry forward. On sale, claimed depreciation is recaptured at up to 25%, and gains may owe capital-gains tax (a 1031 exchange can defer both). Figures are a year-1 estimate at your 24.0% rate — not tax advice; consult a CPA.
Schools (NCES district)
- District
- Madison County
- NCES district ID
- 0102220
- Math proficiency
- 27% ▼ -32.00%
- Reading proficiency
- 56% ▼ -1.00%
- Median HH income
- $66,058
- Composite
- 37.15/100
- National rank
- #4483
- State rank
- #19 of 129 in AL
Livability — Huntsville
- Score
- 82/100
- State rank
- #3
- US rank
- #1082
Category grades
Schools grade is shown separately in the Schools card above.
Census & demographics
- County
- Madison County · 380,832 people
- City population
- 220,435
- Metro
- Huntsville, AL
- Population (ZIP)
- 29,161
- Household income
- $86,768
- Rent vs Own
- Severe rent burden
- 1249.0
Population outlook (Madison County) Hauer SSP2
- Today (2025)
- 392,086 people
- By 2030
- 409,788 · +4.5%
- By 2040
- 440,557 · +12.4%
- By 2050
- 460,990 · +17.6%
- By 2075
- 502,872 · +28.3%
- By 2100
- 513,623 · +31.0%
Race, ethnicity, and origin ACS 2023
- Neighborhood character
- Diverse neighborhood (Simpson 0.57)
- Race & ethnicity
- White 58% Black 30% Hispanic / Latino 5% Two or more races 5% Asian 4%
- Hispanic origin (detail)
- Mexican 2% Puerto Rican 2%
- Common ancestry
- Slovak 2% Italian 2% Serbian 2%
- Foreign-born
- 7% · Canada, Vietnam, China
- Languages at home
- 93% English-only · Spanish 2% Other Indo-European 1% Other Asian/Pacific 1%
Political lean MEDSL · Madison
- 2024 margin
- Lean R (+9.0) · D 44.7% · R 53.7% · Other 1.6%
- 2008→2024 swing
- +6.0pp toward D · 2008: -14.9pp · 2024: -9.0pp
- All cycles
- 2024: R+9.0 2020: R+8.0 2016: R+16.8 2012: R+18.7 2008: R+14.9
Not yet ingested
- Civics
- —
Market trends
- HPI YoY
- ▲ 71.67%
- Current HPI
- 430.5866
- Rent YoY
- ▲ 2.57%
- Metro
- Huntsville, AL
- State GDP YoY
- ▲ 2.94%
- F500 in state
- 4
Industry mix (Fortune 500 HQ in AL)
| Industry | F500 HQs | Revenue |
|---|---|---|
| Financial Services | 1 | $8B |
|
||
| Healthcare | 1 | $5B |
|
||
Price history
+747.6% since first listed11 events — show timeline
- 2026-05-30 Listed $445,000 VMLS
- 2025-07-24 Price Changed $455,000 VMLS
- 2025-07-14 Price Changed $469,900 VMLS
- 2025-06-21 Price Changed $475,000 VMLS
- 2025-03-21 Price Changed $480,000 VMLS
- 2025-02-13 Price Changed $500,000 VMLS
- 2025-01-21 Price Changed $525,000 VMLS
- 2024-12-27 Price Changed $555,000 VMLS
- 2024-12-11 Price Changed $565,000 VMLS
- 2024-11-21 Listed $579,000 VMLS
- 2021-11-13 Sold (Public Records) $52,500 Public Records
Property tax history
+4.0%/yrLatest (2024): $1,592 · +3.6% YoY. Source: county tax records.
Cash-flow waterfall
monthlySold comps — $/sqft
last 12 mo · ≤1 miLoading sold comps…