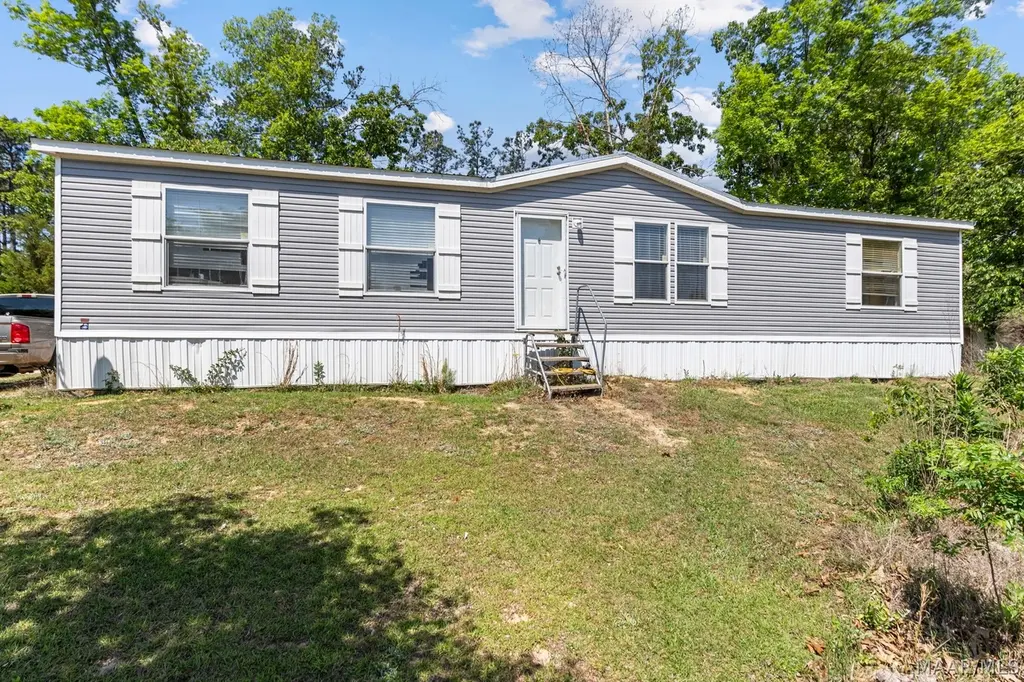
5609 County Road 59 Rd · Marbury, AL
Flood risk 1/10 · Minimal
- FEMA flood zone
- X (unshaded)
- Chance of flooding over 30 yrs
- 0.0%
- Est. flood insurance / yr
- $507 – $1,088
Fire risk 5/10 · Moderate
- Est. fire insurance / yr
- $916 – $1,700
Heat risk 6/10 · Moderate
- Hot days now (above 107°F)
- 7 days/yr
- Hot days in 30 yrs
- 20 days/yr
Wind risk 6/10 · Moderate
- Chance of severe wind over 30 yrs
- 67.0%
Air-quality risk 2/10 · Minimal
- Unhealthy air days now
- 2 days/yr
- Unhealthy air days in 30 yrs
- 2 days/yr
Risk factors via First Street. Map © Google.
Why this score? — see what drove the F grade
The composite is a weighted blend of 9 inputs, each scored 0–100. Each bar is that input's sub-score; the figure is the points it added to the 100-point composite (weight × sub-score).
- ARV discount +7.5/15.0
- Cash flow +7.1/30.0
- Appreciation +4.0/10.0
- Livability +3.0/5.0
- Rent growth +2.5/5.0
- Condition / age +2.5/5.0
- Schools +2.1/10.0
- 1% rule +2.0/10.0
- DSCR +1.3/10.0
$179,900
🖨 Deal sheet (PDF) 📄 Offer letter ✓ Due diligence
Listing remarks MLS
Spacious 4-bedroom, 2-bath mobile home on just under an acre in a prime Verbena location! Conveniently situated directly across from Verbena High School, this property offers the perfect blend of accessibility and peaceful country living. Inside, you’ll find a functional, open layout with generous living space, a large kitchen with center island, and a cozy family room with fireplace. The split floor plan provides added privacy, with a primary suite featuring double sinks, a walk-in shower, and a soaking tub. Enjoy the expansive yard with plenty of room for outdoor living, gardening, or future improvements. An excellent opportunity for affordable space, comfort, and convenience.
Key facts
- Split floor plan
- Open layout
- Large kitchen
Tags
Neighborhood map
What this means for you Summary
Snapshot
- This is a 4-bed/2.0-bath other listed at $180k.
Deal economics
- At list price, monthly cash flow is $-253 ($-3k/yr) — negative.
- To cash-flow at today's rent, offer at most $143k (20.3% below list).
- To meet the 1% rule (rent ≥ 1% of price), the offer needs to be $125k (30.3% below list).
- Recommended offer: $125k (30.3% below list) — sets the bar for 1% rule.
Location & tenants
- Location reads 59/100 on livability (#334 in AL) — a working-class tenant base; expect higher turnover. Strengths: crime A+, cost of living A+, housing A+; Watch: employment D+, amenities F, commute F.
- Chilton County (rural): math 15% / reading 34% proficiency, ranked #94 of 129 in AL (top 73%) — low school quality limits family demand, transient renter base, plan for 1-2y turnover.
- Zoned schools: Clanton Elementary School (math 37% / reading 55%, grade D-, #164 of 627 statewide, top 26%, 1,028 students, 67% FRL); Clanton Middle School (math 7% / reading 35%, grade F, #188 of 257 statewide, top 74%, 478 students, 74% FRL); Chilton County High School (math 17% / reading 17%, grade F, #195 of 305 statewide, top 68%, 783 students, 69% FRL) — zoned schools average 70% FRL vs 54% district-wide (15 pts higher); higher-poverty schools than district average — tighter screening recommended.
- Market conditions: 35 active listings in the ZIP; 25 units permitted in Chilton County in 2024 (0 in 5+ unit buildings).
Forward outlook
- Local home prices are declining (-2.0%/yr); year-one equity from $1k of loan paydown is wiped out by about $4k of value loss. Plan a longer hold.
- Chilton County population projected at -10% by 2050 — secular population decline; favor cash flow + early exit over multi-decade hold.
Negotiation context
- It's been on market 56 days — a 3% lower offer ($175k) is reasonable based on typical stale-listing flexibility.
- Current owner paid $28k; list at $180k implies a 542% gain — meaningful room to come down on a strong offer.
Risks & watch-outs
- Climate carrying-cost: major wind risk, 67% chance of damaging wind over 30y; moderate wildfire risk; extreme-heat days projected 7→20/yr by 2055 (HVAC capex compounding) — expect insurance premiums to compound above CPI over the hold.
Questions for the listing agent
- What do current leases actually rent for vs. the listed asking? Can we see a recent rent roll and the last 12 months of T-12 income?
- It's been on market 56 days. Have you received any prior offers? Is the seller open to a 30% concession, seller financing, or rate buy-down credit?
- Is there a deadline driving the sale (1031 exchange, divorce, estate, relocation)? That informs how much negotiation room exists.
- Schools are D-rated, which usually means shorter tenancies and higher turnover. Who's the typical renter profile here, and what's been the actual vacancy rate?
- The area grade is low — what's the realistic commute time and amenity access for the typical tenant pool here? Any planned neighborhood developments (good or bad) we should know about?
- What's the average days-on-market for RENTAL listings here right now (not sales)? A rising rental-DOM trend means longer vacancies and softer asking-rent achievability than the comps imply.
- What's the recent tenant-quality profile in this submarket — average credit score on applications, eviction rate, late-payment / NSF rate, and stable-employment percentage? A property-management company in the area should have these aggregated.
- How much new for-sale + rental construction is in the pipeline within 1–3 miles? Heavy new supply typically softens prices + rents 12–24 months out; constrained supply supports both.
Investment metrics
- 1% rule
- 0.70% ✗
- Cap rate
- 4.61%
- Cash-on-cash
- -6.02%
- DSCR
- 0.73
- GRM
- 12.0
CMA / ARV
No comps found within radius.
Projected returns pro-forma
-1.96% appreciation · 3.0% rent growth · sell at horizon
- IRR
- -19.1%
- Equity multiple
- 0.26×
- Total profit
- $-37,271
- Equity at exit
- $35,288
- IRR
- -12.4%
- Equity multiple
- 0.09×
- Total profit
- $-45,992
- Equity at exit
- $30,490
Cash invested: $50,372 (down + closing). Projections, not guarantees.
Landlord ↔ Tenant lean methodology
- Overall (STATE)
- 90 Strongly Landlord-Friendly
- State Alabama
- 90 Strongly Landlord-Friendly · R+15
- County
- — inherits STATE
- City
- — inherits STATE
ZIP-level market 36091
- Home prices YoY
- -1.1%
- Active inventory
- 35
- Price-to-rent
- 12.0×
Monthly cashflow live
- Estimated rent
- $1,254 medium interval (Pro) →
- Mortgage (P&I)
- −$943
- Tax est. 1.5%
- −$225 /mo · $2,698/yr
- Insurance
- −$75
- HOA
- −$0
- Vacancy / Maint / Mgmt
- −$263
- Net cashflow
- $-253
Break-even live
Sensitivity live
| Price | -10% $-128 | -5% $-191 | +0% $-253 | +5% $-315 | +10% $-377 |
|---|---|---|---|---|---|
| Rent | -10% $-352 | -5% $-302 | +0% $-253 | +5% $-203 | +10% $-154 |
| Rate | -1.0pp $-162 | -0.5pp $-207 | base $-253 | +0.5pp $-299 | +1.0pp $-347 |
UW: 25.0% down · 7.5% · 30yr · 1.5% tax · 5.0% vac · 8.0% maint · 8.0% mgmt
Financing live
Cash to close
- Down payment
- $44,975
- Closing costs
- $5,397
- Reserves months
- —
- Total cash needed
- —
Loan-product check · same deal, 3 products live
Conventional
25% down · 7.5% · 30yr
- Down + closing
- —
- Monthly P&I
- —
- Monthly cashflow
- —
- DSCR
- —
- Eligible?
- —
Personal DTI + credit; lowest rate.
DSCR
20% down · 8.5% · 30yr
- Down + closing
- —
- Monthly P&I
- —
- Monthly cashflow
- —
- DSCR
- —
- Eligible?
- —
No personal income docs; deal must DSCR.
Hard money
10% down · 12.0% · 12mo
- Down + closing
- —
- Monthly P&I
- —
- Monthly cashflow
- —
- DSCR
- —
- Eligible?
- —
Short-term bridge; refi at stabilization.
Listing history 18 events
-
2026-06-21days on market $179,900 Active 56 DOM
-
2026-06-18days on market $179,900 Active 53 DOM
-
2026-06-17days on market $179,900 Active 52 DOM
-
2026-06-16days on market $179,900 Active 51 DOM
-
2026-06-15days on market $179,900 Active 50 DOM
-
2026-06-13days on market $179,900 Active 48 DOM
-
2026-06-13days on market $179,900 Active 47 DOM
-
2026-06-10days on market $179,900 Active 45 DOM
-
2026-06-09days on market $179,900 Active 44 DOM
-
2026-06-08days on market $179,900 Active 43 DOM
-
2026-06-07days on market $179,900 Active 42 DOM
-
2026-06-03days on market $179,900 Active 38 DOM
-
2026-06-02days on market $179,900 Active 37 DOM
-
2026-06-01days on market $179,900 Active 36 DOM
-
2026-05-31days on market $179,900 Active 35 DOM
-
2026-04-26$179,900 Active 693-char remark
Show marketing remark (693 chars)
Spacious 4-bedroom, 2-bath mobile home on just under an acre in a prime Verbena location! Conveniently situated directly across from Verbena High School, this property offers the perfect blend of accessibility and peaceful country living. Inside, you’ll find a functional, open layout with generous living space, a large kitchen with center island, and a cozy family room with fireplace. The split floor plan provides added privacy, with a primary suite featuring double sinks, a walk-in shower, and a soaking tub. Enjoy the expansive yard with plenty of room for outdoor living, gardening, or future improvements. An excellent opportunity for affordable space, comfort, and convenience.
-
2019-01-23soldstatus $28,000
-
2015-03-13soldstatus $13,500
ⓘ Source: listings_history table (triggers on properties + properties_extension) + one-shot
backfill from property_details.listing_events for pre-trigger history.
Climate risk First Street
- Flood 1/10 Low FEMA zone X (unshaded) · 0% chance over 30 yrs
- Wildfire 5/10 Major
- Heat 6/10 Major 7 d/yr ≥107°F today · 20 d/yr by 30 yrs out
- Wind 6/10 Major 67% chance of damaging wind over 30 yrs
- Air quality 2/10 Low 2 unhealthy d/yr today · 2 by 30 yrs out
Nearby sold comps map
Loading sold comps map…
Walkable amenities ~0.75 mi
Loading nearby amenities…
Taxation est. · year 1
- Rental income
- $15,046
- − Mortgage interest
- −$10,077
- − Property taxes
- −$2,698
- − Insurance
- −$900
- − Repairs & maintenance
- −$1,204
- − Management
- −$1,204
- − Depreciation
- −$5,233
- Taxable loss
- −$6,270
- Est. tax savings @ 24.0%
- +$1,505
- After-tax cash flow
- $-1,528/yr
For passive investors: Depreciation is non-cash, so a rental often shows a tax loss while cash-flowing — sheltering income. Rental losses are passive: they offset passive income freely, and up to $25,000/yr can offset ordinary (W-2) income if you actively participate and your MAGI is under $100k (phasing out to $0 by $150k); unused losses carry forward. On sale, claimed depreciation is recaptured at up to 25%, and gains may owe capital-gains tax (a 1031 exchange can defer both). Figures are a year-1 estimate at your 24.0% rate — not tax advice; consult a CPA.
Schools (NCES district)
- District
- Chilton County
- NCES district ID
- 0100660
- Math proficiency
- 15% ▼ -26.00%
- Reading proficiency
- 34% ▼ -5.00%
- Median HH income
- $41,269
- Composite
- 20.73/100
- National rank
- #8520
- State rank
- #94 of 129 in AL
Livability — Marbury
- Score
- 59/100
- State rank
- #334
- US rank
- #20114
Category grades
Schools grade is shown separately in the Schools card above.
Census & demographics
- City population
- 2,899
- Population (ZIP)
- 3,707
Population outlook (Chilton County) Hauer SSP2
- Today (2025)
- 44,064 people
- By 2030
- 43,694 · -0.8%
- By 2040
- 42,168 · -4.3%
- By 2050
- 39,667 · -10.0%
- By 2075
- 31,397 · -28.7%
- By 2100
- 21,319 · -51.6%
Race, ethnicity, and origin ACS 2023
- Neighborhood character
- Predominantly White (82%)
- Race & ethnicity
- White 82% Black 12% Hispanic / Latino 4% Two or more races 3%
- Common ancestry
- Serbian 1% Slovak 1% Lithuanian 1%
- Foreign-born
- 4% · Canada
- Languages at home
- 95% English-only · Spanish 5%
Political lean MEDSL · Chilton
- 2024 margin
- Solid R (+72.1) · D 13.7% · R 85.8%
- 2008→2024 swing
- -14.3pp toward R · 2008: -57.8pp · 2024: -72.1pp
- All cycles
- 2024: R+72.1 2020: R+67.4 2016: R+66.6 2012: R+60.3 2008: R+57.8
Not yet ingested
- Civics
- —
Market trends
- HPI YoY
- ▼ -1.96%
- Current HPI
- 170.1585
- Rent YoY
- —
- Metro
- —
- State GDP YoY
- ▲ 2.94%
- F500 in state
- 4
Industry mix (Fortune 500 HQ in AL)
| Industry | F500 HQs | Revenue |
|---|---|---|
| Financial Services | 1 | $8B |
|
||
| Healthcare | 1 | $5B |
|
||
Price history
+1232.6% since first listed3 events — show timeline
- 2026-04-26 Listed $179,900 MAAR
- 2019-01-23 Sold (Public Records) $28,000 Public Records
- 2015-03-13 Sold (Public Records) $13,500 Public Records
Property tax history
+6.2%/yrLatest (2025): $179 · +6.4% YoY. Source: county tax records.
Cash-flow waterfall
monthlySold comps — $/sqft
last 12 mo · ≤1 miLoading sold comps…