130 Thomas B. Landers Rd Unit C28 · Falmouth, MA
Flood risk No data
- FEMA flood zone
- —
- Chance of flooding over 30 yrs
- —
- Est. flood insurance / yr
- —
Fire risk No data
- Est. fire insurance / yr
- —
Heat risk 5/10 · Moderate
- Hot days now (above threshold)
- 7 days/yr
- Hot days in 30 yrs
- 17 days/yr
Wind risk No data
- Chance of severe wind over 30 yrs
- —
Air-quality risk 3/10 · Minor
- Unhealthy air days now
- 3 days/yr
- Unhealthy air days in 30 yrs
- 3 days/yr
Risk factors via First Street. Map © Google.
Why this score? — see what drove the B grade
The composite is a weighted blend of 9 inputs, each scored 0–100. Each bar is that input's sub-score; the figure is the points it added to the 100-point composite (weight × sub-score).
- Cash flow +30.0/30.0
- 1% rule +10.0/10.0
- DSCR +10.0/10.0
- ARV discount +7.5/15.0
- Schools +4.5/10.0
- Livability +3.8/5.0
- Condition / age +3.8/5.0
- Rent growth +2.5/5.0
- Appreciation +0.0/10.0
$74,999
🖨 Deal sheet 📄 Offer letter ✓ Due diligence
Listing remarks
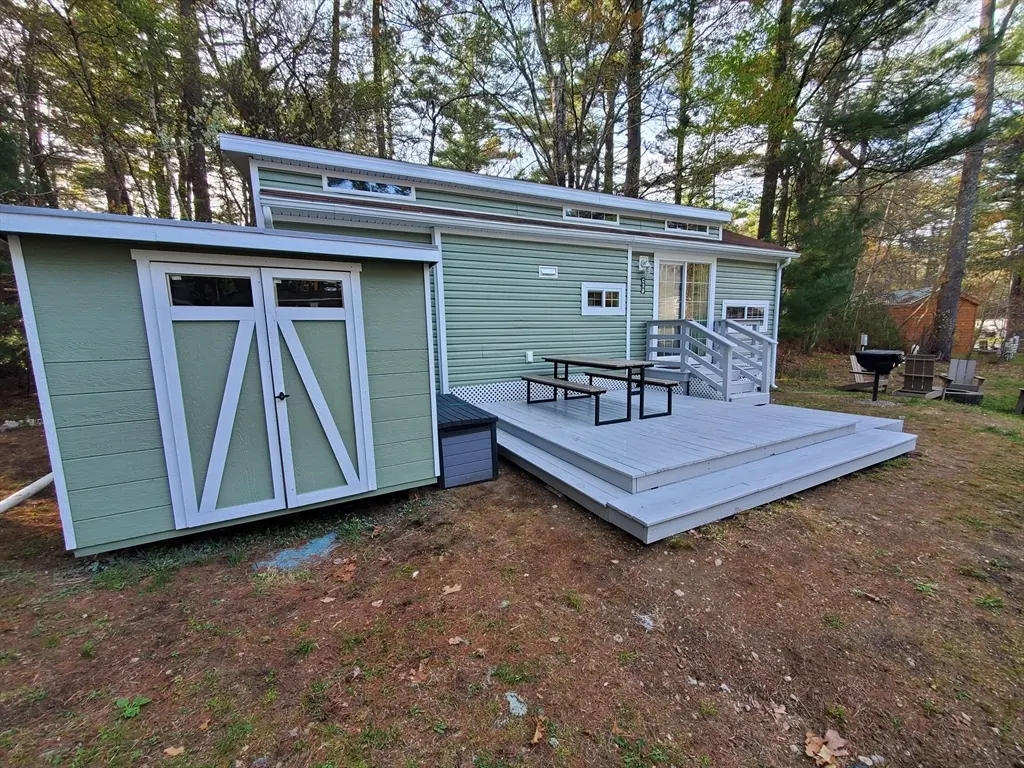
Cabin in the Pines. This charming 400 sq. ft. Seasonal mobile home is situated on a spacious double lot in a quiet cul-de-sac setting. The layout includes: Primary bedroom approximately 9’ x 11’Bunk/twin bedroom approximately 7’ x 9’, Large loft area spanning the length and width of the trailer, perfect for additional sleeping space or a fun children’s retreat, Pullout couch for extra guests, Fire pit with chairs' The property is dog-friendly and offers a relaxing, family-oriented atmosphere with extensive on-site amenities, including: Wi-Fi access, On-site laundry facilities, General store, Clubhouse, Miniature golf, Beach access, Fishing, Playground, Pedal bo
Key facts
- Large loft area
- Wi-fi access
- Quiet cul-de-sac
Tags
Property features AI
Finance
- Other: Approximately 0.08-acre lot, wooded and cleared; Approximately 3/10 to 1/2 mile to the beach; Total building area about 400
- HOA & community: Not a senior community
Exterior
- Parking: Off-street parking; 2 open parking spaces (total 2 spaces)
- Utilities: Public water; Private sewer; Gas available for range
- Home design: Mobile home; Facing information not provided
- Construction: Slab foundation; Built approximately (year source: owner); Green exterior color
- Exterior features: Deck; Tennis court(s) on the property; Exterior storage
Interior
- Kitchen: Range; Refrigerator
- Bedrooms: Master bedroom on the first level (approx. 9 x 11); Second bedroom (approx. 7 x 9)
- Bathrooms: 1 full bathroom
- Heating & cooling: Window unit cooling
- Interior features: Total of 5 rooms
Neighborhood map
What this means for you Summary
Snapshot
- This is a 2-bed/1.0-bath manufactured listed at $75k. Condition is rated good.
Deal economics
- At list price, monthly cash flow is $437 ($5k/yr) — positive.
- The deal already cash-flows at list — no discount required.
- Meets the 1% rule at list price ($1k rent vs $75k).
- Recommended offer: $74k (1.5% below list) — sets the bar for market timing.
- Cap rate 13.3% vs local median 0.8% in Falmouth — top-decile yield for the area; either an underpriced asset or a hidden risk that comps aren't pricing in. Stress-test before assuming the spread holds.
Location & tenants
- Location reads 76/100 on livability (#65 in MA, #3,630 nationally) — a middle-class / working-renter tenant base. Strengths: commute A+, health & safety A+, schools A-; Watch: amenities D+, cost of living F.
- Falmouth (suburban): math 44% / reading 58% proficiency, ranked #122 of 302 in MA (top 40%) — acceptable for families but not a draw, mixed tenant base, ~2y average lease.
- Market conditions: 69 active listings in the ZIP; 657 units permitted in Barnstable County in 2024 (178 in 5+ unit buildings).
Forward outlook
- Local home prices are declining (-3.0%/yr); year-one equity from $518 of loan paydown is wiped out by about $2k of value loss. Plan a longer hold.
- Barnstable County population projected at -20% by 2050 — secular population decline; favor cash flow + early exit over multi-decade hold.
- At projected returns (-3.0% appreciation + 3.0% rent growth), your $21k cash investment doubles in ~5 years — after that, you're playing with house money.
Negotiation context
- It's been on market 22 days — a 2% lower offer ($74k) is reasonable based on typical stale-listing flexibility.
Risks & watch-outs
- Climate carrying-cost: extreme-heat days projected 7→17/yr by 2055 (HVAC capex compounding) — expect insurance premiums to compound above CPI over the hold.
Questions for the listing agent
- Is there a deadline driving the sale (1031 exchange, divorce, estate, relocation)? That informs how much negotiation room exists.
- Schools are A-rated — typically a magnet for longer-tenancy family renters. What's the average tenant stay here, and is there a school-zone premium baked into asking?
- What's the average days-on-market for RENTAL listings here right now (not sales)? A rising rental-DOM trend means longer vacancies and softer asking-rent achievability than the comps imply.
- What's the recent tenant-quality profile in this submarket — average credit score on applications, eviction rate, late-payment / NSF rate, and stable-employment percentage? A property-management company in the area should have these aggregated.
- How much new for-sale + rental construction is in the pipeline within 1–3 miles? Heavy new supply typically softens prices + rents 12–24 months out; constrained supply supports both.
Investment metrics
- 1% rule
- 1.61% ✓
- Cap rate
- 13.28%
- Cash-on-cash
- 24.97%
- DSCR
- 2.11
- GRM
- 5.2
CMA / ARV
No comps found within radius.
Projected returns pro-forma
-3.0% appreciation · 3.0% rent growth · sell at horizon
- IRR
- 18.4%
- Equity multiple
- 1.75×
- Total profit
- $15,695
- Equity at exit
- $11,183
- IRR
- 26.8%
- Equity multiple
- 3.36×
- Total profit
- $49,576
- Equity at exit
- $6,485
Cash invested: $21,000 (down + closing). Projections, not guarantees.
Landlord ↔ Tenant lean methodology
- Overall (STATE)
- 20 Strongly Tenant-Friendly
- State Massachusetts
- 20 Strongly Tenant-Friendly · D+15
- County
- — inherits STATE
- City
- — inherits STATE
ZIP-level market 02536
- Active inventory
- 69
- Price-to-rent
- 5.2×
Monthly cashflow live
- Estimated rent
- $1,209 medium interval (Pro) →
- Mortgage (P&I)
- −$393
- Tax est. 1.5%
- −$94 /mo · $1,125/yr
- Insurance
- −$31
- HOA
- −$0
- Vacancy / Maint / Mgmt
- −$254
- Net cashflow
- $437
Break-even live
UW: 25.0% down · 7.5% · 30yr · 1.5% tax · 5.0% vac · 8.0% maint · 8.0% mgmt
Financing live
Cash to close
- Down payment
- $18,750
- Closing costs
- $2,250
- Reserves months
- —
- Total cash needed
- —
Loan-product check · same deal, 3 products live
Conventional
25% down · 7.5% · 30yr
- Down + closing
- —
- Monthly P&I
- —
- Monthly cashflow
- —
- DSCR
- —
- Eligible?
- —
Personal DTI + credit; lowest rate.
DSCR
20% down · 8.5% · 30yr
- Down + closing
- —
- Monthly P&I
- —
- Monthly cashflow
- —
- DSCR
- —
- Eligible?
- —
No personal income docs; deal must DSCR.
Hard money
10% down · 12.0% · 12mo
- Down + closing
- —
- Monthly P&I
- —
- Monthly cashflow
- —
- DSCR
- —
- Eligible?
- —
Short-term bridge; refi at stabilization.
Listing history 17 events
-
2026-06-18days on market $74,999 Active 22 DOM
-
2026-06-17days on market $74,999 Active 21 DOM
-
2026-06-16days on market $74,999 Active 20 DOM
-
2026-06-15days on market $74,999 Active 19 DOM
-
2026-06-13days on market $74,999 Active 17 DOM
-
2026-06-12statusdays on market $74,999 Active 16 DOM
-
2026-06-09days on market $74,999 Back On Market 13 DOM
-
2026-06-09status $74,999 Back On Market 12 DOM
-
2026-06-08days on market $74,999 Contingent 12 DOM
-
2026-06-07days on market $74,999 Contingent 11 DOM
-
2026-06-07days on market $74,999 Contingent 10 DOM
-
2026-06-04statusdays on market $74,999 Contingent 7 DOM
-
2026-06-02days on market $74,999 Active 6 DOM
-
2026-06-01days on market $74,999 Active 5 DOM
-
2026-05-31statusdays on market $74,999 Active 4 DOM
-
2026-05-31days on market $74,999 New 3 DOM
-
2026-05-27$74,999 New
ⓘ Source: listings_history table (triggers on properties + properties_extension) + one-shot
backfill from property_details.listing_events for pre-trigger history.
Climate risk First Street
- Heat 5/10 Major
- Air quality 3/10 Moderate 3 unhealthy d/yr today · 3 by 30 yrs out
Nearby sold comps map
Loading sold comps map…
Walkable amenities ~0.75 mi
Loading nearby amenities…
Taxation est. · year 1
- Rental income
- $14,510
- − Mortgage interest
- −$4,201
- − Property taxes
- −$1,125
- − Insurance
- −$375
- − Repairs & maintenance
- −$1,161
- − Management
- −$1,161
- − Depreciation
- −$2,182
- Taxable income
- $4,306
- Est. tax owed @ 24.0%
- −$1,033
- After-tax cash flow
- $4,210/yr
For passive investors: Depreciation is non-cash, so a rental often shows a tax loss while cash-flowing — sheltering income. Rental losses are passive: they offset passive income freely, and up to $25,000/yr can offset ordinary (W-2) income if you actively participate and your MAGI is under $100k (phasing out to $0 by $150k); unused losses carry forward. On sale, claimed depreciation is recaptured at up to 25%, and gains may owe capital-gains tax (a 1031 exchange can defer both). Figures are a year-1 estimate at your 24.0% rate — not tax advice; consult a CPA.
Condition & rehab AI · 13 photos
This charming 400 sq. ft. mobile home is in good condition with a spacious deck and outdoor amenities, making it a great investment for both resale and rental.
Value-add opportunities
- Both Landscaping and outdoor furniture — Enhances curb appeal and outdoor living space.
- Both Painting exterior and interior — Fresh paint can improve the home's appearance and value.
- Both Reorganizing interior layout — Can maximize space and functionality for potential buyers/renters.
Renovation cost estimate screening
Value-add ROI direction
- Both Landscaping and outdoor furniture — Enhances curb appeal and outdoor living space. ↑
- Both Painting exterior and interior — Fresh paint can improve the home's appearance and value. ↑
- Both Reorganizing interior layout — Can maximize space and functionality for potential buyers/renters. ↑
ⓘ Cost ranges are severity-bucket heuristics (US national rule-of-thumb). Get contractor quotes + a written scope before underwriting a rehab budget.
Schools (NCES district)
- District
- Falmouth
- NCES district ID
- 2504860
- Math proficiency
- 44% ▼ -13.00%
- Reading proficiency
- 58% ▼ -6.00%
- Median HH income
- $64,458
- Composite
- 44.95/100
- National rank
- #2708
- State rank
- #122 of 302 in MA
Livability — Falmouth
- Score
- 76/100
- State rank
- #65
- US rank
- #3630
Category grades
Schools grade is shown separately in the Schools card above.
Census & demographics
- Population (ZIP)
- 21,100
Population outlook (Barnstable County) Hauer SSP2
- Today (2025)
- 208,497 people
- By 2030
- 202,530 · -2.9%
- By 2040
- 184,936 · -11.3%
- By 2050
- 167,489 · -19.7%
- By 2075
- 144,938 · -30.5%
- By 2100
- 117,312 · -43.7%
Race, ethnicity, and origin ACS 2023
- Neighborhood character
- Predominantly White (85%)
- Race & ethnicity
- White 85% Two or more races 7% Hispanic / Latino 3% Asian 3% Black 1%
- Common ancestry
- Russian 6% Lithuanian 4% Estonian 3%
- Foreign-born
- 9% · Canada, China
- Languages at home
- 90% English-only · Other Indo-European 4% Chinese 3% Spanish 1%
Political lean MEDSL · Barnstable
- 2024 margin
- Strong D (+20.8) · D 59.6% · R 38.9% · Other 1.5%
- 2008→2024 swing
- +6.7pp toward D · 2008: 14.0pp · 2024: 20.8pp
- All cycles
- 2024: D+20.8 2020: D+24.4 2016: D+13.4 2012: D+7.6 2008: D+14.0
Not yet ingested
- Civics
- —
Market trends
- HPI YoY
- ▼ -327.82%
- Current HPI
- 345.1933
- Rent YoY
- —
- Metro
- —
- State GDP YoY
- ▲ 2.28%
- F500 in state
- 38
Industry mix (Fortune 500 HQ in MA)
| Industry | F500 HQs | Revenue |
|---|---|---|
| Technology | 3 | $17B |
|
||
| Insurance | 2 | $84B |
|
||
| Retail | 2 | $76B |
|
||
| Life Sciences | 1 | $43B |
|
||
| Energy Technology | 1 | $31B |
|
||
| Aerospace / Defense | 1 | $18B |
|
||
Price history
1 event — show timeline
- 2026-05-27 Listed $74,999 MLS PIN
Cash-flow waterfall
monthlySold comps — $/sqft
last 12 mo · ≤1 miLoading sold comps…