4120 Audubon Ave · Green Cove Springs, FL
Flood risk No data
- FEMA flood zone
- —
- Chance of flooding over 30 yrs
- —
- Est. flood insurance / yr
- —
Fire risk No data
- Est. fire insurance / yr
- —
Heat risk No data
- Hot days now (above threshold)
- —
- Hot days in 30 yrs
- —
Wind risk No data
- Chance of severe wind over 30 yrs
- —
Air-quality risk No data
- Unhealthy air days now
- —
- Unhealthy air days in 30 yrs
- —
Risk factors via First Street. Map © Google.
Why this score? — see what drove the F grade
The composite is a weighted blend of 9 inputs, each scored 0–100. Each bar is that input's sub-score; the figure is the points it added to the 100-point composite (weight × sub-score).
- Cash flow +7.6/30.0
- ARV discount +7.5/15.0
- Schools +5.1/10.0
- Condition / age +4.8/5.0
- Livability +3.8/5.0
- Rent growth +2.6/5.0
- 1% rule +1.8/10.0
- DSCR +1.7/10.0
- Appreciation +0.0/10.0
$294,850
🖨 Deal sheet (PDF) 📄 Offer letter ✓ Due diligence
Listing remarks
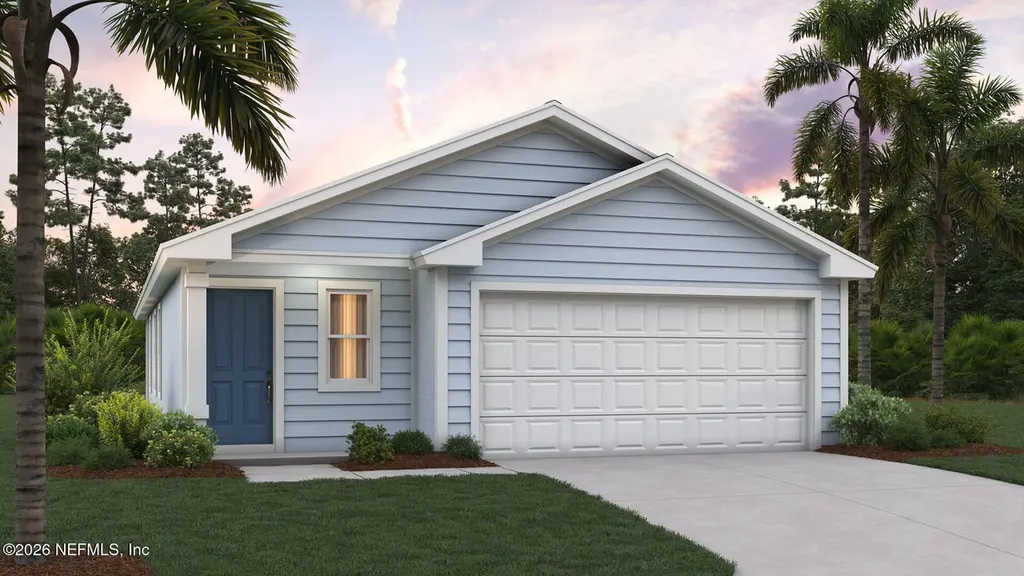
Welcome home to this thoughtfully designed new Express Series floor plan 1,245 sq. ft. single-family home called the Downing, offering the perfect blend of comfort and functionality. Featuring 3 bedrooms, 2 bathrooms, and a 2-car garage, this layout maximizes every square foot with open living spaces ideal for everyday living and entertaining. The spacious kitchen is perfectly positioned for hosting, with ample counter space and a view of the entire main living area - so you're always part of the conversation. Plenty of windows in the space create a bright and welcoming atmosphere. The private primary suite includes an en-suite bath and generous closet space, while two additional bedrooms p
Key facts
- 2 garage spots
- Community pool
- Built 2026
Neighborhood map
What this means for you Summary
Snapshot
- This is a 3-bed/2.0-bath land listed at $295k. Condition is rated excellent.
Deal economics
- At list price, monthly cash flow is $-359 ($-4k/yr) — negative.
- To cash-flow at today's rent, offer at most $231k (21.5% below list).
- To meet the 1% rule (rent ≥ 1% of price), the offer needs to be $201k (31.9% below list).
- Recommended offer: $201k (31.9% below list) — sets the bar for 1% rule.
Location & tenants
- Location reads 75/100 on livability (#245 in FL, #3,868 nationally) — a middle-class / working-renter tenant base. Strengths: cost of living A+, housing A+, health & safety A+; Watch: amenities F, commute F.
- Clay (suburban): math 58% / reading 59% proficiency, ranked #14 of 73 in FL (top 19%) — acceptable for families but not a draw, mixed tenant base, ~2y average lease.
- Zoned schools: Charles E. Bennett Elementary School (math 41% / reading 39%, grade F, #1,491 of 2,144 statewide, top 70%, 624 students, 100% FRL); Green Cove Springs Junior High School (math 63% / reading 60%, grade B+, #124 of 571 statewide, top 22%, 799 students, 38% FRL); Clay High School (math 37% / reading 53%, grade D-, #228 of 667 statewide, top 35%, 1,666 students, 43% FRL) — zoned schools average 60% FRL vs 35% district-wide (25 pts higher); higher-poverty schools than district average — tighter screening recommended.
- Market conditions: Rents flat; 891 active listings in the ZIP; 7 comparable units currently listed for rent nearby; rentals leasing fast (median 6d on market — plan ~1-2 weeks tenant-placement turnaround); solid renter incomes; 1,876 units permitted in Clay County in 2024 (14 in 5+ unit buildings).
Forward outlook
- Local home prices are declining (-3.0%/yr); year-one equity from $2k of loan paydown is wiped out by about $9k of value loss. Plan a longer hold.
- Clay County population projected at +19% by 2050 — long-run rental-demand tailwind backs the buy-and-hold thesis.
Negotiation context
- It's been on market 26 days — a 2% lower offer ($290k) is reasonable based on typical stale-listing flexibility.
Questions for the listing agent
- What do current leases actually rent for vs. the listed asking? Can we see a recent rent roll and the last 12 months of T-12 income?
- What does the HOA fee cover, when was the last increase, and are there any pending special assessments or reserve-fund shortfalls?
- Is there a deadline driving the sale (1031 exchange, divorce, estate, relocation)? That informs how much negotiation room exists.
- The area grade is low — what's the realistic commute time and amenity access for the typical tenant pool here? Any planned neighborhood developments (good or bad) we should know about?
- What's the average days-on-market for RENTAL listings here right now (not sales)? A rising rental-DOM trend means longer vacancies and softer asking-rent achievability than the comps imply.
- What's the recent tenant-quality profile in this submarket — average credit score on applications, eviction rate, late-payment / NSF rate, and stable-employment percentage? A property-management company in the area should have these aggregated.
- How much new for-sale + rental construction is in the pipeline within 1–3 miles? Heavy new supply typically softens prices + rents 12–24 months out; constrained supply supports both.
Investment metrics
- 1% rule
- 0.68% ✗
- Cap rate
- 4.83%
- Cash-on-cash
- -5.21%
- DSCR
- 0.77
- GRM
- 12.2
CMA / ARV
No comps found within radius.
Projected returns pro-forma
-3.0% appreciation · 0.46% rent growth · sell at horizon
- IRR
- -27.9%
- Equity multiple
- 0.08×
- Total profit
- $-75,651
- Equity at exit
- $43,963
- IRR
- -38.7%
- Equity multiple
- -0.39×
- Total profit
- $-114,907
- Equity at exit
- $25,493
Cash invested: $82,558 (down + closing). Projections, not guarantees.
Landlord ↔ Tenant lean methodology
- Overall (STATE)
- 87 Strongly Landlord-Friendly
- State Florida
- 87 Strongly Landlord-Friendly · R+3
- County
- — inherits STATE
- City
- — inherits STATE
ZIP-level market 32043
- Home prices YoY
- -26.3%
- Rents YoY
- 0.5%
- Active inventory
- 891
- Price-to-rent
- 12.2×
Monthly cashflow live
- Estimated rent
- $2,007 high interval (Pro) →
- Mortgage (P&I)
- −$1,546
- Tax from tax record
- −$267 /mo · $3,202/yr
- Insurance
- −$123
- HOA
- −$8
- Vacancy / Maint / Mgmt
- −$421
- Net cashflow
- $-359
Break-even live
Sensitivity live
| Price | -10% $-192 | -5% $-275 | +0% $-359 | +5% $-442 | +10% $-526 |
|---|---|---|---|---|---|
| Rent | -10% $-517 | -5% $-438 | +0% $-359 | +5% $-279 | +10% $-200 |
| Rate | -1.0pp $-210 | -0.5pp $-284 | base $-359 | +0.5pp $-435 | +1.0pp $-513 |
UW: 25.0% down · 7.5% · 30yr · 1.5% tax · 5.0% vac · 8.0% maint · 8.0% mgmt
Financing live
Cash to close
- Down payment
- $73,712
- Closing costs
- $8,846
- Reserves months
- —
- Total cash needed
- —
Loan-product check · same deal, 3 products live
Conventional
25% down · 7.5% · 30yr
- Down + closing
- —
- Monthly P&I
- —
- Monthly cashflow
- —
- DSCR
- —
- Eligible?
- —
Personal DTI + credit; lowest rate.
DSCR
20% down · 8.5% · 30yr
- Down + closing
- —
- Monthly P&I
- —
- Monthly cashflow
- —
- DSCR
- —
- Eligible?
- —
No personal income docs; deal must DSCR.
Hard money
10% down · 12.0% · 12mo
- Down + closing
- —
- Monthly P&I
- —
- Monthly cashflow
- —
- DSCR
- —
- Eligible?
- —
Short-term bridge; refi at stabilization.
Rent comps 7 comps
| Address | Beds | Baths | Sqft | Rent | $/sqft | DOM | Units | Dist |
|---|---|---|---|---|---|---|---|---|
| 4028 Pine Hill Pt Unit 4028 Green Cove Springs, FL | 3.0 | 2.5 | 1306 | $1,850 | $1.42 | 25d | 1 | 0.50mi |
| 4019 Pine Hill Pt Unit 4019 Green Cove Springs, FL | 3.0 | 2.5 | 1306 | $1,850 | $1.42 | 25d | 1 | 0.50mi |
| 4016 Pine Hill Pt Unit 4016 Green Cove Springs, FL | 3.0 | 2.5 | 1306 | $1,850 | $1.42 | 25d | 1 | 0.51mi |
| 806 Oak St Unit 14 Green Cove Springs, FL | 2.0 | 2.0 | 1200 | $1,600 | $1.33 | 6d | 1 | 1.07mi |
| 806 Oak St Unit 10 Green Cove Springs, FL | 2.0 | 1.0 | 1000 | $1,400 | $1.40 | 5d | 1 | 1.07mi |
| 806 Oak St Unit 14 Green Cove Springs, FL | 2.0 | 2.0 | 1200 | $1,600 | $1.33 | 5d | 1 | 1.07mi |
| 806 Oak St Unit 10 Green Cove Springs, FL | 2.0 | 1.0 | 1000 | $1,400 | $1.40 | 6d | 1 | 1.07mi |
HOA detail
- Monthly dues
- $8 · $96/yr
Listing history 5 events
-
2026-04-27status Pending
-
2026-04-14price $294,850
-
2026-04-01$294,940 Active
-
2026-01-16soldstatus $1,530,000
-
2025-08-22soldstatus $11,212,500
ⓘ Source: listings_history table (triggers on properties + properties_extension) + one-shot
backfill from property_details.listing_events for pre-trigger history.
Tax reassessment forecast FL · Resets to sale price
- Current annual tax
- $3,202 · $267/mo
- Projected year-2 tax
- $3,202 · $267/mo
- Expected delta
- $0/yr ($0/mo · 0.0%)
ⓘ Screening estimate from a state-policy table — verify with the county assessor before closing.
Nearby sold comps map
Loading sold comps map…
Walkable amenities ~0.75 mi
Loading nearby amenities…
Taxation est. · year 1
- Rental income
- $24,080
- − Mortgage interest
- −$16,516
- − Property taxes
- −$3,202
- − Insurance
- −$1,474
- − Repairs & maintenance
- −$1,926
- − Management
- −$1,926
- − HOA
- −$96
- − Depreciation
- −$8,577
- Taxable loss
- −$9,639
- Est. tax savings @ 24.0%
- +$2,313
- After-tax cash flow
- $-1,991/yr
For passive investors: Depreciation is non-cash, so a rental often shows a tax loss while cash-flowing — sheltering income. Rental losses are passive: they offset passive income freely, and up to $25,000/yr can offset ordinary (W-2) income if you actively participate and your MAGI is under $100k (phasing out to $0 by $150k); unused losses carry forward. On sale, claimed depreciation is recaptured at up to 25%, and gains may owe capital-gains tax (a 1031 exchange can defer both). Figures are a year-1 estimate at your 24.0% rate — not tax advice; consult a CPA.
Condition & rehab AI · 13 photos
This thoughtfully designed new single-family home offers a perfect blend of comfort and functionality, with a spacious floor plan and a well-maintained community space.
Value-add opportunities
- Both Landscaping and curb appeal improvements — Enhances the home's aesthetic and appeal to potential buyers and renters.
- Both Smart home integration — Modernizes the home and adds convenience for both buyers and renters.
Renovation cost estimate screening
Value-add ROI direction
- Both Landscaping and curb appeal improvements — Enhances the home's aesthetic and appeal to potential buyers and renters. ↑
- Both Smart home integration — Modernizes the home and adds convenience for both buyers and renters. ↑
ⓘ Cost ranges are severity-bucket heuristics (US national rule-of-thumb). Get contractor quotes + a written scope before underwriting a rehab budget.
Schools (NCES district)
- District
- Clay
- NCES district ID
- 1200300
- Math proficiency
- 58% ▼ -8.00%
- Reading proficiency
- 59% ▼ -3.00%
- Median HH income
- $59,379
- Composite
- 50.73/100
- National rank
- #1815
- State rank
- #14 of 73 in FL
Livability — Green Cove Springs
- Score
- 75/100
- State rank
- #245
- US rank
- #3868
Category grades
Schools grade is shown separately in the Schools card above.
Census & demographics
- Census place
- Green Cove Springs, FL
- County
- Clay County · 208,450 people
- Metro
- Jacksonville, FL
- Population (ZIP)
- 34,562
- Household income
- $84,145
- Rent vs Own
- Severe rent burden
- 449.0
Population outlook (Clay County) Hauer SSP2
- Today (2025)
- 230,495 people
- By 2030
- 242,427 · +5.2%
- By 2040
- 262,244 · +13.8%
- By 2050
- 275,148 · +19.4%
- By 2075
- 295,397 · +28.2%
- By 2100
- 287,592 · +24.8%
Race, ethnicity, and origin ACS 2023
- Neighborhood character
- Predominantly White (77%)
- Race & ethnicity
- White 77% Black 10% Two or more races 7% Hispanic / Latino 6% Asian 2%
- Hispanic origin (detail)
- Mexican 2% Puerto Rican 1%
- Common ancestry
- Slovak 3% Romanian 2% Lithuanian 2%
- Foreign-born
- 5% · Canada
- Languages at home
- 92% English-only · Spanish 5% French/Haitian/Cajun 1% Other Indo-European 1%
Political lean MEDSL · Clay
- 2024 margin
- Solid R (+39.3) · D 29.9% · R 69.2%
- 2008→2024 swing
- +3.6pp toward D · 2008: -42.8pp · 2024: -39.3pp
- All cycles
- 2024: R+39.3 2020: R+37.1 2016: R+44.3 2012: R+45.8 2008: R+42.8
Not yet ingested
- Civics
- —
Market trends
- HPI YoY
- ▼ -107.34%
- Current HPI
- 301.3212
- Rent YoY
- ▲ 0.46%
- Metro
- Jacksonville, FL
- State GDP YoY
- ▲ 3.28%
- F500 in state
- 36
Industry mix (Fortune 500 HQ in FL)
| Industry | F500 HQs | Revenue |
|---|---|---|
| Industrial Technology | 2 | $29B |
|
||
| Insurance | 2 | $17B |
|
||
| Retail | 1 | $60B |
|
||
| Technology Distribution | 1 | $58B |
|
||
| Homebuilding | 1 | $35B |
|
||
| Technology Manufacturing | 1 | $35B |
|
||
Price history
-97.4% since first listed5 events — show timeline
- 2026-04-27 Pending — realMLS
- 2026-04-14 Price Changed $294,850 realMLS
- 2026-04-01 Listed $294,940 realMLS
- 2026-01-16 Sold (Public Records) $1,530,000 Public Records
- 2025-08-22 Sold (Public Records) $11,212,500 Public Records
Cash-flow waterfall
monthlySold comps — $/sqft
last 12 mo · ≤1 miLoading sold comps…