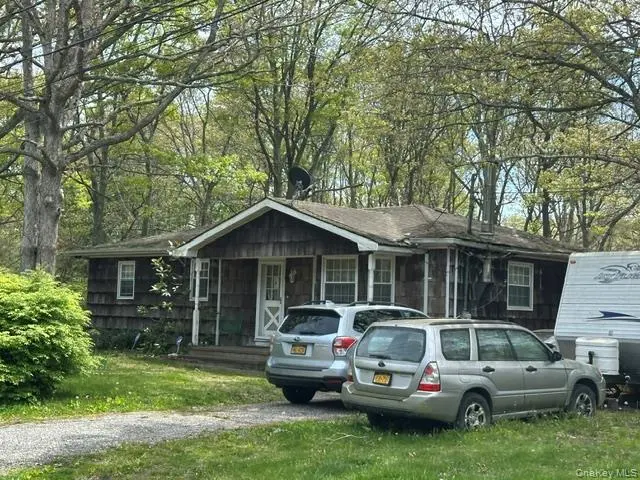
358 S Service Rd · Center Moriches, NY
Flood risk 1/10 · Minimal
- FEMA flood zone
- X (unshaded)
- Chance of flooding over 30 yrs
- 0.0%
- Est. flood insurance / yr
- $473 – $860
Fire risk 2/10 · Minimal
- Est. fire insurance / yr
- $691 – $1,283
Heat risk 4/10 · Minor
- Hot days now (above 92°F)
- 7 days/yr
- Hot days in 30 yrs
- 19 days/yr
Wind risk 8/10 · Major
- Chance of severe wind over 30 yrs
- 80.0%
Air-quality risk 4/10 · Minor
- Unhealthy air days now
- 3 days/yr
- Unhealthy air days in 30 yrs
- 5 days/yr
Risk factors via First Street. Map © Google.
Why this score? — see what drove the B- grade
The composite is a weighted blend of 9 inputs, each scored 0–100. Each bar is that input's sub-score; the figure is the points it added to the 100-point composite (weight × sub-score).
- Cash flow +26.2/30.0
- DSCR +8.9/10.0
- 1% rule +8.7/10.0
- ARV discount +7.5/15.0
- Schools +5.5/10.0
- Livability +3.3/5.0
- Rent growth +2.5/5.0
- Condition / age +2.5/5.0
- Appreciation +0.0/10.0
$290,000
🖨 Deal sheet 📄 Offer letter ✓ Due diligence
Listing remarks
Charming 3-bedroom, 1-bathroom ranch nestled on a spacious half-acre lot, offering approximately 1,100 square feet of single-level living. Built in 1977, this home boasts solid bones and endless potential for customization or renovation. Whether you’re looking to create your dream home or invest in a promising property, this is an ideal opportunity. Sold as-is, this home is ready for your vision—don’t miss out on this chance to own a piece of property with great upside potential.
Key facts
- 0.5 acre lot
- Built 1977
- Listed 12 days
Property features AI
Exterior
- Parking: Driveway
- Utilities: Cesspool sewer; Electricity available
- Home design: Single family residence
- Construction: Shingle siding construction
- Exterior features: Shingle siding; Not waterfront
Interior
- Kitchen: No appliances listed
- Bedrooms: Bedroom on the first floor
- Bathrooms: 1 full bathroom
- Heating & cooling: No cooling; Heating: other
- Interior features: First-floor bedroom; Basement (see remarks); Attic (see remarks); 5 total rooms
- Laundry & utility: No washer/dryer specified
Neighborhood map
What this means for you Summary
Snapshot
- This is a 3-bed/1.0-bath single-family listed at $290k.
Deal economics
- At list price, monthly cash flow is $739 ($9k/yr) — positive.
- The deal already cash-flows at list — no discount required.
- Meets the 1% rule at list price ($4k rent vs $290k).
- Cap rate 9.3% vs local median 1.9% in Center Moriches — top-decile yield for the area; either an underpriced asset or a hidden risk that comps aren't pricing in. Stress-test before assuming the spread holds.
Location & tenants
- Location reads 66/100 on livability (#641 in NY) — a middle-class / working-renter tenant base. Strengths: employment A+, housing A+, crime A-; Watch: amenities F, commute F, cost of living F.
- Center Moriches Union Free School District (suburban): math 65% / reading 55% proficiency, ranked #188 of 590 in NY (top 32%) — acceptable for families but not a draw, mixed tenant base, ~2y average lease; only 18% free/reduced lunch — higher-income household profile.
- Zoned schools: Clayton Huey Elementary School (math 42% / reading 52%, grade D-, #1,195 of 2,108 statewide, top 60%, 598 students, 28% FRL); Center Moriches Middle School (math 57% / reading 52%, grade B-, #214 of 729 statewide, top 31%, 325 students, 29% FRL); Center Moriches High School (math 92% / reading 64%, grade A-, #568 of 1,100 statewide, top 52%, 556 students, 25% FRL).
- Market conditions: 64 active listings in the ZIP; 5 comparable units currently listed for rent nearby; rentals leasing fast (median 1d on market — plan ~1-2 weeks tenant-placement turnaround); 1,366 units permitted in Suffolk County in 2024 (216 in 5+ unit buildings).
Forward outlook
- Local home prices are declining (-3.0%/yr); year-one equity from $2k of loan paydown is wiped out by about $9k of value loss. Plan a longer hold.
- Suffolk County population projected to shrink 5% by 2050 — rents likely to lag national; underwrite the cash flow, not the appreciation.
- At projected returns (-3.0% appreciation + 3.0% rent growth), your $81k cash investment doubles in ~10 years — after that, you're playing with house money.
Negotiation context
- Only 12 days on market — expect competitive offers; lowballing is unlikely to land.
- 3 sale attempts with the ask held roughly flat each time — persistent listings suggest the price (not the market) is what's stuck; bring a comps-based counter.
Risks & watch-outs
- Watch-outs: property tax is 3.1% of price.
- Climate carrying-cost: severe wind risk, 80% chance of damaging wind over 30y — expect insurance premiums to compound above CPI over the hold.
Questions for the listing agent
- Built in 1977 — when were the roof, HVAC, electrical panel, plumbing, and water heater last replaced?
- Property tax is high relative to price — has the assessment been appealed recently, and will the sale trigger a re-assessment?
- Is there a deadline driving the sale (1031 exchange, divorce, estate, relocation)? That informs how much negotiation room exists.
- Schools are A-rated — typically a magnet for longer-tenancy family renters. What's the average tenant stay here, and is there a school-zone premium baked into asking?
- What's the average days-on-market for RENTAL listings here right now (not sales)? A rising rental-DOM trend means longer vacancies and softer asking-rent achievability than the comps imply.
- What's the recent tenant-quality profile in this submarket — average credit score on applications, eviction rate, late-payment / NSF rate, and stable-employment percentage? A property-management company in the area should have these aggregated.
- How much new for-sale + rental construction is in the pipeline within 1–3 miles? Heavy new supply typically softens prices + rents 12–24 months out; constrained supply supports both.
Investment metrics
- 1% rule
- 1.37% ✓
- Cap rate
- 9.35%
- Cash-on-cash
- 10.92%
- DSCR
- 1.49
- GRM
- 6.1
CMA / ARV
- ARV (on-the-fly)
- $671,000
- Comps found
- 4
Show comp detail 4 sales within ~0.75 mi
| Address | Dist | Beds/Ba | Sqft | Sold | Price | $/sf | Match |
|---|---|---|---|---|---|---|---|
| 14 Wiltshire Ct | 0.60mi | 3/1.0 | 1,073 (-2%) | 2mo | $655,000 | $610 | 66 |
| 225 Chichester Ave | 0.58mi | 3/1.0 | 1,150 (+4%) | 5mo | $440,000 | $383 | 61 |
| 347 Wading River Rd | 0.58mi | 3/2.0 | 1,024 (-7%) | 2mo | $635,000 | $620 | 56 |
| 3 Williams St | 0.68mi | 3/3.0 | 1,200 (+9%) | 8mo | $665,000 | $554 | 39 |
Match score weights: distance 35% · size 25% · config 20% · recency 20%. Top-matched comps best support the ARV.
Projected returns pro-forma
-3.0% appreciation · 3.0% rent growth · sell at horizon
- IRR
- 0.1%
- Equity multiple
- 1.00×
- Total profit
- $353
- Equity at exit
- $43,240
- IRR
- 9.9%
- Equity multiple
- 1.76×
- Total profit
- $62,115
- Equity at exit
- $25,074
Cash invested: $81,200 (down + closing). Projections, not guarantees.
Landlord ↔ Tenant lean methodology
- Overall (STATE)
- 15 Strongly Tenant-Friendly
- State New York
- 15 Strongly Tenant-Friendly · D+10
- County
- — inherits STATE
- City
- — inherits STATE
ZIP-level market 11934
- Home prices YoY
- -21.5%
- Active inventory
- 64
- Price-to-rent
- 6.1×
Monthly cashflow live
- Estimated rent
- $3,974 high interval (Pro) →
- Mortgage (P&I)
- −$1,521
- Tax from tax record
- −$759 /mo · $9,114/yr
- Insurance
- −$121
- HOA
- −$0
- Vacancy / Maint / Mgmt
- −$835
- Net cashflow
- $739
Break-even live
UW: 25.0% down · 7.5% · 30yr · 1.5% tax · 5.0% vac · 8.0% maint · 8.0% mgmt
Financing live
Cash to close
- Down payment
- $72,500
- Closing costs
- $8,700
- Reserves months
- —
- Total cash needed
- —
Loan-product check · same deal, 3 products live
Conventional
25% down · 7.5% · 30yr
- Down + closing
- —
- Monthly P&I
- —
- Monthly cashflow
- —
- DSCR
- —
- Eligible?
- —
Personal DTI + credit; lowest rate.
DSCR
20% down · 8.5% · 30yr
- Down + closing
- —
- Monthly P&I
- —
- Monthly cashflow
- —
- DSCR
- —
- Eligible?
- —
No personal income docs; deal must DSCR.
Hard money
10% down · 12.0% · 12mo
- Down + closing
- —
- Monthly P&I
- —
- Monthly cashflow
- —
- DSCR
- —
- Eligible?
- —
Short-term bridge; refi at stabilization.
Rent comps 5 comps
| Address | Beds | Baths | Sqft | Rent | $/sqft | DOM | Units | Dist |
|---|---|---|---|---|---|---|---|---|
| 201 Jerusalem Hollow Rd Manorville, NY | 2.0–3.0 | 2.0–2.5 | 1485 | $4,757 | $3.20 | 1d | 10 | 0.52mi |
| 87 Acorn Cir Moriches, NY | 2.0 | 2.0–2.5 | 1487 | $4,006 | $2.69 | 1d | 8 | 0.53mi |
| 20 Mirror Ln Moriches, NY | 2.0 | 2.0–2.5 | 1195 | $3,590 | $3.00 | 1d | 3 | 0.72mi |
| 1b Meadowoods Ln Moriches, NY | 1.0–2.0 | 1.0–2.0 | 896 | $3,122 | $3.48 | 1d | 56 | 1.03mi |
| 310 A Frowein Rd Brookhaven, NY | 3.0 | 1.0 | 981 | $4,000 | $4.08 | 1d | 1 | 1.31mi |
Listing history 8 events
-
2026-06-02status $290,000 Pending 12 DOM
-
2026-06-01days on market $290,000 Active 12 DOM
-
2026-05-31days on market $290,000 Active 11 DOM
-
2026-05-20$290,000 Active
-
2025-12-07historical
-
2025-12-06status Active
-
2025-07-31status Pending
-
2025-07-08$305,000 Active
ⓘ Source: listings_history table (triggers on properties + properties_extension) + one-shot
backfill from property_details.listing_events for pre-trigger history.
Tax reassessment forecast NY · Partial reset (capped growth)
- Current annual tax
- $9,114 · $759/mo
- Projected year-2 tax
- $9,114 · $759/mo
- Expected delta
- $0/yr ($0/mo · 0.0%)
ⓘ Screening estimate from a state-policy table — verify with the county assessor before closing.
Climate risk First Street
- Flood 1/10 Low FEMA zone X (unshaded) · 0% chance over 30 yrs
- Wildfire 2/10 Low
- Heat 4/10 Moderate 7 d/yr ≥92°F today · 19 d/yr by 30 yrs out
- Wind 8/10 Severe 80% chance of damaging wind over 30 yrs
- Air quality 4/10 Moderate 3 unhealthy d/yr today · 5 by 30 yrs out
Nearby sold comps map
Loading sold comps map…
Walkable amenities ~0.75 mi
Loading nearby amenities…
Taxation est. · year 1
- Rental income
- $47,692
- − Mortgage interest
- −$16,245
- − Property taxes
- −$9,114
- − Insurance
- −$1,450
- − Repairs & maintenance
- −$3,815
- − Management
- −$3,815
- − Depreciation
- −$8,436
- Taxable income
- $4,816
- Est. tax owed @ 24.0%
- −$1,156
- After-tax cash flow
- $7,707/yr
For passive investors: Depreciation is non-cash, so a rental often shows a tax loss while cash-flowing — sheltering income. Rental losses are passive: they offset passive income freely, and up to $25,000/yr can offset ordinary (W-2) income if you actively participate and your MAGI is under $100k (phasing out to $0 by $150k); unused losses carry forward. On sale, claimed depreciation is recaptured at up to 25%, and gains may owe capital-gains tax (a 1031 exchange can defer both). Figures are a year-1 estimate at your 24.0% rate — not tax advice; consult a CPA.
Schools (NCES district)
- District
- Center Moriches Union Free School District
- NCES district ID
- 3606840
- Math proficiency
- 65% ▼ -9.00%
- Reading proficiency
- 55% ▼ -6.00%
- Median HH income
- $86,698
- Composite
- 54.64/100
- National rank
- #1332
- State rank
- #188 of 590 in NY
Livability — Center Moriches
- Score
- 66/100
- State rank
- #641
- US rank
- #11936
Category grades
Schools grade is shown separately in the Schools card above.
Census & demographics
- Census place
- Center Moriches, NY
- City population
- 8,222
- Population (ZIP)
- 8,222
Population outlook (Suffolk County) Hauer SSP2
- Today (2025)
- 1,505,262 people
- By 2030
- 1,498,318 · -0.5%
- By 2040
- 1,471,101 · -2.3%
- By 2050
- 1,424,848 · -5.3%
- By 2075
- 1,337,157 · -11.2%
- By 2100
- 1,217,720 · -19.1%
Race, ethnicity, and origin ACS 2023
- Neighborhood character
- Predominantly White (79%)
- Race & ethnicity
- White 79% Hispanic / Latino 14% Two or more races 3% Black 2% Asian 2%
- Hispanic origin (detail)
- Common ancestry
- Italian 6% Romanian 6% Scotch-Irish 3%
- Foreign-born
- 6% · Canada, China
- Languages at home
- 90% English-only · Spanish 5% Other Indo-European 2% Chinese 1%
Political lean MEDSL · Suffolk
- 2024 margin
- Lean R (+10.0) · D 45.0% · R 55.0%
- 2008→2024 swing
- -16.0pp toward R · 2008: 6.0pp · 2024: -10.0pp
- All cycles
- 2024: R+10.0 2020: R+0.0 2016: R+8.2 2012: D+2.9 2008: D+6.0
Not yet ingested
- Civics
- —
Market trends
- HPI YoY
- ▼ -95.89%
- Current HPI
- 350.6186
- Rent YoY
- —
- Metro
- —
- State GDP YoY
- ▲ 2.60%
- F500 in state
- 92
Industry mix (Fortune 500 HQ in NY)
| Industry | F500 HQs | Revenue |
|---|---|---|
| Financial Services | 10 | $950B |
|
||
| Consumer Goods | 9 | $162B |
|
||
| Insurance | 4 | $225B |
|
||
| Telecommunications | 2 | $144B |
|
||
| Pharmaceuticals | 2 | $112B |
|
||
| Media / Entertainment | 2 | $69B |
|
||
Price history
-4.9% since first listed5 events — show timeline
- 2026-05-20 Listed $290,000 OneKey® MLS as Distributed by MLS Grid
- 2025-12-07 Listing Removed — OneKey® MLS as Distributed by MLS Grid
- 2025-12-06 Relisted — OneKey® MLS as Distributed by MLS Grid
- 2025-07-31 Pending — OneKey® MLS as Distributed by MLS Grid
- 2025-07-08 Listed $305,000 OneKey® MLS as Distributed by MLS Grid
Property tax history
+1.1%/yrLatest (2025): $9,114 · +0.0% YoY. Source: county tax records.
Cash-flow waterfall
monthlySold comps — $/sqft
last 12 mo · ≤1 miLoading sold comps…