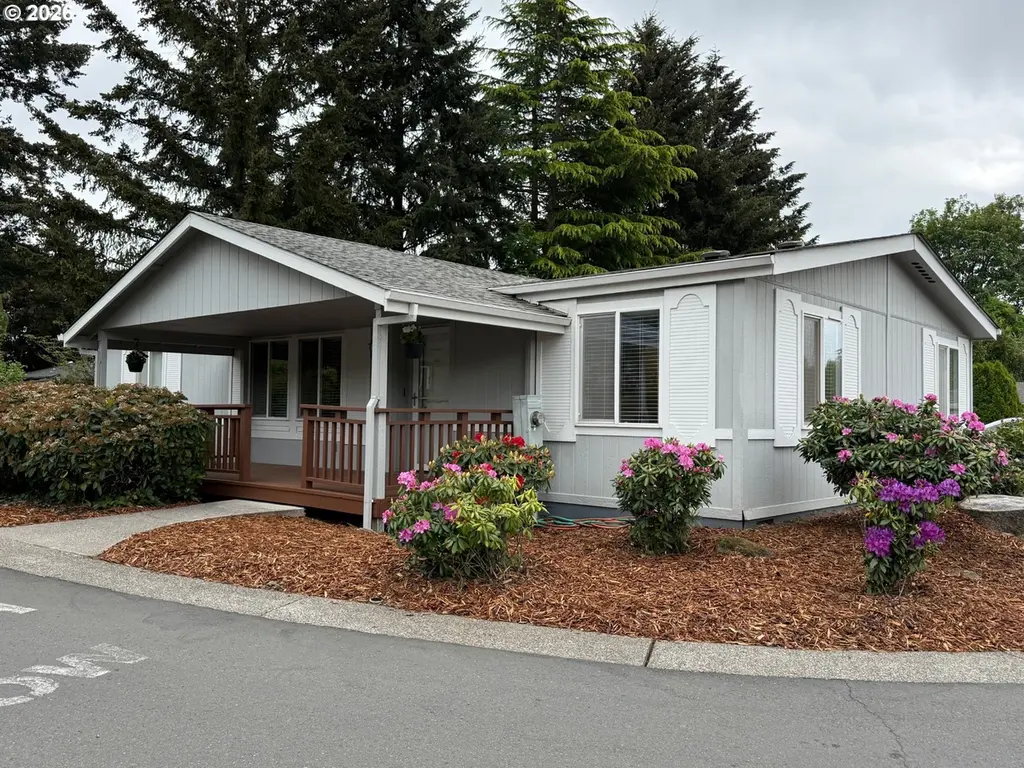
5701 NE St Johns Rd #64 · Minnehaha, WA
Flood risk No data
- FEMA flood zone
- —
- Chance of flooding over 30 yrs
- —
- Est. flood insurance / yr
- —
Fire risk No data
- Est. fire insurance / yr
- —
Heat risk No data
- Hot days now (above threshold)
- —
- Hot days in 30 yrs
- —
Wind risk No data
- Chance of severe wind over 30 yrs
- —
Air-quality risk No data
- Unhealthy air days now
- —
- Unhealthy air days in 30 yrs
- —
Risk factors via First Street. Map © Google.
Why this score? — see what drove the C grade
The composite is a weighted blend of 9 inputs, each scored 0–100. Each bar is that input's sub-score; the figure is the points it added to the 100-point composite (weight × sub-score).
- Cash flow +24.2/30.0
- DSCR +7.8/10.0
- 1% rule +6.3/10.0
- ARV discount +5.3/15.0
- Schools +4.3/10.0
- Livability +4.2/5.0
- Rent growth +3.0/5.0
- Condition / age +2.5/5.0
- Appreciation +0.0/10.0
$175,000
🖨 Deal sheet 📄 Offer letter ✓ Due diligence
Listing remarks MLS
Space rent is $465/month, 55+ community of Manuf Homes, great park! Well cared for 2 bed, 2 full bath with large utility. Great room w/ vaulted ceilings. Kitchen has tons of storage, utility w/ sink and large pantry. Dining area off kitchen. Master w/ walk-in closet, full bath. 2nd bedroom on opposite side for extra privacy. Park has paved wide streets and sidewalks., off street parking and 87 sites.
Key facts
- Charming dining area
- Laundry room
- Spacious kitchen
Tags
Property features AI
Finance
- Other: Property is not attached to another dwelling
- Financial info: Monthly lot rent (land lease) applies; lease expires December 31, 2026
- HOA & community: Located in Oak Haven Mobile Home Park; Park allows pets: up to 2 pets, 30 lbs or less each; Land lease in place (monthly lot rent)
Exterior
- Parking: Carport; Off-street parking
- Utilities: Electric fuel; Public water; Public sewer; Cable internet
- Home design: Manufactured home in a park; Single-story (main living on one level); Resale property; Built in 1993; No notable view
- Construction: Composition roof; Concrete perimeter foundation
- Exterior features: Porch; Tool shed; Workshop; Yard; Corner, level lot; Paved road access; T-111 siding
Interior
- Kitchen: Free-standing range; Microwave; Garbage disposal
- Bedrooms: Primary bedroom (main level); Second bedroom (main level)
- Bathrooms: 2 full bathrooms (both on main level)
- Heating & cooling: Forced air heating; No central air listed
- Interior features: Ceiling fans; High-speed internet; Double-pane windows with vinyl frames; Accessible — ground level, minimal steps, one level
- Laundry & utility: Electric tank water heater
Neighborhood map
What this means for you Summary
Snapshot
- This is a 2-bed/2.0-bath manufactured listed at $175k.
Deal economics
- At list price, monthly cash flow is $350 ($4k/yr) — positive.
- The deal already cash-flows at list — no discount required.
- Meets the 1% rule at list price ($2k rent vs $175k).
- Recommended offer: $172k (1.5% below list) — sets the bar for market timing.
- Cap rate 8.7% vs local median 2.8% in Minnehaha — top-decile yield for the area; either an underpriced asset or a hidden risk that comps aren't pricing in. Stress-test before assuming the spread holds.
Location & tenants
- Location reads 83/100 on livability (#47 in WA, #847 nationally) — a professional / high-income tenant draw. Strengths: commute A+, employment A+, housing A+; Watch: amenities F, cost of living D-.
- Vancouver School District (suburban): math 43% / reading 53% proficiency, ranked #156 of 291 in WA (top 54%) — families likely to look elsewhere, expect single-tenant / working-renter base with shorter leases.
- Zoned schools: Minnehaha Elementary School (517 students, 59% FRL); Jason Lee Middle School (532 students, 59% FRL); Hudson'S Bay High School (1,143 students, 64% FRL) — zoned schools average 61% FRL vs 44% district-wide (16 pts higher); higher-poverty schools than district average — tighter screening recommended.
- Market conditions: Rents rising (+2.0%/yr); 266 active listings in the ZIP; 40 comparable units currently listed for rent nearby; rentals leasing fast (median 8d on market — plan ~1-2 weeks tenant-placement turnaround); solid renter incomes; 3,547 units permitted in Clark County in 2024 (1,361 in 5+ unit buildings).
- This rent runs 31% of the median local income ($77k/yr) — at the standard rent-burdened threshold; future hikes will face affordability resistance.
Forward outlook
- Local home prices are declining (-3.0%/yr); year-one equity from $1k of loan paydown is wiped out by about $5k of value loss. Plan a longer hold.
- Clark County population projected at +29% by 2050 — long-run rental-demand tailwind backs the buy-and-hold thesis.
Negotiation context
- It's been on market 17 days — a 2% lower offer ($172k) is reasonable based on typical stale-listing flexibility.
- 2 sale attempts since 10y ago with the ask held roughly flat each time — persistent listings suggest the price (not the market) is what's stuck; bring a comps-based counter.
- Current owner paid $80k; list at $175k implies a 120% gain — meaningful room to come down on a strong offer.
Questions for the listing agent
- Is there a deadline driving the sale (1031 exchange, divorce, estate, relocation)? That informs how much negotiation room exists.
- What's the average days-on-market for RENTAL listings here right now (not sales)? A rising rental-DOM trend means longer vacancies and softer asking-rent achievability than the comps imply.
- What's the recent tenant-quality profile in this submarket — average credit score on applications, eviction rate, late-payment / NSF rate, and stable-employment percentage? A property-management company in the area should have these aggregated.
- How much new for-sale + rental construction is in the pipeline within 1–3 miles? Heavy new supply typically softens prices + rents 12–24 months out; constrained supply supports both.
Investment metrics
- 1% rule
- 1.13% ✓
- Cap rate
- 8.69%
- Cash-on-cash
- 8.56%
- DSCR
- 1.38
- GRM
- 7.4
CMA / ARV
- ARV (on-the-fly)
- $166,904
- Comps found
- 9
Show comp detail 9 sales within ~0.75 mi
| Address | Dist | Beds/Ba | Sqft | Sold | Price | $/sf | Match |
|---|---|---|---|---|---|---|---|
| 5701 NE ST Johns Rd #4 | 0.01mi | 2/2.0 | 1,392 (+3%) | 4mo | $167,000 | $120 | 90 |
| 5701 NE ST Johns Rd #27 | 0.01mi | 2/2.0 | 1,362 (+1%) | 10mo | $175,000 | $128 | 89 |
| 5701 NE St Johns Rd #60 | 0.01mi | 3/2.0 (+1) | 1,412 (+5%) | 4mo | $177,500 | $126 | 83 |
| 5701 NE St Johns Rd #43 | 0.01mi | 2/2.0 | 1,268 (-6%) | 12mo | $140,000 | $110 | 80 |
| 5701 NE St Johns Rd #50 | 0.01mi | 2/2.0 | 1,277 (-5%) | 22mo | $150,900 | $118 | 73 |
| 5701 NE ST Johns Rd #9 | 0.01mi | 2/2.0 | 1,236 (-8%) | 19mo | $115,000 | $93 | 70 |
| 5701 NE St Johns Rd #86 | 0.01mi | 3/2.0 (+1) | 1,512 (+12%) | 7mo | $212,000 | $140 | 68 |
| 5701 NE ST Johns Rd #40 | 0.01mi | 2/2.0 | 1,484 (+10%) | 20mo | $218,000 | $147 | 66 |
| 5701 NE ST Johns Rd #74 | 0.01mi | 3/2.0 (+1) | 1,454 (+8%) | 24mo | $179,900 | $124 | 61 |
Match score weights: distance 35% · size 25% · config 20% · recency 20%. Top-matched comps best support the ARV.
Projected returns pro-forma
-3.0% appreciation · 2.05% rent growth · sell at horizon
- IRR
- -4.4%
- Equity multiple
- 0.84×
- Total profit
- $-7,932
- Equity at exit
- $26,093
- IRR
- 4.2%
- Equity multiple
- 1.29×
- Total profit
- $14,360
- Equity at exit
- $15,131
Cash invested: $49,000 (down + closing). Projections, not guarantees.
Landlord ↔ Tenant lean methodology
- Overall (STATE)
- 28 Tenant-Leaning
- State Washington
- 28 Tenant-Leaning · D+8
- County
- — inherits STATE
- City
- — inherits STATE
ZIP-level market 98661
- Rents YoY
- 2.0%
- Active inventory
- 266
- Price-to-rent
- 7.4×
Monthly cashflow live
- Estimated rent
- $1,973 high interval (Pro) →
- Mortgage (P&I)
- −$918
- Tax est. 1.5%
- −$219 /mo · $2,625/yr
- Insurance
- −$73
- HOA
- −$0
- Vacancy / Maint / Mgmt
- −$414
- Net cashflow
- $350
Break-even live
UW: 25.0% down · 7.5% · 30yr · 1.5% tax · 5.0% vac · 8.0% maint · 8.0% mgmt
Financing live
Cash to close
- Down payment
- $43,750
- Closing costs
- $5,250
- Reserves months
- —
- Total cash needed
- —
Loan-product check · same deal, 3 products live
Conventional
25% down · 7.5% · 30yr
- Down + closing
- —
- Monthly P&I
- —
- Monthly cashflow
- —
- DSCR
- —
- Eligible?
- —
Personal DTI + credit; lowest rate.
DSCR
20% down · 8.5% · 30yr
- Down + closing
- —
- Monthly P&I
- —
- Monthly cashflow
- —
- DSCR
- —
- Eligible?
- —
No personal income docs; deal must DSCR.
Hard money
10% down · 12.0% · 12mo
- Down + closing
- —
- Monthly P&I
- —
- Monthly cashflow
- —
- DSCR
- —
- Eligible?
- —
Short-term bridge; refi at stabilization.
Rent comps 40 comps
| Address | Beds | Baths | Sqft | Rent | $/sqft | DOM | Units | Dist |
|---|---|---|---|---|---|---|---|---|
| 3512 NE 51st St Vancouver, WA | 2.0 | 1.0 | 950 | $1,489 | $1.57 | 2d | 1 | 0.27mi |
| 5009 NE 29th Ave Vancouver, WA | 3.0 | 2.5 | 1588 | $3,200 | $2.02 | 2d | 1 | 0.45mi |
| 4802 NE 37th Ct Vancouver, WA | 3.0 | 2.5 | 1648 | $2,495 | $1.51 | 23d | 1 | 0.46mi |
| 3503 NE 49th St Vancouver, WA | 2.0 | 1.5 | 1100 | $1,409 | $1.28 | 23d | 1 | 0.47mi |
| 3805 NE 49th St Unit B204 Vancouver, WA | 3.0 | 2.0 | 1325 | $1,899 | $1.43 | 23d | 1 | 0.47mi |
| 3805 NE 49th St Unit B202 Vancouver, WA | 2.0 | 2.0 | 995 | $1,599 | $1.61 | 23d | 1 | 0.47mi |
| 3805 NE 49th St Unit A103 Vancouver, WA | 2.0 | 2.0 | 995 | $1,599 | $1.61 | 7d | 1 | 0.47mi |
| 5010 NE 29th Ave Vancouver, WA | 3.0 | 2.5 | 1585 | $2,495 | $1.57 | 2d | 1 | 0.47mi |
| 4617 NE St Johns Rd Vancouver, WA | 2.0 | 1.5 | 939 | $1,615 | $1.72 | 7d | 1 | 0.50mi |
| 4501 NE 51st St Vancouver, WA | 2.0 | 1.0 | 900 | $1,399 | $1.55 | 23d | 1 | 0.57mi |
| 3608 NE 42nd St Vancouver, WA | 3.0 | 2.5 | 1776 | $2,495 | $1.40 | 23d | 1 | 0.73mi |
| 4105 NE St Johns Rd Vancouver, WA | 3.0 | 2.0 | 1016 | $1,995 | $1.96 | 16d | 2 | 0.81mi |
| 3008 NE 74th St Vancouver, WA | 3.0 | 2.5 | 1834 | $2,450 | $1.34 | 16d | 1 | 0.95mi |
| 5313 NE 68th St Vancouver, WA | 2.0–3.0 | 2.0 | 1108 | $1,625 | $1.47 | 16d | 2 | 0.96mi |
| 3005 NE 75th St Vancouver, WA | 3.0 | 2.5 | 1849 | $2,615 | $1.41 | 21d | 1 | 0.97mi |
| 5811 NE 56th Pl Vancouver, WA | 3.0 | 2.5 | 1608 | $2,495 | $1.55 | 23d | 1 | 0.99mi |
| 7714 NE 39th Ct Vancouver, WA | 1.0–2.0 | 1.0–2.0 | 921 | $2,035 | $2.21 | 2d | 12 | 1.01mi |
| 5404 NE 45th St Vancouver, WA | 3.0 | 2.0 | 1276 | $2,795 | $2.19 | 7d | 1 | 1.04mi |
| 5917 NE 58th Ave Vancouver, WA | 3.0 | 2.5 | 1498 | $2,350 | $1.57 | 23d | 1 | 1.07mi |
| 6208 NE 17th Ave Vancouver, WA | 2.0 | 2.0 | 981 | $1,575 | $1.60 | 4d | 7 | 1.08mi |
| 5917 NE 58th St Vancouver, WA | 1.0–3.0 | 1.0–2.0 | 1162 | $1,762 | $1.52 | 7d | 3 | 1.11mi |
| 4316 NE 34th Cir Vancouver, WA | 3.0 | 2.5 | 1482 | $2,450 | $1.65 | 1d | 1 | 1.18mi |
| 6008 NE 64th St Vancouver, WA | 3.0 | 3.0 | 1288 | $2,184 | $1.70 | 7d | 3 | 1.22mi |
| 8007 NE 38th Ave Vancouver, WA | 3.0 | 2.5 | 1477 | $2,395 | $1.62 | 2d | 1 | 1.22mi |
| 6313 NE 61st Ave Vancouver, WA | 3.0 | 2.5 | 1346 | $2,595 | $1.93 | 2d | 1 | 1.27mi |
| 4500 Nicholson Rd Vancouver, WA | 2.0–3.0 | 2.0 | 1034 | $1,549 | $1.50 | 2d | 8 | 1.27mi |
| 8111 NE 36th Ct Vancouver, WA | 3.0 | 2.5 | 1512 | $2,295 | $1.52 | 7d | 1 | 1.28mi |
| 2702 E 33rd St Unit 1334336P Vancouver, WA | 3.0 | 2.0 | 1496 | $5,271 | $3.52 | 23d | 1 | 1.29mi |
| 5114 NE 34th St Vancouver, WA | 2.0 | 2.0 | 998 | $1,595 | $1.60 | 23d | 1 | 1.31mi |
| NE 47 NE 47th Ct Vancouver, WA | 3.0 | 2.5 | 1475 | $2,850 | $1.93 | 1d | 5 | 1.31mi |
| 3100 Falk Rd Vancouver, WA | 2.0–3.0 | 2.0–3.0 | 1234 | $1,649 | $1.34 | 1d | 4 | 1.35mi |
| 2301 NE 81st St Vancouver, WA | 1.0–3.0 | 1.0–2.0 | 1080 | $1,975 | $1.83 | 1d | 10 | 1.35mi |
| 8225 NE St Johns Rd Vancouver, WA | 3.0 | 2.0 | 1584 | $2,048 | $1.29 | 2d | 1 | 1.36mi |
| 1307 NE 70th St Vancouver, WA | 3.0 | 2.0 | 1802 | $2,829 | $1.57 | 23d | 1 | 1.38mi |
| 3011 Fairmount Ave Unit 3011 Vancouver, WA | 2.0 | 1.0 | 1000 | $1,725 | $1.73 | 23d | 1 | 1.38mi |
| 7306 NE 16th Ave #1 Vancouver, WA | 2.0 | 1.0 | 988 | $1,395 | $1.41 | 23d | 1 | 1.39mi |
| 3504 S St Unit C Vancouver, WA | 2.0 | 1.0 | 924 | $1,495 | $1.62 | 23d | 1 | 1.42mi |
| 5406 NE 34th St Unit A2 Vancouver, WA | 2.0 | 1.5 | 1014 | $1,995 | $1.97 | 4d | 1 | 1.42mi |
| 5406 NE 34th St Unit A2 Vancouver, WA | 2.0 | 1.5 | 1014 | $2,095 | $2.07 | 23d | 1 | 1.42mi |
| 5406 NE 34th St Unit A1 Vancouver, WA | 3.0 | 1.5 | 1124 | $2,095 | $1.86 | 4d | 1 | 1.42mi |
Listing history 11 events
-
2026-06-18days on market $175,000 Active 17 DOM
-
2026-06-17days on market $175,000 Active 16 DOM
-
2026-06-16days on market $175,000 Active 15 DOM
-
2026-06-15days on market $175,000 Active 14 DOM
-
2026-06-13days on market $175,000 Active 12 DOM
-
2026-06-09days on market $175,000 Active 8 DOM
-
2026-06-08days on market $175,000 Active 7 DOM
-
2026-06-07days on market $175,000 Active 6 DOM
-
2026-06-03days on market $175,000 Active 2 DOM
-
2026-06-02remarks 699-char remark
-
2026-06-02$175,000 Active 1 DOM
ⓘ Source: listings_history table (triggers on properties + properties_extension) + one-shot
backfill from property_details.listing_events for pre-trigger history.
Nearby sold comps map
Loading sold comps map…
Walkable amenities ~0.75 mi
Loading nearby amenities…
Taxation est. · year 1
- Rental income
- $23,680
- − Mortgage interest
- −$9,803
- − Property taxes
- −$2,625
- − Insurance
- −$875
- − Repairs & maintenance
- −$1,894
- − Management
- −$1,894
- − Depreciation
- −$5,091
- Taxable income
- $1,498
- Est. tax owed @ 24.0%
- −$359
- After-tax cash flow
- $3,835/yr
For passive investors: Depreciation is non-cash, so a rental often shows a tax loss while cash-flowing — sheltering income. Rental losses are passive: they offset passive income freely, and up to $25,000/yr can offset ordinary (W-2) income if you actively participate and your MAGI is under $100k (phasing out to $0 by $150k); unused losses carry forward. On sale, claimed depreciation is recaptured at up to 25%, and gains may owe capital-gains tax (a 1031 exchange can defer both). Figures are a year-1 estimate at your 24.0% rate — not tax advice; consult a CPA.
Schools (NCES district)
- District
- Vancouver School District
- NCES district ID
- 5309270
- Math proficiency
- 43% ▬ 0.00%
- Reading proficiency
- 53% ▬ 0.00%
- Median HH income
- $52,562
- Composite
- 43.45/100
- National rank
- #6479
- State rank
- #156 of 291 in WA
Livability — Minnehaha
- Score
- 83/100
- State rank
- #47
- US rank
- #847
Category grades
Schools grade is shown separately in the Schools card above.
Census & demographics
- Census place
- Minnehaha, WA
- County
- Clark County · 513,189 people
- Metro
- Portland-Vancouver-Hillsboro, OR-WA
- Population (ZIP)
- 50,743
- Household income
- $76,913
- Rent vs Own
- Severe rent burden
- 2384.0
Population outlook (Clark County) Hauer SSP2
- Today (2025)
- 529,610 people
- By 2030
- 563,242 · +6.4%
- By 2040
- 625,905 · +18.2%
- By 2050
- 681,558 · +28.7%
- By 2075
- 805,967 · +52.2%
- By 2100
- 877,450 · +65.7%
Race, ethnicity, and origin ACS 2023
- Neighborhood character
- Majority White (64%)
- Race & ethnicity
- White 64% Hispanic / Latino 21% Two or more races 14% Black 4% Asian 3% Pacific Islander 2%
- Hispanic origin (detail)
- Mexican 18%
- Common ancestry
- Lithuanian 3% Portuguese 3% Subsaharan African 3%
- Foreign-born
- 15% · Canada, Vietnam
- Languages at home
- 76% English-only · Spanish 14% Russian/Polish/Slavic 4% Other Indo-European 2%
Political lean MEDSL · Clark
- 2024 margin
- Lean D (+7.0) · D 52.1% · R 45.1% · Other 2.8%
- 2008→2024 swing
- +0.9pp no change · 2008: 6.1pp · 2024: 7.0pp
- All cycles
- 2024: D+7.0 2020: D+5.1 2016: D+0.1 2012: D+0.1 2008: D+6.1
Not yet ingested
- Civics
- —
Market trends
- HPI YoY
- ▼ -567.83%
- Current HPI
- 308.3632
- Rent YoY
- ▲ 2.05%
- Metro
- Portland-Vancouver-Hillsboro, OR-WA
- State GDP YoY
- ▲ 4.65%
- F500 in state
- 22
Industry mix (Fortune 500 HQ in WA)
| Industry | F500 HQs | Revenue |
|---|---|---|
| Retail | 2 | $269B |
|
||
| Technology / Retail | 1 | $638B |
|
||
| Technology | 1 | $245B |
|
||
| Telecommunications | 1 | $38B |
|
||
| Food / Beverage | 1 | $36B |
|
||
| Automotive / Trucks | 1 | $34B |
|
||
Price history
+120.1% since first listed5 events — show timeline
- 2026-06-01 Listed $175,000 RMLS
- 2016-06-14 Delisted — RMLS
- 2016-05-27 Sold (MLS) $79,500 RMLS
- 2016-05-06 Pending — RMLS
- 2016-05-05 Listed $79,500 RMLS
Property tax history
-4.4%/yrLatest (2026): $288 · +23.7% YoY. Source: county tax records.
Cash-flow waterfall
monthlySold comps — $/sqft
last 12 mo · ≤1 miLoading sold comps…