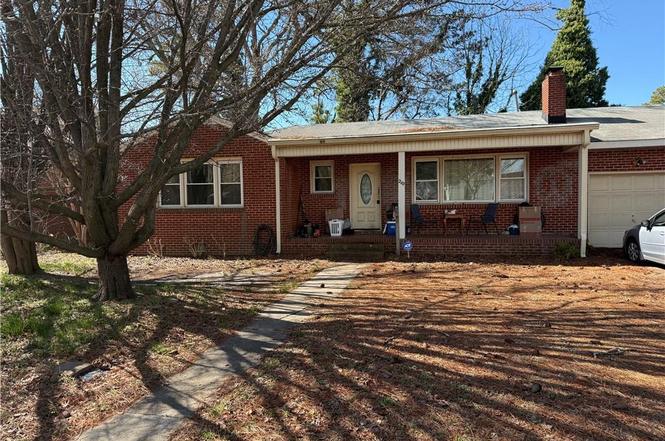
210 Sandpiper Dr · Portsmouth, VA
Flood risk 6/10 · Moderate
- FEMA flood zone
- X (shaded)
- Chance of flooding over 30 yrs
- 0.57%
- Est. flood insurance / yr
- $507 – $1,088
Fire risk 1/10 · Minimal
- Est. fire insurance / yr
- $666 – $1,236
Heat risk 9/10 · Severe
- Hot days now (above 106°F)
- 7 days/yr
- Hot days in 30 yrs
- 15 days/yr
Wind risk 8/10 · Major
- Chance of severe wind over 30 yrs
- 80.0%
Air-quality risk 5/10 · Moderate
- Unhealthy air days now
- 6 days/yr
- Unhealthy air days in 30 yrs
- 7 days/yr
Risk factors via First Street. Map © Google.
Why this score? — see what drove the B grade
The composite is a weighted blend of 9 inputs, each scored 0–100. Each bar is that input's sub-score; the figure is the points it added to the 100-point composite (weight × sub-score).
- Cash flow +28.0/30.0
- ARV discount +15.0/15.0
- DSCR +9.9/10.0
- 1% rule +8.3/10.0
- Schools +3.9/10.0
- Livability +3.7/5.0
- Rent growth +3.3/5.0
- Condition / age +2.5/5.0
- Appreciation +0.0/10.0
$135,000
🖨 Deal sheet (PDF) 📄 Offer letter ✓ Due diligence
Listing remarks
Short sale. No lockbox. Must text agent for an appt.
Key facts
- Garage
- Built 1957
- Listed 3 days
Neighborhood map
What this means for you Summary
Snapshot
- This is a 3-bed/1.0-bath single-family listed at $135k.
Deal economics
- At list price, monthly cash flow is $421 ($5k/yr) — positive.
- The deal already cash-flows at list — no discount required.
- Meets the 1% rule at list price ($2k rent vs $135k).
- Cap rate 10.0% vs local median 4.6% in Portsmouth — top-decile yield for the area; either an underpriced asset or a hidden risk that comps aren't pricing in. Stress-test before assuming the spread holds.
Location & tenants
- Location reads 73/100 on livability (#172 in VA) — a middle-class / working-renter tenant base. Strengths: amenities A+, cost of living A+, housing A+; Watch: employment C-, crime F, commute F.
- Portsmouth City Public School District (urban): math 34% / reading 58% proficiency, ranked #107 of 131 in VA (top 82%) — families likely to look elsewhere, expect single-tenant / working-renter base with shorter leases.
- Zoned schools: Park View Elementary (math 22% / reading 47%, grade F, #966 of 1,108 statewide, top 89%, 463 students, 99% FRL); I.C. Norcom High (math 39% / reading 58%, grade D, #301 of 319 statewide, top 95%, 1,043 students, 100% FRL) — zoned schools average 100% FRL vs 60% district-wide (40 pts higher); higher-poverty schools than district average — tighter screening recommended.
- Market conditions: Rents rising (+3.3%/yr); 134 active listings in the ZIP; 40 comparable units currently listed for rent nearby; rentals at typical pace (median 25d on market — plan ~3-4 weeks tenant-placement turnaround); 300 units permitted in Portsmouth city in 2024 (112 in 5+ unit buildings).
- This rent runs 44% of the median local income ($50k/yr) — at the standard rent-burdened threshold; future hikes will face affordability resistance.
Forward outlook
- Local home prices are declining (-3.0%/yr); year-one equity from $933 of loan paydown is wiped out by about $4k of value loss. Plan a longer hold.
- At projected returns (-3.0% appreciation + 3.3% rent growth), your $38k cash investment doubles in ~9 years — after that, you're playing with house money.
Negotiation context
- Only 3 days on market — expect competitive offers; lowballing is unlikely to land.
Risks & watch-outs
- Watch-outs: built in 1957 — expect roof / HVAC / electrical / plumbing capex.
- Climate carrying-cost: major flood risk; severe wind risk, 80% chance of damaging wind over 30y; extreme-heat days projected 7→15/yr by 2055 (HVAC capex compounding) — expect insurance premiums to compound above CPI over the hold.
Questions for the listing agent
- Built in 1957 — when were the roof, HVAC, electrical panel, plumbing, and water heater last replaced?
- Is there a deadline driving the sale (1031 exchange, divorce, estate, relocation)? That informs how much negotiation room exists.
- Schools are B-rated — typically a magnet for longer-tenancy family renters. What's the average tenant stay here, and is there a school-zone premium baked into asking?
- Crime grade is F in this area — have there been break-ins, vandalism, or insurance claims at this property in the last 3 years? What carrier currently insures it and at what premium?
- What's the average days-on-market for RENTAL listings here right now (not sales)? A rising rental-DOM trend means longer vacancies and softer asking-rent achievability than the comps imply.
- What's the recent tenant-quality profile in this submarket — average credit score on applications, eviction rate, late-payment / NSF rate, and stable-employment percentage? A property-management company in the area should have these aggregated.
- How much new for-sale + rental construction is in the pipeline within 1–3 miles? Heavy new supply typically softens prices + rents 12–24 months out; constrained supply supports both.
Investment metrics
- 1% rule
- 1.33% ✓
- Cap rate
- 10.04%
- Cash-on-cash
- 13.37%
- DSCR
- 1.59
- GRM
- 6.2
CMA / ARV
- ARV (on-the-fly)
- $247,230
- Comps found
- 12
Show comp detail 12 sales within ~0.75 mi
| Address | Dist | Beds/Ba | Sqft | Sold | Price | $/sf | Match |
|---|---|---|---|---|---|---|---|
| 247 Plover Dr | 0.16mi | 4/1.0 (+1) | 1,270 (+5%) | 1mo | $270,000 | $213 | 78 |
| 1708 Spratley St | 0.37mi | 3/1.5 | 1,371 (+14%) | 1mo | $165,000 | $120 | 57 |
| 660 Virginia Ave | 0.30mi | 3/2.5 | 1,340 (+11%) | 6mo | $205,000 | $153 | 57 |
| 2023 Holladay St | 0.27mi | 3/2.5 | 1,036 (-14%) | 2mo | $212,500 | $205 | 56 |
| 1406 Crawford Pkwy | 0.60mi | 3/2.0 | 1,119 (-7%) | 1mo | $213,000 | $190 | 55 |
| 916 Douglas Ave | 0.74mi | 3/2.0 | 1,150 (-5%) | 1mo | $210,000 | $183 | 53 |
| 604 Mt Vernon Ave | 0.61mi | 3/2.0 | 1,296 (+8%) | 4mo | $318,000 | $245 | 52 |
| 152 Owens St | 0.61mi | 3/2.0 | 1,292 (+7%) | 6mo | $278,849 | $216 | 50 |
| 1633 Leckie St | 0.41mi | 3/2.0 | 1,027 (-15%) | 2mo | $265,000 | $258 | 50 |
| 124 Elm Ave | 0.71mi | 3/2.0 | 1,278 (+6%) | 5mo | $260,000 | $203 | 49 |
| 2009 King St | 0.58mi | 3/2.0 | 1,350 (+12%) | 5mo | $188,000 | $139 | 45 |
| 208 Owens St | 0.61mi | 3/2.0 | 1,058 (-12%) | 5mo | $228,000 | $216 | 43 |
Match score weights: distance 35% · size 25% · config 20% · recency 20%. Top-matched comps best support the ARV.
Projected returns pro-forma
-3.0% appreciation · 3.31% rent growth · sell at horizon
- IRR
- 3.8%
- Equity multiple
- 1.15×
- Total profit
- $5,580
- Equity at exit
- $20,129
- IRR
- 13.7%
- Equity multiple
- 2.11×
- Total profit
- $42,006
- Equity at exit
- $11,672
Cash invested: $37,800 (down + closing). Projections, not guarantees.
Landlord ↔ Tenant lean methodology
- Overall (STATE)
- 55 Moderately Landlord-Leaning
- State Virginia
- 55 Moderately Landlord-Leaning · D+2
- County
- — inherits STATE
- City
- — inherits STATE
ZIP-level market 23704
- Home prices YoY
- -4.6%
- Rents YoY
- 3.3%
- Active inventory
- 134
- Price-to-rent
- 6.2×
Monthly cashflow live
- Estimated rent
- $1,801 high interval (Pro) →
- Mortgage (P&I)
- −$708
- Tax from tax record
- −$237 /mo · $2,848/yr
- Insurance
- −$56
- HOA
- −$0
- Vacancy / Maint / Mgmt
- −$378
- Net cashflow
- $421
Break-even live
Sensitivity live
| Price | -10% $498 | -5% $459 | +0% $421 | +5% $383 | +10% $345 |
|---|---|---|---|---|---|
| Rent | -10% $279 | -5% $350 | +0% $421 | +5% $492 | +10% $563 |
| Rate | -1.0pp $489 | -0.5pp $455 | base $421 | +0.5pp $386 | +1.0pp $351 |
UW: 25.0% down · 7.5% · 30yr · 1.5% tax · 5.0% vac · 8.0% maint · 8.0% mgmt
Financing live
Cash to close
- Down payment
- $33,750
- Closing costs
- $4,050
- Reserves months
- —
- Total cash needed
- —
Loan-product check · same deal, 3 products live
Conventional
25% down · 7.5% · 30yr
- Down + closing
- —
- Monthly P&I
- —
- Monthly cashflow
- —
- DSCR
- —
- Eligible?
- —
Personal DTI + credit; lowest rate.
DSCR
20% down · 8.5% · 30yr
- Down + closing
- —
- Monthly P&I
- —
- Monthly cashflow
- —
- DSCR
- —
- Eligible?
- —
No personal income docs; deal must DSCR.
Hard money
10% down · 12.0% · 12mo
- Down + closing
- —
- Monthly P&I
- —
- Monthly cashflow
- —
- DSCR
- —
- Eligible?
- —
Short-term bridge; refi at stabilization.
Rent comps 40 comps
| Address | Beds | Baths | Sqft | Rent | $/sqft | DOM | Units | Dist |
|---|---|---|---|---|---|---|---|---|
| 2211 North St Portsmouth, VA | 4.0 | 1.5 | 1500 | $2,100 | $1.40 | 17d | 1 | 0.27mi |
| 1611 McDaniel St Unit A Portsmouth, VA | 3.0 | 2.0 | 1500 | $1,950 | $1.30 | 8d | 1 | 0.41mi |
| 821 Mt Vernon Ave Unit A Portsmouth, VA | 2.0 | 1.0 | 1200 | $1,250 | $1.04 | 4d | 1 | 0.56mi |
| 1914 King St Portsmouth, VA | 3.0 | 2.5 | 1332 | $2,200 | $1.65 | 45d | 1 | 0.56mi |
| 647 Mount Vernon Ave Unit B Portsmouth, VA | 2.0 | 1.0 | 900 | $1,650 | $1.83 | 8d | 1 | 0.56mi |
| 148 Owens St Portsmouth, VA | 3.0 | 2.0 | 1500 | $2,350 | $1.57 | 24d | 1 | 0.60mi |
| 416 Maryland Ave Unit A Portsmouth, VA | 3.0 | 2.0 | 1450 | $2,300 | $1.59 | 45d | 1 | 0.61mi |
| 509 Mount Vernon Ave Portsmouth, VA | 3.0 | 1.5 | 1125 | $1,250 | $1.11 | 22d | 1 | 0.63mi |
| 129 Elm Ave Portsmouth, VA | 3.0 | 1.5 | 1160 | $2,600 | $2.24 | 45d | 1 | 0.73mi |
| 259 Broad St Portsmouth, VA | 3.0 | 1.0 | 1200 | $1,475 | $1.23 | 4d | 1 | 0.77mi |
| 259 Broad St Unit 3 Portsmouth, VA | 3.0 | 1.0 | 1200 | $1,550 | $1.29 | 11d | 1 | 0.77mi |
| 1140 London Blvd Portsmouth, VA | 2.0 | 2.0 | 1016 | $1,902 | $1.87 | 4d | 1 | 0.82mi |
| 1447 Talley Cir Portsmouth, VA | 3.0 | 2.5 | 1440 | $2,000 | $1.39 | 24d | 1 | 0.83mi |
| 130 Riverview Ave Unit A Downstairs Portsmouth, VA | 2.0 | 1.0 | 975 | $1,475 | $1.51 | 4d | 1 | 0.84mi |
| 850 Crawford Pkwy Portsmouth, VA | 1.0–2.0 | 1.0–2.0 | 944 | $2,119 | $2.24 | 3d | 6 | 0.91mi |
| 1100 High St Portsmouth, VA | 2.0–3.0 | 1.5–2.0 | 1003 | $1,545 | $1.54 | 4d | 5 | 0.92mi |
| 3310 Glasgow St Portsmouth, VA | 2.0 | 1.0 | 1100 | $1,600 | $1.45 | 4d | 1 | 0.96mi |
| 146 Florida Ave Unit A Portsmouth, VA | 3.0 | 1.0 | 1197 | $1,500 | $1.25 | 4d | 1 | 0.99mi |
| 1416 Richmond Ave Portsmouth, VA | 2.0 | 1.0 | 1024 | $1,150 | $1.12 | 45d | 1 | 1.11mi |
| 303 Effingham St Portsmouth, VA | 1.0–3.0 | 1.0–2.0 | 863 | $1,950 | $2.26 | 17d | 11 | 1.14mi |
| 303 Effingham St Unit S-6E Portsmouth, VA | 2.0 | 1.0 | 879 | $1,360 | $1.55 | 24d | 1 | 1.14mi |
| 303 Effingham St Portsmouth, VA | 2.0 | 1.0 | 872 | $1,385 | $1.59 | 45d | 1 | 1.14mi |
| 303 Effingham St Unit S-2F Portsmouth, VA | 3.0 | 2.0 | 1122 | $1,950 | $1.74 | 24d | 1 | 1.14mi |
| 303 Effingham St Unit N-2K Portsmouth, VA | 2.0 | 1.0 | 872 | $1,375 | $1.58 | 24d | 1 | 1.14mi |
| 622 Effingham St Portsmouth, VA | 2.0–3.0 | 1.5–2.0 | 1027 | $1,797 | $1.75 | 24d | 2 | 1.18mi |
| 714 King St Portsmouth, VA | 2.0 | 2.0 | 935 | $1,899 | $2.03 | 45d | 1 | 1.20mi |
| 124 Tyler Cres E Unit B Portsmouth, VA | 2.0 | 1.0 | 1000 | $1,195 | $1.20 | 24d | 1 | 1.29mi |
| 1029 Green St Portsmouth, VA | 2.0 | 1.5 | 802 | $1,199 | $1.50 | 18d | 1 | 1.30mi |
| 1440 Lasalle Ave Portsmouth, VA | 4.0 | 2.0 | 1493 | $2,500 | $1.67 | 24d | 1 | 1.31mi |
| 1915 Des Moines Ave Portsmouth, VA | 3.0 | 1.0 | 1070 | $1,700 | $1.59 | 24d | 1 | 1.33mi |
| 1915 Des Moines Ave Portsmouth, VA | 3.0 | 1.0 | 1070 | $1,700 | $1.59 | 17d | 1 | 1.33mi |
| 1003 Green St Unit 1003 Portsmouth, VA | 2.0 | 1.5 | 837 | $1,195 | $1.43 | 24d | 1 | 1.33mi |
| 1802 Atlanta Ave Unit 2 Portsmouth, VA | 2.0 | 1.0 | 1200 | $1,500 | $1.25 | 24d | 1 | 1.33mi |
| 1915 Lansing Ave Portsmouth, VA | 3.0 | 1.0 | 1085 | $1,675 | $1.54 | 4d | 1 | 1.35mi |
| 915 Green St Portsmouth, VA | 2.0 | 1.0 | 837 | $1,195 | $1.43 | 45d | 1 | 1.37mi |
| 412 North St Portsmouth, VA | 2.0 | 1.0 | 850 | $1,415 | $1.66 | 24d | 2 | 1.37mi |
| 3607 Bart St Portsmouth, VA | 3.0 | 2.0 | 1326 | $1,850 | $1.40 | 11d | 1 | 1.39mi |
| 3626 Bart St Unit BAR3626-DF Portsmouth, VA | 2.0 | 1.0 | 900 | $1,000 | $1.11 | 8d | 1 | 1.40mi |
| 533 Columbia St Portsmouth, VA | 2.0 | 2.0 | 1110 | $1,495 | $1.35 | 45d | 1 | 1.41mi |
| 605 Dinwiddie St Unit B Portsmouth, VA | 2.0 | 1.0 | 900 | $1,650 | $1.83 | 45d | 1 | 1.43mi |
Listing history 3 events
-
2026-03-16status Under Contract
-
2026-03-12$135,000 Active
-
2014-01-28soldstatus $140,000
ⓘ Source: listings_history table (triggers on properties + properties_extension) + one-shot
backfill from property_details.listing_events for pre-trigger history.
Tax reassessment forecast VA · Resets to sale price
- Current annual tax
- $2,848 · $237/mo
- Projected year-2 tax
- $2,848 · $237/mo
- Expected delta
- $0/yr ($0/mo · 0.0%)
ⓘ Screening estimate from a state-policy table — verify with the county assessor before closing.
Climate risk First Street
- Flood 6/10 Major FEMA zone X (shaded) · 57% chance over 30 yrs
- Wildfire 1/10 Low
- Heat 9/10 Extreme 7 d/yr ≥106°F today · 15 d/yr by 30 yrs out
- Wind 8/10 Severe 80% chance of damaging wind over 30 yrs
- Air quality 5/10 Major 6 unhealthy d/yr today · 7 by 30 yrs out
Nearby sold comps map
Loading sold comps map…
Walkable amenities ~0.75 mi
Loading nearby amenities…
Taxation est. · year 1
- Rental income
- $21,610
- − Mortgage interest
- −$7,562
- − Property taxes
- −$2,848
- − Insurance
- −$675
- − Repairs & maintenance
- −$1,729
- − Management
- −$1,729
- − Depreciation
- −$3,927
- Taxable income
- $3,140
- Est. tax owed @ 24.0%
- −$754
- After-tax cash flow
- $4,300/yr
For passive investors: Depreciation is non-cash, so a rental often shows a tax loss while cash-flowing — sheltering income. Rental losses are passive: they offset passive income freely, and up to $25,000/yr can offset ordinary (W-2) income if you actively participate and your MAGI is under $100k (phasing out to $0 by $150k); unused losses carry forward. On sale, claimed depreciation is recaptured at up to 25%, and gains may owe capital-gains tax (a 1031 exchange can defer both). Figures are a year-1 estimate at your 24.0% rate — not tax advice; consult a CPA.
Schools (NCES district)
- District
- Portsmouth City Public School District
- NCES district ID
- 5103000
- Math proficiency
- 34% ▼ -40.00%
- Reading proficiency
- 58% ▼ -12.00%
- Median HH income
- $46,152
- Composite
- 39.01/100
- National rank
- #4071
- State rank
- #107 of 131 in VA
Livability — Portsmouth
- Score
- 73/100
- State rank
- #172
- US rank
- #5381
Category grades
Schools grade is shown separately in the Schools card above.
Census & demographics
- Census place
- Portsmouth, VA
- County
- Portsmouth City · 96,366 people
- City population
- 96,366
- Metro
- Virginia Beach-Norfolk-Newport News, VA-NC
- Population (ZIP)
- 19,207
- Household income
- $49,583
- Rent vs Own
- Severe rent burden
- 1727.0
Population outlook (Portsmouth County) Hauer SSP2
- Today (2025)
- 96,730 people
- By 2030
- 96,760 · +0.0%
- By 2040
- 96,573 · -0.2%
- By 2050
- 95,606 · -1.2%
- By 2075
- 93,579 · -3.3%
- By 2100
- 83,756 · -13.4%
Race, ethnicity, and origin ACS 2023
- Neighborhood character
- Predominantly Black (66%)
- Race & ethnicity
- Black 66% White 24% Two or more races 6% Hispanic / Latino 4% Asian 2%
- Common ancestry
- Slovak 1% Romanian 1% Lithuanian 1%
- Foreign-born
- 2% · Canada
- Languages at home
- 96% English-only · Spanish 2%
Political lean MEDSL · Portsmouth
- 2024 margin
- Solid D (+38.6) · D 68.6% · R 30.0% · Other 1.4%
- 2008→2024 swing
- -0.7pp no change · 2008: 39.3pp · 2024: 38.6pp
- All cycles
- 2024: D+38.6 2020: D+40.8 2016: D+36.5 2012: D+39.6 2008: D+39.3
Not yet ingested
- Civics
- —
Market trends
- HPI YoY
- ▼ -15.69%
- Current HPI
- 322.7335
- Rent YoY
- ▲ 3.31%
- Metro
- Virginia Beach-Norfolk-Newport News, VA-NC
- State GDP YoY
- ▲ 2.40%
- F500 in state
- 50
Industry mix (Fortune 500 HQ in VA)
| Industry | F500 HQs | Revenue |
|---|---|---|
| Aerospace / Defense | 4 | $236B |
|
||
| Technology / Defense | 3 | $32B |
|
||
| Financial Services | 2 | $176B |
|
||
| Utilities | 2 | $27B |
|
||
| Insurance | 2 | $25B |
|
||
| Technology | 2 | $15B |
|
||
Price history
-3.6% since first listed3 events — show timeline
- 2026-03-16 Pending — REINMLS
- 2026-03-12 Listed $135,000 REINMLS
- 2014-01-28 Sold (Public Records) $140,000 Public Records
Property tax history
+2.4%/yrLatest (2025): $2,848 · +4.2% YoY. Source: county tax records.
Cash-flow waterfall
monthlySold comps — $/sqft
last 12 mo · ≤1 miLoading sold comps…