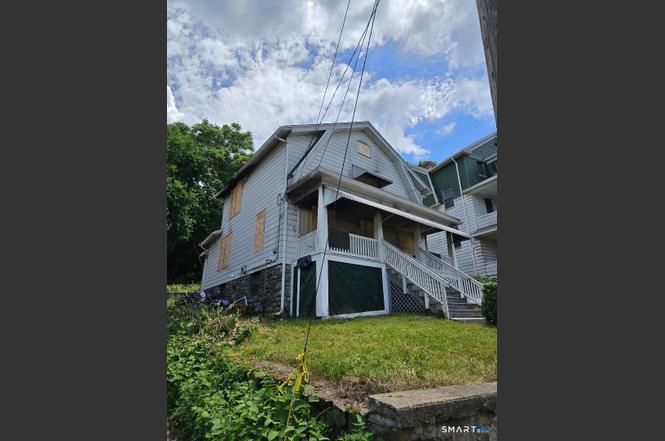
149 Sylvan Ave · Waterbury, CT
Flood risk 1/10 · Minimal
- FEMA flood zone
- X (unshaded)
- Chance of flooding over 30 yrs
- 0.0%
- Est. flood insurance / yr
- $473 – $860
Fire risk 1/10 · Minimal
- Est. fire insurance / yr
- $829 – $1,539
Heat risk 5/10 · Moderate
- Hot days now (above 96°F)
- 7 days/yr
- Hot days in 30 yrs
- 15 days/yr
Wind risk 6/10 · Moderate
- Chance of severe wind over 30 yrs
- 27.0%
Air-quality risk 3/10 · Minor
- Unhealthy air days now
- 2 days/yr
- Unhealthy air days in 30 yrs
- 3 days/yr
Risk factors via First Street. Map © Google.
Why this score? — see what drove the B grade
The composite is a weighted blend of 9 inputs, each scored 0–100. Each bar is that input's sub-score; the figure is the points it added to the 100-point composite (weight × sub-score).
- Cash flow +30.0/30.0
- 1% rule +10.0/10.0
- DSCR +10.0/10.0
- ARV discount +7.5/15.0
- Appreciation +5.7/10.0
- Livability +4.0/5.0
- Rent growth +2.5/5.0
- Condition / age +2.5/5.0
- Schools +1.5/10.0
$50,000
🖨 Deal sheet 📄 Offer letter ✓ Due diligence
Listing remarks MLS
A must see! Home offers a spacious eat in kitchen with plenty of room for dinner gatherings and a good size pantry. 3 BR on the upper level along with a bedroom or office on main floor. Dining room living room combination. Plenty of closet space. Washer and dryer on main level of home. Enjoy the cool fall nights on the lovely covered front porch. The home offers a Newer roof & furnace. The furnace needs repair due to damaged pipes. Home could use some TLC and is priced accordingly with the needed repairs. Home inspections are welcome however, the property is being sold in as is condition. Conveniently located & close to Washington Park, schools,& mall. Located close to the bus line and Rt 69 and 84. May fall within 203K rehab loan guidelines
Key facts
- 4,356 sq ft lot
- Built 1930
- Listed 2 days
Property features AI
Finance
- Financial info: Assessed value listed (public record)
Exterior
- Utilities: Public water connected; Public sewer connected; Natural gas hot water with 30-gallon tank
- Home design: Single-family home
- Construction: Frame construction; Stone foundation; Built prior to or around public-record living area of 1484 sq ft
- Exterior features: Level lot; Vinyl siding; Shingle roof
Interior
- Bedrooms: 3 bedrooms
- Bathrooms: 1 full bathroom
- Heating & cooling: Baseboard hot water heat; Natural gas heating
- Interior features: Full unfinished basement; Has attic with access via hatch; 5 total rooms
Neighborhood map
What this means for you Summary
Snapshot
- This is a 3-bed/1.0-bath single-family listed at $50k.
Deal economics
- At list price, monthly cash flow is $1k ($13k/yr) — positive.
- The deal already cash-flows at list — no discount required.
- Meets the 1% rule at list price ($2k rent vs $50k).
- Cap rate 32.1% vs local median 3.6% in Waterbury — top-decile yield for the area; either an underpriced asset or a hidden risk that comps aren't pricing in. Stress-test before assuming the spread holds.
Location & tenants
- Location reads 79/100 on livability (#32 in CT, #2,205 nationally) — a middle-class / working-renter tenant base. Strengths: commute A+, cost of living A+, housing A+; Watch: schools D+, crime D, employment D.
- Waterbury School District (suburban): math 12% / reading 23% proficiency, ranked #148 of 153 in CT (top 97%) — low school quality limits family demand, transient renter base, plan for 1-2y turnover; 73% free/reduced lunch — lower-income household profile, screen leases tightly.
- Market conditions: 42 active listings in the ZIP; 40 comparable units currently listed for rent nearby; rentals lingering (median 44d on market — plan ~5-8 weeks vacancy on turnover, expect pricing pressure); 60% of comp listings sitting > 30 days — soft ceiling on asking rent; 502 units permitted in Naugatuck Valley Planning Region in 2024 (171 in 5+ unit buildings).
- This rent runs 41% of the median local income ($52k/yr) — at the standard rent-burdened threshold; future hikes will face affordability resistance.
Forward outlook
- In year one you build about $1k of equity ($346 loan paydown + $697 appreciation (1.4% local appreciation)).
- At projected returns (1.4% appreciation + 3.0% rent growth), your $14k cash investment doubles in ~2 years — after that, you're playing with house money.
Negotiation context
- Only 2 days on market — expect competitive offers; lowballing is unlikely to land.
- 2 sale attempts since 11y ago with the ask held roughly flat each time — persistent listings suggest the price (not the market) is what's stuck; bring a comps-based counter.
- Current owner paid $30k; list at $50k implies a 67% gain — meaningful room to come down on a strong offer.
Risks & watch-outs
- Watch-outs: built in 1930 — expect roof / HVAC / electrical / plumbing capex.
- Climate carrying-cost: major wind risk, 27% chance of damaging wind over 30y; extreme-heat days projected 7→15/yr by 2055 (HVAC capex compounding) — expect insurance premiums to compound above CPI over the hold.
Questions for the listing agent
- Built in 1930 — when were the roof, HVAC, electrical panel, plumbing, and water heater last replaced?
- Is there a deadline driving the sale (1031 exchange, divorce, estate, relocation)? That informs how much negotiation room exists.
- Schools are D-rated, which usually means shorter tenancies and higher turnover. Who's the typical renter profile here, and what's been the actual vacancy rate?
- Crime grade is D in this area — have there been break-ins, vandalism, or insurance claims at this property in the last 3 years? What carrier currently insures it and at what premium?
- What's the average days-on-market for RENTAL listings here right now (not sales)? A rising rental-DOM trend means longer vacancies and softer asking-rent achievability than the comps imply.
- What's the recent tenant-quality profile in this submarket — average credit score on applications, eviction rate, late-payment / NSF rate, and stable-employment percentage? A property-management company in the area should have these aggregated.
- How much new for-sale + rental construction is in the pipeline within 1–3 miles? Heavy new supply typically softens prices + rents 12–24 months out; constrained supply supports both.
Investment metrics
- 1% rule
- 3.60% ✓
- Cap rate
- 32.14%
- Cash-on-cash
- 92.31%
- DSCR
- 5.11
- GRM
- 2.3
CMA / ARV
- ARV (on-the-fly)
- $310,156
- Comps found
- 12
Show comp detail 12 sales within ~0.75 mi
| Address | Dist | Beds/Ba | Sqft | Sold | Price | $/sf | Match |
|---|---|---|---|---|---|---|---|
| 32 Donahue St | 0.10mi | 4/2.0 (+1) | 1,496 (+1%) | 21mo | $335,000 | $224 | 68 |
| 33 W View St | 0.34mi | 3/1.5 | 1,308 (-12%) | 2mo | $275,000 | $210 | 61 |
| 427 Sylvan Ave | 0.48mi | 4/2.0 (+1) | 1,533 (+3%) | 9mo | $230,000 | $150 | 55 |
| 140 Edgewood Ave | 0.62mi | 3/2.0 | 1,414 (-5%) | 5mo | $229,900 | $163 | 55 |
| 13 Keefe St | 0.17mi | 3/1.5 | 1,296 (-13%) | 17mo | $250,000 | $193 | 55 |
| 30 Whittlesey Ave | 0.46mi | 3/2.0 | 1,397 (-6%) | 12mo | $325,000 | $233 | 55 |
| 470 Sylvan Ave | 0.57mi | 3/1.5 | 1,669 (+12%) | 2mo | $355,000 | $213 | 49 |
| 21 Whittlesey Ave | 0.45mi | 3/2.0 | 1,670 (+12%) | 7mo | $349,500 | $209 | 48 |
| 42 Madison Ave | 0.48mi | 3/1.5 | 1,630 (+10%) | 17mo | $270,000 | $166 | 45 |
| 273 Piedmont St | 0.67mi | 4/1.0 (+1) | 1,348 (-9%) | 8mo | $310,000 | $230 | 42 |
| 1635 S Main St | 0.73mi | 4/1.5 (+1) | 1,646 (+11%) | 13mo | $215,000 | $131 | 30 |
| 70 Niagara St | 0.74mi | 3/1.5 | 1,290 (-13%) | 19mo | $245,000 | $190 | 25 |
Match score weights: distance 35% · size 25% · config 20% · recency 20%. Top-matched comps best support the ARV.
Projected returns pro-forma
1.39% appreciation · 3.0% rent growth · sell at horizon
- IRR
- 95.6%
- Equity multiple
- 6.04×
- Total profit
- $70,526
- Equity at exit
- $18,102
- IRR
- 96.1%
- Equity multiple
- 12.46×
- Total profit
- $160,452
- Equity at exit
- $24,875
Cash invested: $14,000 (down + closing). Projections, not guarantees.
Landlord ↔ Tenant lean methodology
- Overall (STATE)
- 27 Tenant-Leaning
- State Connecticut
- 27 Tenant-Leaning · D+7
- County
- — inherits STATE
- City
- — inherits STATE
ZIP-level market 06706
- Home prices YoY
- 0.5%
- Active inventory
- 42
- Price-to-rent
- 2.3×
Monthly cashflow live
- Estimated rent
- $1,801 high interval (Pro) →
- Mortgage (P&I)
- −$262
- Tax est. 1.5%
- −$62 /mo · $750/yr
- Insurance
- −$21
- HOA
- −$0
- Vacancy / Maint / Mgmt
- −$378
- Net cashflow
- $1,077
Break-even live
UW: 25.0% down · 7.5% · 30yr · 1.5% tax · 5.0% vac · 8.0% maint · 8.0% mgmt
Financing live
Cash to close
- Down payment
- $12,500
- Closing costs
- $1,500
- Reserves months
- —
- Total cash needed
- —
Loan-product check · same deal, 3 products live
Conventional
25% down · 7.5% · 30yr
- Down + closing
- —
- Monthly P&I
- —
- Monthly cashflow
- —
- DSCR
- —
- Eligible?
- —
Personal DTI + credit; lowest rate.
DSCR
20% down · 8.5% · 30yr
- Down + closing
- —
- Monthly P&I
- —
- Monthly cashflow
- —
- DSCR
- —
- Eligible?
- —
No personal income docs; deal must DSCR.
Hard money
10% down · 12.0% · 12mo
- Down + closing
- —
- Monthly P&I
- —
- Monthly cashflow
- —
- DSCR
- —
- Eligible?
- —
Short-term bridge; refi at stabilization.
Rent comps 40 comps
| Address | Beds | Baths | Sqft | Rent | $/sqft | DOM | Units | Dist |
|---|---|---|---|---|---|---|---|---|
| 429 Baldwin St Unit 2 Waterbury, CT | 3.0 | 1.0 | 900 | $1,600 | $1.78 | 3d | 1 | 0.32mi |
| 423 Baldwin St Unit 2 Waterbury, CT | 3.0 | 1.0 | 900 | $1,600 | $1.78 | 3d | 1 | 0.32mi |
| 113 Southview St Waterbury, CT | 2.0 | 1.0 | 1860 | $1,250 | $0.67 | 23d | 1 | 0.36mi |
| 29 Madison St Unit 2 Waterbury, CT | 4.0 | 1.0 | 1010 | $1,900 | $1.88 | 44d | 1 | 0.37mi |
| 1120 Baldwin St Waterbury, CT | 3.0 | 1.0 | 1100 | $1,750 | $1.59 | 44d | 1 | 0.44mi |
| 59 Baldwin Ave Waterbury, CT | 3.0 | 1.0 | 1200 | $2,350 | $1.96 | 44d | 1 | 0.45mi |
| 691 S Main St Unit 3RD Waterbury, CT | 3.0 | 1.0 | 1000 | $1,600 | $1.60 | 44d | 1 | 0.47mi |
| 909 Hamilton Ave #6 Waterbury, CT | 2.0 | 1.5 | 896 | $1,600 | $1.79 | 19d | 1 | 0.67mi |
| 779 E Main St Unit 2nd floor Waterbury, CT | 3.0 | 1.0 | 1149 | $1,400 | $1.22 | 23d | 1 | 0.73mi |
| 124 Charles St Unit 2 Waterbury, CT | 2.0 | 1.0 | 1012 | $1,800 | $1.78 | 44d | 1 | 0.80mi |
| 1720 E Main St Unit 1st Floor Waterbury, CT | 2.0 | 1.0 | 1026 | $1,250 | $1.22 | 44d | 1 | 0.86mi |
| 1720 E Main St Unit 2nd Floor Waterbury, CT | 2.0 | 1.0 | 1026 | $1,350 | $1.32 | 44d | 1 | 0.86mi |
| 100 Meriden Rd Unit A Waterbury, CT | 2.0 | 1.0 | 1044 | $1,850 | $1.77 | 14d | 1 | 0.88mi |
| 25 Laurel St #1 Waterbury, CT | 4.0 | 1.0 | 1100 | $2,000 | $1.82 | 44d | 1 | 0.88mi |
| 77 Wall St Waterbury, CT | 3.0 | 1.0 | 1000 | $1,900 | $1.90 | 11d | 1 | 0.89mi |
| 59 Green St Waterbury, CT | 3.0 | 1.0 | 900 | $1,650 | $1.83 | 44d | 1 | 0.90mi |
| 214 Oak St Unit 3 Waterbury, CT | 3.0 | 1.0 | 1220 | $1,700 | $1.39 | 11d | 1 | 0.92mi |
| 30 Walnut Ave Unit 2 Waterbury, CT | 3.0 | 1.0 | 1200 | $1,600 | $1.33 | 44d | 1 | 0.93mi |
| 468 Congress Ave Unit third floor Waterbury, CT | 3.0 | 1.0 | 1250 | $1,500 | $1.20 | 23d | 1 | 0.95mi |
| 241 Congress Ave Unit 1st Floor Waterbury, CT | 2.0 | 1.0 | 909 | $1,300 | $1.43 | 44d | 1 | 0.98mi |
| 127 Congress Ave Unit 1 Waterbury, CT | 3.0 | 1.0 | 1200 | $2,300 | $1.92 | 44d | 1 | 0.99mi |
| 29 Bouley Ave Waterbury, CT | 4.0 | 1.0 | 1267 | $3,000 | $2.37 | 44d | 1 | 1.00mi |
| 63 Bank St Unit 3A Waterbury, CT | 2.0 | 1.0 | 903 | $1,700 | $1.88 | 14d | 1 | 1.00mi |
| 143 Congress Ave Unit 2 Waterbury, CT | 4.0 | 1.0 | 1050 | $1,800 | $1.71 | 44d | 1 | 1.00mi |
| 75 Alma St Waterbury, CT | 3.0 | 1.0 | 1143 | $1,850 | $1.62 | 44d | 1 | 1.02mi |
| 46 Webb St Unit 3 Waterbury, CT | 4.0 | 1.0 | 1200 | $2,000 | $1.67 | 44d | 1 | 1.03mi |
| 124 Geddes Ter Waterbury, CT | 3.0 | 2.0 | 1255 | $2,300 | $1.83 | 44d | 1 | 1.04mi |
| 124 Geddes Ter Unit Left Waterbury, CT | 3.0 | 1.5 | 1255 | $2,300 | $1.83 | 44d | 1 | 1.05mi |
| 140 Orange St Waterbury, CT | 2.0 | 1.0 | 1678 | $1,500 | $0.89 | 44d | 1 | 1.05mi |
| 67 Avon Ave Unit 2 Waterbury, CT | 2.0 | 1.0 | 887 | $1,700 | $1.92 | 23d | 1 | 1.06mi |
| 64 Dikeman St Unit 2nd Floor Waterbury, CT | 3.0 | 1.0 | 1000 | $2,200 | $2.20 | 21d | 1 | 1.08mi |
| 95 Hawthorne Ave Unit 2 Waterbury, CT | 3.0 | 1.0 | 1300 | $1,800 | $1.38 | 23d | 1 | 1.12mi |
| 85 Draher St Unit 1 Waterbury, CT | 2.0 | 1.0 | 1200 | $1,600 | $1.33 | 44d | 1 | 1.12mi |
| 91 Taft St Unit 11 Waterbury, CT | 2.0 | 1.5 | 1320 | $2,600 | $1.97 | 44d | 1 | 1.16mi |
| 76 Oak St Waterbury, CT | 2.0 | 1.0 | 900 | $1,249 | $1.39 | 44d | 1 | 1.16mi |
| 44 Taft St Unit 9 Waterbury, CT | 2.0 | 1.5 | 1200 | $2,100 | $1.75 | 44d | 1 | 1.17mi |
| 52 Oak St Waterbury, CT | 3.0 | 1.5 | 1024 | $1,800 | $1.76 | 3d | 1 | 1.20mi |
| 88 Farrell Rd Waterbury, CT | 2.0 | 1.0 | 1568 | $1,700 | $1.08 | 23d | 1 | 1.20mi |
| 124 Spring Lake Rd Waterbury, CT | 3.0 | 1.5 | 1298 | $2,200 | $1.69 | 3d | 1 | 1.22mi |
| 48 Irion St Apt 3 Waterbury, CT | 2.0 | 1.0 | 1000 | $1,399 | $1.40 | 44d | 1 | 1.22mi |
Listing history 4 events
-
2026-06-18days on market $50,000 Active 2 DOM
-
2026-06-17remarks 206-char remark
-
2026-06-16remarks 83-char remark
-
2026-06-16$50,000 Active 1 DOM
ⓘ Source: listings_history table (triggers on properties + properties_extension) + one-shot
backfill from property_details.listing_events for pre-trigger history.
Climate risk First Street
- Flood 1/10 Low FEMA zone X (unshaded) · 0% chance over 30 yrs
- Wildfire 1/10 Low
- Heat 5/10 Major 7 d/yr ≥96°F today · 15 d/yr by 30 yrs out
- Wind 6/10 Major 27% chance of damaging wind over 30 yrs
- Air quality 3/10 Moderate 2 unhealthy d/yr today · 3 by 30 yrs out
Nearby sold comps map
Loading sold comps map…
Walkable amenities ~0.75 mi
Loading nearby amenities…
Taxation est. · year 1
- Rental income
- $21,608
- − Mortgage interest
- −$2,801
- − Property taxes
- −$750
- − Insurance
- −$250
- − Repairs & maintenance
- −$1,729
- − Management
- −$1,729
- − Depreciation
- −$1,455
- Taxable income
- $12,895
- Est. tax owed @ 24.0%
- −$3,095
- After-tax cash flow
- $9,829/yr
For passive investors: Depreciation is non-cash, so a rental often shows a tax loss while cash-flowing — sheltering income. Rental losses are passive: they offset passive income freely, and up to $25,000/yr can offset ordinary (W-2) income if you actively participate and your MAGI is under $100k (phasing out to $0 by $150k); unused losses carry forward. On sale, claimed depreciation is recaptured at up to 25%, and gains may owe capital-gains tax (a 1031 exchange can defer both). Figures are a year-1 estimate at your 24.0% rate — not tax advice; consult a CPA.
Schools (NCES district)
- District
- Waterbury School District
- NCES district ID
- 0904830
- Math proficiency
- 12% ▼ -7.00%
- Reading proficiency
- 23% ▼ -8.00%
- Median HH income
- $40,040
- Composite
- 14.85/100
- National rank
- #9380
- State rank
- #148 of 153 in CT
Livability — Waterbury
- Score
- 79/100
- State rank
- #32
- US rank
- #2205
Category grades
Schools grade is shown separately in the Schools card above.
Census & demographics
- Census place
- Waterbury, CT
- County
- New Haven County · 688,236 people
- City population
- 115,012
- Metro
- New Haven-Milford, CT
- Population (ZIP)
- 15,551
- Household income
- $52,242
- Rent vs Own
- Severe rent burden
- 801.0
Population outlook (Naugatuck Valley County) Hauer SSP2
- By 2040
- 496,846
Race, ethnicity, and origin ACS 2023
- Neighborhood character
- Highly diverse neighborhood (Simpson 0.72)
- Race & ethnicity
- Hispanic / Latino 35% White 31% Black 25% Two or more races 12% Asian 3%
- Hispanic origin (detail)
- Puerto Rican 25% Dominican 4%
- Common ancestry
- Lithuanian 3% Estonian 2% Romanian 1%
- Foreign-born
- 20% · Canada, Jamaica
- Languages at home
- 60% English-only · Spanish 27% Other Indo-European 11% Other Asian/Pacific 1%
Political lean MEDSL · Naugatuck Valley
- 2024 margin
- Lean R (+7.4) · D 45.6% · R 53.0% · Other 1.4%
- All cycles
- 2024: R+7.4
Not yet ingested
- Civics
- —
Market trends
- HPI YoY
- ▲ 1.39%
- Current HPI
- 309.8467
- Rent YoY
- —
- Metro
- New Haven-Milford, CT
- State GDP YoY
- ▲ 1.06%
- F500 in state
- 38
Industry mix (Fortune 500 HQ in CT)
| Industry | F500 HQs | Revenue |
|---|---|---|
| Industrial Machinery | 4 | $38B |
|
||
| Insurance | 3 | $71B |
|
||
| Financial Services | 2 | $25B |
|
||
| Transportation / Logistics | 2 | $18B |
|
||
| Healthcare | 1 | $247B |
|
||
| Telecommunications | 1 | $55B |
|
||
Price history
+11.1% since first listed4 events — show timeline
- 2026-06-15 Listed $50,000 Smart MLS
- 2016-01-14 Sold (MLS) $30,000 Smart MLS
- 2015-12-21 Listing Removed — Smart MLS
- 2015-09-08 Listed $45,000 Smart MLS
Property tax history
+4.4%/yrLatest (2023): $5,686 · +53.1% YoY. Source: county tax records.
Cash-flow waterfall
monthlySold comps — $/sqft
last 12 mo · ≤1 miLoading sold comps…