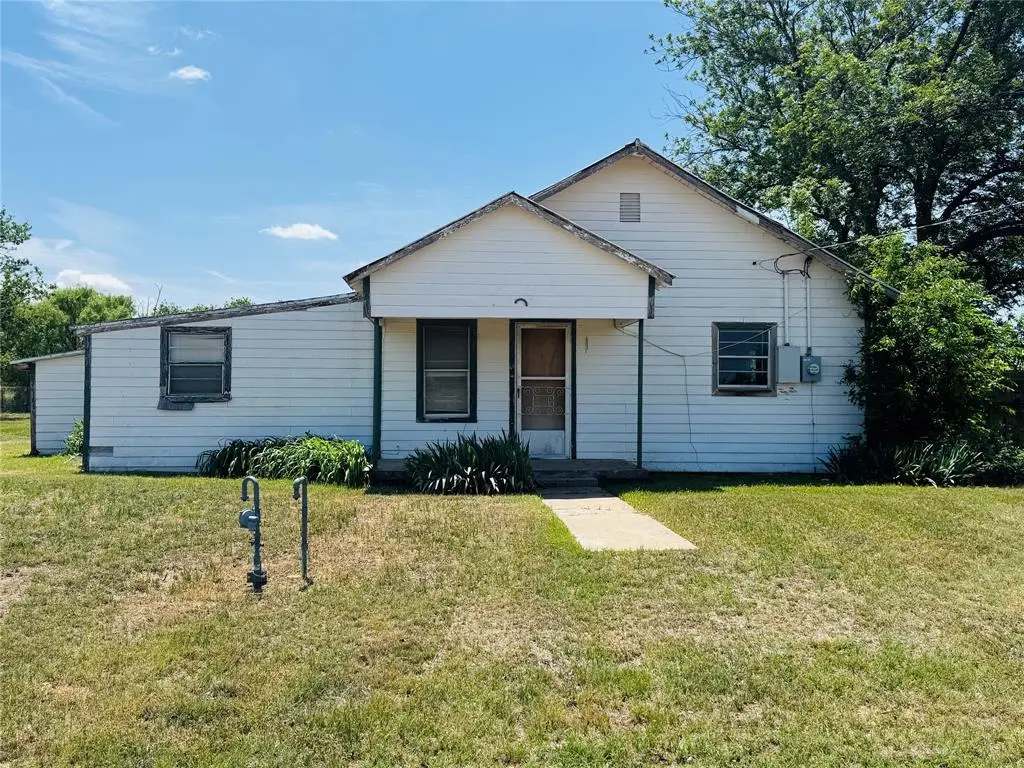
300 S 3rd St E · Haskell, TX
Flood risk 1/10 · Minimal
- FEMA flood zone
- —
- Chance of flooding over 30 yrs
- 0.0%
- Est. flood insurance / yr
- —
Fire risk 4/10 · Minor
- Est. fire insurance / yr
- $1,222 – $2,270
Heat risk 7/10 · Major
- Hot days now (above 107°F)
- 7 days/yr
- Hot days in 30 yrs
- 20 days/yr
Wind risk 4/10 · Minor
- Chance of severe wind over 30 yrs
- 10.0%
Air-quality risk 1/10 · Minimal
- Unhealthy air days now
- 0 days/yr
- Unhealthy air days in 30 yrs
- 0 days/yr
Risk factors via First Street. Map © Google.
Why this score? — see what drove the B+ grade
The composite is a weighted blend of 9 inputs, each scored 0–100. Each bar is that input's sub-score; the figure is the points it added to the 100-point composite (weight × sub-score).
- Cash flow +30.0/30.0
- 1% rule +10.0/10.0
- DSCR +10.0/10.0
- ARV discount +7.5/15.0
- Appreciation +6.5/10.0
- Livability +3.4/5.0
- Schools +2.8/10.0
- Rent growth +2.5/5.0
- Condition / age +2.5/5.0
$27,900
🖨 Deal sheet (PDF) 📄 Offer letter ✓ Due diligence
Listing remarks MLS
This charming 2 bedroom, one bathroom home is just right if you are looking for something on the smaller side. This property offers peace with its spacious lot. Don't miss out on this affordable and rare find! Contact Bridget today to schedule a showing (940)-256-2360.
Key facts
- Spacious backyard
- Full renovation
- Oversized lot
Tags
Property features AI
Finance
- Other: Listing is active and offered under an exclusive right to sell agreement; Possession at closing/funding
- Financial info: Listing terms: Cash; Loan type: Treat as clear; No second mortgage indicated
- HOA & community: No association
Exterior
- Parking: Covered parking; Carport with 1 space; Garage faces side (garage listed but shows 0 garage spaces)
- Utilities: City water; City sewer; Property in a municipal utility district
- Home design: Single-family residence; One story; Not attached to another property; Built in 1920
- Construction: Siding exterior; Pillar/post/pier foundation
- Exterior features: Lot under 0.5 acre (approximately 0.321 acre); Property located in Stephens Add subdivision; Driving directions provided: Driving East on HWY 30, turn south onto Jim Strain Rd and turn East onto S 3rd Street; property on right
Interior
- Kitchen: No appliances listed
- Bedrooms: Primary bedroom on main level; Total of 2 bedrooms
- Bathrooms: 1 full bathroom
- Heating & cooling: Window unit(s) for cooling; Other heating type
- Interior features: Cable TV available; High-speed internet available; One living area; One dining area; Two total rooms
- Laundry & utility: No laundry appliances listed
Neighborhood map
What this means for you Summary
Snapshot
- This is a 2-bed/1.0-bath single-family listed at $28k.
Deal economics
- At list price, monthly cash flow is $432 ($5k/yr) — positive.
- The deal already cash-flows at list — no discount required.
- Meets the 1% rule at list price ($860 rent vs $28k).
- Recommended offer: $27k (1.5% below list) — sets the bar for market timing.
Location & tenants
- Location reads 67/100 on livability (#573 in TX) — a middle-class / working-renter tenant base. Strengths: crime A+, cost of living A+, housing A+; Watch: health & safety C-, amenities F, commute F.
- Haskell CISD (town): math 31% / reading 36% proficiency, ranked #561 of 826 in TX (top 68%) — families likely to look elsewhere, expect single-tenant / working-renter base with shorter leases; 63% free/reduced lunch — lower-income household profile, screen leases tightly.
- Zoned schools: Haskell El (math 27% / reading 37%, grade F, #2,268 of 4,322 statewide, top 55%, 267 students, 68% FRL); Haskell J H (math 27% / reading 32%, grade F, #1,077 of 1,662 statewide, top 66%, 124 students, 71% FRL); Haskell H S (math 54% / reading 44%, grade D, #509 of 1,632 statewide, top 34%, 148 students, 60% FRL) — zoned schools at 66% FRL track the district average.
- Market conditions: 44 active listings in the ZIP.
Forward outlook
- In year one you build about $1k of equity ($193 loan paydown + $863 appreciation (3.1% local appreciation)).
- Haskell County population projected at +6% by 2050 — modest demand growth; plan on rents tracking national, not racing it.
- At projected returns (3.1% appreciation + 3.0% rent growth), your $8k cash investment doubles in ~2 years — after that, you're playing with house money.
Negotiation context
- It's been on market 18 days — a 2% lower offer ($27k) is reasonable based on typical stale-listing flexibility.
- 3 sale attempts since 6y ago with the ask held roughly flat each time — persistent listings suggest the price (not the market) is what's stuck; bring a comps-based counter.
Risks & watch-outs
- Watch-outs: property tax is 3.9% of price; built in 1920 — expect roof / HVAC / electrical / plumbing capex.
- Climate carrying-cost: extreme-heat days projected 7→20/yr by 2055 (HVAC capex compounding) — expect insurance premiums to compound above CPI over the hold.
Questions for the listing agent
- Built in 1920 — when were the roof, HVAC, electrical panel, plumbing, and water heater last replaced?
- Property tax is high relative to price — has the assessment been appealed recently, and will the sale trigger a re-assessment?
- Is there a deadline driving the sale (1031 exchange, divorce, estate, relocation)? That informs how much negotiation room exists.
- Schools are D-rated, which usually means shorter tenancies and higher turnover. Who's the typical renter profile here, and what's been the actual vacancy rate?
- What's the average days-on-market for RENTAL listings here right now (not sales)? A rising rental-DOM trend means longer vacancies and softer asking-rent achievability than the comps imply.
- What's the recent tenant-quality profile in this submarket — average credit score on applications, eviction rate, late-payment / NSF rate, and stable-employment percentage? A property-management company in the area should have these aggregated.
- How much new for-sale + rental construction is in the pipeline within 1–3 miles? Heavy new supply typically softens prices + rents 12–24 months out; constrained supply supports both.
Investment metrics
- 1% rule
- 3.08% ✓
- Cap rate
- 24.85%
- Cash-on-cash
- 66.29%
- DSCR
- 3.95
- GRM
- 2.7
CMA / ARV
- ARV (median comp)
- $69,859
- List price
- $27,900
- Delta
- -60.06%
- Verdict
- UNDERPRICED
- Comps
- 20 within 1.0 mi
Show comp detail 2 sales within ~0.75 mi
| Address | Dist | Beds/Ba | Sqft | Sold | Price | $/sf | Match |
|---|---|---|---|---|---|---|---|
| 303 S Avenue C | 0.37mi | 2/1.0 | 816 (-9%) | 6mo | $50,000 | $61 | 62 |
| 205 N Avenue D | 0.58mi | 2/1.0 | 862 (-4%) | 20mo | $30,000 | $35 | 49 |
Match score weights: distance 35% · size 25% · config 20% · recency 20%. Top-matched comps best support the ARV.
Projected returns pro-forma
3.09% appreciation · 3.0% rent growth · sell at horizon
- IRR
- 71.2%
- Equity multiple
- 4.97×
- Total profit
- $31,030
- Equity at exit
- $12,690
- IRR
- 70.6%
- Equity multiple
- 10.20×
- Total profit
- $71,842
- Equity at exit
- $19,671
Cash invested: $7,812 (down + closing). Projections, not guarantees.
Landlord ↔ Tenant lean methodology
- Overall (STATE)
- 87 Strongly Landlord-Friendly
- State Texas
- 87 Strongly Landlord-Friendly · R+5
- County
- — inherits STATE
- City
- — inherits STATE
ZIP-level market 79521
- Home prices YoY
- 2.6%
- Active inventory
- 44
- Price-to-rent
- 2.7×
Monthly cashflow live
- Estimated rent
- $860 medium interval (Pro) →
- Mortgage (P&I)
- −$146
- Tax from tax record
- −$90 /mo · $1,075/yr
- Insurance
- −$12
- HOA
- −$0
- Vacancy / Maint / Mgmt
- −$181
- Net cashflow
- $432
Break-even live
Sensitivity live
| Price | -10% $447 | -5% $439 | +0% $432 | +5% $424 | +10% $416 |
|---|---|---|---|---|---|
| Rent | -10% $364 | -5% $398 | +0% $432 | +5% $466 | +10% $499 |
| Rate | -1.0pp $446 | -0.5pp $439 | base $432 | +0.5pp $424 | +1.0pp $417 |
UW: 25.0% down · 7.5% · 30yr · 1.5% tax · 5.0% vac · 8.0% maint · 8.0% mgmt
Financing live
Cash to close
- Down payment
- $6,975
- Closing costs
- $837
- Reserves months
- —
- Total cash needed
- —
Loan-product check · same deal, 3 products live
Conventional
25% down · 7.5% · 30yr
- Down + closing
- —
- Monthly P&I
- —
- Monthly cashflow
- —
- DSCR
- —
- Eligible?
- —
Personal DTI + credit; lowest rate.
DSCR
20% down · 8.5% · 30yr
- Down + closing
- —
- Monthly P&I
- —
- Monthly cashflow
- —
- DSCR
- —
- Eligible?
- —
No personal income docs; deal must DSCR.
Hard money
10% down · 12.0% · 12mo
- Down + closing
- —
- Monthly P&I
- —
- Monthly cashflow
- —
- DSCR
- —
- Eligible?
- —
Short-term bridge; refi at stabilization.
Listing history 9 events
-
2026-05-12status Pending 387-char remark
-
2026-05-04status Active 387-char remark
-
2026-04-27historical Active Option Contract 387-char remark
-
2026-04-24$27,900 Active 387-char remark
-
2020-08-19soldstatus
-
2020-08-18soldstatus Sold 269-char remark
Show marketing remark (269 chars)
This charming 2 bedroom, one bathroom home is just right if you are looking for something on the smaller side. This property offers peace with its spacious lot. Don't miss out on this affordable and rare find! Contact Bridget today to schedule a showing (940)-256-2360.
-
2020-07-07historical Active Option Contract 269-char remark
Show marketing remark (269 chars)
This charming 2 bedroom, one bathroom home is just right if you are looking for something on the smaller side. This property offers peace with its spacious lot. Don't miss out on this affordable and rare find! Contact Bridget today to schedule a showing (940)-256-2360.
-
2020-05-27$24,500 Active 269-char remark
Show marketing remark (269 chars)
This charming 2 bedroom, one bathroom home is just right if you are looking for something on the smaller side. This property offers peace with its spacious lot. Don't miss out on this affordable and rare find! Contact Bridget today to schedule a showing (940)-256-2360.
-
2005-04-13soldstatus
ⓘ Source: listings_history table (triggers on properties + properties_extension) + one-shot
backfill from property_details.listing_events for pre-trigger history.
Tax reassessment forecast TX · Resets to sale price
- Current annual tax
- $1,075 · $90/mo
- Projected year-2 tax
- $1,075 · $90/mo
- Expected delta
- $0/yr ($0/mo · 0.0%)
ⓘ Screening estimate from a state-policy table — verify with the county assessor before closing.
Climate risk First Street
- Flood 1/10 Low 0% chance over 30 yrs
- Wildfire 4/10 Moderate
- Heat 7/10 Severe 7 d/yr ≥107°F today · 20 d/yr by 30 yrs out
- Wind 4/10 Moderate 10% chance of damaging wind over 30 yrs
- Air quality 1/10 Low 0 unhealthy d/yr today · 0 by 30 yrs out
Nearby sold comps map
Loading sold comps map…
Walkable amenities ~0.75 mi
Loading nearby amenities…
Taxation est. · year 1
- Rental income
- $10,314
- − Mortgage interest
- −$1,563
- − Property taxes
- −$1,075
- − Insurance
- −$140
- − Repairs & maintenance
- −$825
- − Management
- −$825
- − Depreciation
- −$812
- Taxable income
- $5,076
- Est. tax owed @ 24.0%
- −$1,218
- After-tax cash flow
- $3,960/yr
For passive investors: Depreciation is non-cash, so a rental often shows a tax loss while cash-flowing — sheltering income. Rental losses are passive: they offset passive income freely, and up to $25,000/yr can offset ordinary (W-2) income if you actively participate and your MAGI is under $100k (phasing out to $0 by $150k); unused losses carry forward. On sale, claimed depreciation is recaptured at up to 25%, and gains may owe capital-gains tax (a 1031 exchange can defer both). Figures are a year-1 estimate at your 24.0% rate — not tax advice; consult a CPA.
Schools (NCES district)
- District
- Haskell CISD
- NCES district ID
- 4822740
- Math proficiency
- 31% ▼ -18.00%
- Reading proficiency
- 36% ▼ -8.00%
- Median HH income
- $41,661
- Composite
- 28.29/100
- National rank
- #6791
- State rank
- #561 of 826 in TX
Livability — Haskell
- Score
- 67/100
- State rank
- #573
- US rank
- #10965
Category grades
Schools grade is shown separately in the Schools card above.
Census & demographics
- Census place
- Haskell, TX
- Population (ZIP)
- 3,470
Population outlook (Haskell County) Hauer SSP2
- Today (2025)
- 5,679 people
- By 2030
- 5,693 · +0.2%
- By 2040
- 5,769 · +1.6%
- By 2050
- 6,012 · +5.9%
- By 2075
- 6,792 · +19.6%
- By 2100
- 6,531 · +15.0%
Race, ethnicity, and origin ACS 2023
- Neighborhood character
- Predominantly White (70%)
- Race & ethnicity
- White 70% Hispanic / Latino 22% Black 7% Two or more races 4%
- Hispanic origin (detail)
- Mexican 18%
- Common ancestry
- Serbian 4% Slovak 3% Lithuanian 2%
- Foreign-born
- 7% · Canada
- Languages at home
- 79% English-only · Spanish 19% Other Indo-European 1%
Political lean MEDSL · Haskell
- 2024 margin
- Solid R (+71.5) · D 13.9% · R 85.4%
- 2008→2024 swing
- -38.9pp toward R · 2008: -32.6pp · 2024: -71.5pp
- All cycles
- 2024: R+71.5 2020: R+67.2 2016: R+61.7 2012: R+43.4 2008: R+32.6
Not yet ingested
- Civics
- —
Market trends
- HPI YoY
- ▲ 3.09%
- Current HPI
- 121.407
- Rent YoY
- —
- Metro
- —
- State GDP YoY
- ▲ 3.95%
- F500 in state
- 110
Industry mix (Fortune 500 HQ in TX)
| Industry | F500 HQs | Revenue |
|---|---|---|
| Energy | 16 | $1,198B |
|
||
| Technology | 5 | $198B |
|
||
| Engineering / Construction | 4 | $72B |
|
||
| Energy Services | 3 | $60B |
|
||
| Utilities | 3 | $41B |
|
||
| Healthcare | 2 | $330B |
|
||
Price history
+13.9% since first listed11 events — show timeline
- 2026-05-26 Sold (Public Records) — Public Records
- 2026-05-26 Sold (MLS) — NTREIS
- 2026-05-12 Pending — NTREIS
- 2026-05-04 Relisted — NTREIS
- 2026-04-27 Contingent — NTREIS
- 2026-04-24 Listed $27,900 NTREIS
- 2020-08-19 Sold (Public Records) — Public Records
- 2020-08-18 Sold (MLS) — NTREIS
- 2020-07-07 Contingent — NTREIS
- 2020-05-27 Listed $24,500 NTREIS
- 2005-04-13 Sold (Public Records) — Public Records
Property tax history
+11.6%/yrLatest (2025): $1,075 · +21.7% YoY. Source: county tax records.
Cash-flow waterfall
monthlySold comps — $/sqft
last 12 mo · ≤1 miLoading sold comps…