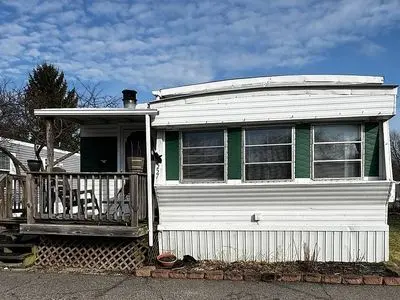
557 Lesperance Dr · Rochester Hills, MI
Flood risk 1/10 · Minimal
- FEMA flood zone
- X (unshaded)
- Chance of flooding over 30 yrs
- 0.0%
- Est. flood insurance / yr
- $507 – $1,088
Fire risk 3/10 · Minor
- Est. fire insurance / yr
- $784 – $1,456
Heat risk 3/10 · Minor
- Hot days now (above 97°F)
- 7 days/yr
- Hot days in 30 yrs
- 16 days/yr
Wind risk 2/10 · Minimal
- Chance of severe wind over 30 yrs
- —
Air-quality risk 3/10 · Minor
- Unhealthy air days now
- 2 days/yr
- Unhealthy air days in 30 yrs
- 4 days/yr
Risk factors via First Street. Map © Google.
Why this score? — see what drove the D+ grade
The composite is a weighted blend of 9 inputs, each scored 0–100. Each bar is that input's sub-score; the figure is the points it added to the 100-point composite (weight × sub-score).
- Cash flow +15.0/30.0
- ARV discount +7.5/15.0
- Schools +5.9/10.0
- 1% rule +5.0/10.0
- DSCR +5.0/10.0
- Livability +3.9/5.0
- Rent growth +2.9/5.0
- Condition / age +2.5/5.0
- Appreciation +0.0/10.0
$13,999
🖨 Deal sheet 📄 Offer letter ✓ Due diligence
Listing remarks
1974 Mobile Home in Rochester Estates. Extended living room with working wood fireplace and dining nook. 2024: - AC is refilled and working - new front door installed - new paint and trim inside throughout the house - re-sealed and insulated all the windows - new carpet, new laminate floors, tiles in the kitchen and bathroom - 5 new windows in all 3 bedrooms. - new washer 2026: - furnace motor replaced - new water heater put in Home comes with: Washer, dryer, fridge, dishwasher, wood fireplace, shed in the back for storage, accessibility ramp. Price is 14k. Lot rent is 850. Move-in ready.
Key facts
- Tiles in kitchen
- New carpet
- New paint and trim
Tags
Neighborhood map
What this means for you Summary
Snapshot
- This is a 3-bed/1.0-bath other listed at $14k.
Deal economics
- At list price, monthly cash flow is $2k ($22k/yr) — positive.
- The deal already cash-flows at list — no discount required.
- Meets the 1% rule at list price ($2k rent vs $14k).
- Cap rate 165.1% vs local median 3.2% in Rochester Hills — top-decile yield for the area; either an underpriced asset or a hidden risk that comps aren't pricing in. Stress-test before assuming the spread holds.
Location & tenants
- Location reads 77/100 on livability (#127 in MI, #3,163 nationally) — a middle-class / working-renter tenant base. Strengths: crime A+, employment A+, housing A+; Watch: health & safety D, amenities F, commute F.
- Rochester Community School District (suburban): math 60% / reading 69% proficiency, ranked #21 of 540 in MI (top 4%) — acceptable for families but not a draw, mixed tenant base, ~2y average lease; only 10% free/reduced lunch — higher-income household profile.
- Market conditions: Rents rising (+1.8%/yr); 208 active listings in the ZIP; 11 comparable units currently listed for rent nearby; rentals at typical pace (median 15d on market — plan ~3-4 weeks tenant-placement turnaround); 45% of comp listings sitting > 30 days — soft ceiling on asking rent; solid renter incomes; 2,614 units permitted in Oakland County in 2024 (721 in 5+ unit buildings).
Forward outlook
- Local home prices are declining (-3.0%/yr); year-one equity from $97 of loan paydown is wiped out by about $420 of value loss. Plan a longer hold.
- Oakland County population projected at +10% by 2050 — modest demand growth; plan on rents tracking national, not racing it.
- At projected returns (-3.0% appreciation + 1.8% rent growth), your $4k cash investment doubles in ~1 year — after that, you're playing with house money.
Negotiation context
- Only 1 days on market — expect competitive offers; lowballing is unlikely to land.
Questions for the listing agent
- Built in 1974 — when were the roof, HVAC, electrical panel, plumbing, and water heater last replaced?
- Is there a deadline driving the sale (1031 exchange, divorce, estate, relocation)? That informs how much negotiation room exists.
- Schools are A-rated — typically a magnet for longer-tenancy family renters. What's the average tenant stay here, and is there a school-zone premium baked into asking?
- The area grade is low — what's the realistic commute time and amenity access for the typical tenant pool here? Any planned neighborhood developments (good or bad) we should know about?
- What's the average days-on-market for RENTAL listings here right now (not sales)? A rising rental-DOM trend means longer vacancies and softer asking-rent achievability than the comps imply.
- What's the recent tenant-quality profile in this submarket — average credit score on applications, eviction rate, late-payment / NSF rate, and stable-employment percentage? A property-management company in the area should have these aggregated.
- How much new for-sale + rental construction is in the pipeline within 1–3 miles? Heavy new supply typically softens prices + rents 12–24 months out; constrained supply supports both.
Investment metrics
- 1% rule
- 17.62% ✓
- Cap rate
- 165.07%
- Cash-on-cash
- 567.07%
- DSCR
- 26.23
- GRM
- 0.5
CMA / ARV
No comps found within radius.
Projected returns pro-forma
-3.0% appreciation · 1.78% rent growth · sell at horizon
- IRR
- —
- Equity multiple
- 29.76×
- Total profit
- $112,751
- Equity at exit
- $2,087
- IRR
- —
- Equity multiple
- 61.79×
- Total profit
- $238,263
- Equity at exit
- $1,210
Cash invested: $3,920 (down + closing). Projections, not guarantees.
Landlord ↔ Tenant lean methodology
- Overall (STATE)
- 62 Landlord-Friendly
- State Michigan
- 62 Landlord-Friendly · EVEN
- County
- — inherits STATE
- City
- — inherits STATE
ZIP-level market 48307
- Rents YoY
- 1.8%
- Active inventory
- 208
- Price-to-rent
- 0.5×
Monthly cashflow live
- Estimated rent
- $2,467 high interval (Pro) →
- Mortgage (P&I)
- −$73
- Tax est. 1.5%
- −$17 /mo · $210/yr
- Insurance
- −$6
- HOA
- −$0
- Vacancy / Maint / Mgmt
- −$518
- Net cashflow
- $1,852
Break-even live
UW: 25.0% down · 7.5% · 30yr · 1.5% tax · 5.0% vac · 8.0% maint · 8.0% mgmt
Financing live
Cash to close
- Down payment
- $3,500
- Closing costs
- $420
- Reserves months
- —
- Total cash needed
- —
Loan-product check · same deal, 3 products live
Conventional
25% down · 7.5% · 30yr
- Down + closing
- —
- Monthly P&I
- —
- Monthly cashflow
- —
- DSCR
- —
- Eligible?
- —
Personal DTI + credit; lowest rate.
DSCR
20% down · 8.5% · 30yr
- Down + closing
- —
- Monthly P&I
- —
- Monthly cashflow
- —
- DSCR
- —
- Eligible?
- —
No personal income docs; deal must DSCR.
Hard money
10% down · 12.0% · 12mo
- Down + closing
- —
- Monthly P&I
- —
- Monthly cashflow
- —
- DSCR
- —
- Eligible?
- —
Short-term bridge; refi at stabilization.
Rent comps 11 comps
| Address | Beds | Baths | Sqft | Rent | $/sqft | DOM | Units | Dist |
|---|---|---|---|---|---|---|---|---|
| 1090 Academy Dr Rochester Hills, MI | 2.0–3.0 | 2.0 | 1565 | $2,385 | $1.52 | 1d | 1 | 0.54mi |
| 1880 E Avon Rd Rochester Hills, MI | 2.0 | 2.0 | 1294 | $4,470 | $3.45 | 1d | 1 | 0.58mi |
| 1908 Flagstone Cir Rochester, MI | 2.0 | 2.0 | 1338 | $1,750 | $1.31 | 5d | 1 | 1.09mi |
| 430 Baldwin Ave #75 Rochester, MI | 2.0 | 1.0 | 997 | $1,450 | $1.45 | 43d | 1 | 1.11mi |
| 440 Baldwin Ave Rochester, MI | 2.0 | 1.0 | 1050 | $1,350 | $1.29 | 43d | 1 | 1.12mi |
| 480 Baldwin Ave #20 Rochester, MI | 2.0 | 1.0 | 839 | $1,400 | $1.67 | 43d | 1 | 1.18mi |
| 701 Green Cir Rochester, MI | 1.0–3.0 | 1.0–2.5 | 1133 | $2,612 | $2.30 | 1d | 48 | 1.21mi |
| 1401 S Rochester Rd Rochester Hills, MI | 3.0 | 1.0–2.0 | 1024 | $2,600 | $2.54 | 1d | 7 | 1.38mi |
| 1401 S Rochester Rd Rochester Hills, MI | 3.0 | 1.0–2.0 | 1011 | $2,250 | $2.23 | 43d | 4 | 1.38mi |
| 112 Walnut Blvd Rochester, MI | 1.0–2.0 | 1.0–2.0 | 966 | $3,270 | $3.39 | 14d | 6 | 1.48mi |
| 112 Walnut Blvd Rochester, MI | 1.0–3.0 | 1.0–2.0 | 1171 | $3,400 | $2.90 | 43d | 3 | 1.48mi |
Listing history 1 events
-
2026-05-26$13,999 Active
ⓘ Source: listings_history table (triggers on properties + properties_extension) + one-shot
backfill from property_details.listing_events for pre-trigger history.
Climate risk First Street
- Flood 1/10 Low FEMA zone X (unshaded) · 0% chance over 30 yrs
- Wildfire 3/10 Moderate
- Heat 3/10 Moderate 7 d/yr ≥97°F today · 16 d/yr by 30 yrs out
- Wind 2/10 Low
- Air quality 3/10 Moderate 2 unhealthy d/yr today · 4 by 30 yrs out
Nearby sold comps map
Loading sold comps map…
Walkable amenities ~0.75 mi
Loading nearby amenities…
Taxation est. · year 1
- Rental income
- $29,606
- − Mortgage interest
- −$784
- − Property taxes
- −$210
- − Insurance
- −$70
- − Repairs & maintenance
- −$2,368
- − Management
- −$2,368
- − Depreciation
- −$407
- Taxable income
- $23,397
- Est. tax owed @ 24.0%
- −$5,615
- After-tax cash flow
- $16,612/yr
For passive investors: Depreciation is non-cash, so a rental often shows a tax loss while cash-flowing — sheltering income. Rental losses are passive: they offset passive income freely, and up to $25,000/yr can offset ordinary (W-2) income if you actively participate and your MAGI is under $100k (phasing out to $0 by $150k); unused losses carry forward. On sale, claimed depreciation is recaptured at up to 25%, and gains may owe capital-gains tax (a 1031 exchange can defer both). Figures are a year-1 estimate at your 24.0% rate — not tax advice; consult a CPA.
Schools (NCES district)
- District
- Rochester Community School District
- NCES district ID
- 2629940
- Math proficiency
- 60% ▼ -9.00%
- Reading proficiency
- 69% ▼ -4.00%
- Median HH income
- $89,242
- Composite
- 58.53/100
- National rank
- #994
- State rank
- #21 of 540 in MI
Livability — Rochester Hills
- Score
- 77/100
- State rank
- #127
- US rank
- #3163
Category grades
Schools grade is shown separately in the Schools card above.
Census & demographics
- Census place
- Rochester Hills, MI
- County
- Oakland County · 1,009,092 people
- City population
- 44,714
- Metro
- Detroit-Warren-Dearborn, MI
- Population (ZIP)
- 44,714
- Household income
- $106,576
- Rent vs Own
- Severe rent burden
- 926.0
Population outlook (Oakland County) Hauer SSP2
- Today (2025)
- 1,335,747 people
- By 2030
- 1,375,100 · +2.9%
- By 2040
- 1,435,385 · +7.5%
- By 2050
- 1,469,250 · +10.0%
- By 2075
- 1,531,946 · +14.7%
- By 2100
- 1,450,485 · +8.6%
Race, ethnicity, and origin ACS 2023
- Neighborhood character
- Predominantly White (74%)
- Race & ethnicity
- White 74% Asian 14% Two or more races 6% Black 4% Hispanic / Latino 4%
- Common ancestry
- Romanian 9% Lithuanian 3% Slovak 2%
- Foreign-born
- 19% · Canada, China, South Korea
- Languages at home
- 76% English-only · Other Indo-European 9% Spanish 3% Arabic 2%
Political lean MEDSL · Oakland
- 2024 margin
- D (+10.6) · D 54.4% · R 43.8% · Other 1.9%
- 2008→2024 swing
- -3.9pp toward R · 2008: 14.5pp · 2024: 10.6pp
- All cycles
- 2024: D+10.6 2020: D+14.1 2016: D+8.1 2012: D+8.1 2008: D+14.5
Not yet ingested
- Civics
- —
Market trends
- HPI YoY
- ▼ -339.13%
- Current HPI
- 188.8794
- Rent YoY
- ▲ 1.78%
- Metro
- Detroit-Warren-Dearborn, MI
- State GDP YoY
- ▲ 1.37%
- F500 in state
- 28
Industry mix (Fortune 500 HQ in MI)
| Industry | F500 HQs | Revenue |
|---|---|---|
| Automotive Parts | 3 | $48B |
|
||
| Automotive | 2 | $372B |
|
||
| Chemicals | 1 | $45B |
|
||
| Automotive Retail | 1 | $29B |
|
||
| Healthcare / Medical Devices | 1 | $23B |
|
||
| Automotive Technology | 1 | $20B |
|
||
Price history
1 event — show timeline
- 2026-05-26 Listed $13,999 FSBO.com
Cash-flow waterfall
monthlySold comps — $/sqft
last 12 mo · ≤1 miLoading sold comps…